

Abstract
Bla g 1 is a major allergen from Blatella germanica and one of the primary allergens used to assess cockroach allergen exposure. The epitope of an anti-Bla g 1 scFv was mapped in order to better understand cross reactivity with other group 1 cockroach allergens and patient IgE epitopes. X-ray crystallography was used to determine the structure of the scFv. The scFv epitope on Bla g 1 was located by alanine scanning site-directed mutagenesis and ELISA. Twenty-six rBla g 1-GST alanine mutants were evaluated for variations in binding to the scFv compared to the wild type allergen. Six mutants showed a significant difference in scFv binding affinity. These mutations clustered to form a discontinuous epitope mainly comprising two helices of Bla g 1. The allergen-scFv complex was modeled based on the results, and the epitope region was found to have low sequence similarity with Per a 1, especially among the residues identified as functionally important for the scFv binding to Bla g 1. Indeed, the scFv failed to bind Per a 1 in American cockroach extract. The scFv was unable to inhibit the binding of IgE antibodies from a highly cockroach allergic patient to Bla g 1. Based on the surface area of Bla g 1 occluded by the scFv, putative regions of patient IgE–Bla g 1 interactions can be inferred. This scFv could be best utilized as a capture antibody in an IgE detection ELISA, or to differentiate Bla g 1 from Per a 1 in environmental exposure assays.
Keywords: Allergen, Structure, Bla g 1, scFv, Cockroach, Epitope
1. Introduction
Allergic sensitization to cockroach-derived molecules is a risk factor for the development of asthma (Matsui et al., 2010; Salo et al., 2008). There are currently ten groups of cockroach allergens to which patients commonly become sensitized (www.allergen.org). In comparison to cat or dust mite for which a few allergens dominate most of the IgE response, the IgE response to cockroach allergens can be highly variable (Pomés et al., 2007). The three most commonly recognized allergens produced by the cockroach Blat-tella germanica are Bla g 1, Bla g 2, and Bla g 5, but the prevalence of IgE in patients in the U.S. is only 26%, 54%, and 37%, respectively (Satinover et al., 2005).
Bla g 1 and Bla g 2 are the most commonly used allergens for the assessment of cockroach allergen exposure. The threshold dose of Bla g 1 exposure established as a risk factor for sensitization is 2 U/g of dust, and 8 U/g is considered to be a risk factor for asthma morbidity (Eggleston et al., 1998; Rosenstreich et al., 1997). Allergen levels are commonly measured with antibodies raised against cockroach extracts (Pollart et al., 1991a). The cockroach extracts used to standardize these assays were initially assigned an arbitrary value based on a fixed volume of extract (Pollart et al., 1991b). The amount of Bla g 2 in 1 Unit was determined to be 80 ng, subsequent to cloning and characterization (Arruda et al., 1995; Gustchina et al., 2005). Whereas Bla g 2 is a stable globular protein, Bla g 1 is a more complex allergen, and has a fragmentation pattern on SDS-PAGE that made standardization difficult for a long time. It was only recently that 1 Unit of the allergen Bla g 1 was standardized to be 104 ng (Mueller et al., 2013). This will facilitate a better comparison of allergen exposure levels. The need for strict molecular standards instead of arbitrary units is best reflected in a study of 6 commercial cockroach extracts in which there was up to a 200 fold difference in the Bla g 1 levels (4.7–1085 U/ml) (Patterson and Slater, 2002).
Bla g 1 is a unique allergen that is composed of multiple tandem repeats of two distantly related core sequences termed α and β (Helm et al., 1996; Pomés et al., 1998; Randall et al., 2013). In other insect species, up to 7 copies of α and β are present on a single polypeptide chain (Randall et al., 2013). The two core sequences each form a pentagon of alpha helices with a sixth helix displaced above the plane of the pentagon (Mueller et al., 2013). The two pentagons of α and β interact via the rim, creating a large internal hydrophobic cavity that can bind various lipids (Mueller et al., 2013). The unstructured loops between α and β are frequently proteolyzed, leading to the mistaken impression on SDS-PAGE analysis that the protein is highly fragmented and therefore there is a consequent loss of antibody epitopes. It has been demonstrated that even with variable fragmentation patterns, antibody recognition of the allergen was consistent, indicating that the core structure remains intact (Mueller et al., 2013).
In order to better understand antibody epitopes on Bla g 1, we sought to characterize the interaction between an avian derived scFv and recombinant Bla g 1 (deVore et al., 2010; Finlay et al., 2005; Khurana and Slater, 2013). This particular scFv is proposed to be part of a multiplex assay that is under development to study the composition and potency of B. germanica extracts used in clinical settings. Knowledge of the particular epitope may be useful in understanding the cross-reactivity of the scFv with other cockroach species allergens, and may be useful in mapping patient IgE epitopes.
2. Materials and methods
2.1. Structure determination
The anti-Bla g 1 scFv was expressed in E. coli as a maltose binding protein (MBP) fusion (pDEST vector 566, provided to the NIEHS Protein Expression Core Facility by Dominic Esposito, SAIC, NCI Maryland), purified by amylose affinity chromatography followed by removal of the His-tagged-MBP by cleavage with TEV protease. The His-tag facilitated removal of the MBP and TEV with a Nickel column. For ELISA experiments, the scFv was further purified by size exclusion chromatography. For crystallography, the scFv was combined with rBla g 1-EC purified as previously described (Mueller et al., 2013), followed by size exclusion chromatography. The eluted protein corresponding to the scFv–Bla g 1 complex was concentrated to 30 mg/ml in 25 mM Tris pH 7.5 and 75 mM NaCl for crystallization screening. Crystals of the complex were not obtained, but crystals of the scFv alone were obtained by hanging drop vapor diffusion in a mother liquor of 1.8 M ammonium sulfate, 100 mM NaCl, 50 mM Tris pH 7.5–8.5 at 20 °C. Glycerol was added as a cryo-protectant at 15% (v/v), and the crystals were flash frozen in liquid N2. The data were collected at the Southeast Regional Collaborative Access Team (SER-CAT) 22 ID beamline at Advanced Photon Source and were processed with HKL2000 (Otwinowski and Minor, 1997). The structure was solved by molecular replacement using the coordinates of an anti-interferon scFv (3UX9) (Ouyang et al., 2012) as the starting model, followed by multiple rounds of model building and refinement in COOT and PHENIX (Emsley and Cowtan, 2004; Zwart et al., 2008). Data collection and refinement statistics are presented in Table 1. The final model contains scFv residues Q1-L107 and A115-V231.
Table 1.
Crystallographic data table.
| Unit cell |
a = 102.5 Å, b = 51.1 Å, c = 44.9 Å α = γ = 90° β = 105.0 |
|---|---|
| Space group | C2 |
| Resolution (Å) | 50.0–1.8 |
| No. of observations | 66,691 |
| Unique reflections | 19,780 |
| Rsym (%) (last shell)a | 4.8 (17.6) |
| I/σI (last shell) | 18.1 (4.5) |
| Mosaicity range | 0.39–0.59 |
| Completeness (%) (last shell) | 94.6 (72.0) |
| Refinement statistics | |
| Rwork (%)b | 16.5 |
| Rfree (%)c | 19.1 |
| No. of waters | 157 |
| Overall mean B value (Å) | |
| Protein | 27.5 |
| Solvent | 37.9 |
| r.m.s. Deviation from ideal values | |
| Bond length (Å) | 0.011 |
| Bond angle (°) | 1.36 |
| Dihedral angle (°) | 11.5 |
| Ramachandran statisticsd | |
| Residues in: | |
| Favored (98%) regions (%) | 97.4 |
| Allowed (>99.8%) regions (%) | 100 |
Rsym = Σ (|Ii − <I>|)/Σ(Ii) where Ii is the intensity of the ith observation and <I> is the mean intensity of the reflection.
Rwork = Σ||Fo | − |Fc ||/Σ|Fo | calculated from working data set.
Rfree was calculated from 5% of data randomly chosen not to be included in refinement.
Ramachandran results were determined by MolProbity.
2.2. Alanine scanning mutagenesis and ELISA
Thirty alanine mutants of rBla g 1-EC (Table 2) were created by site-directed mutagenesis using QuikChange II (Agilent). Twenty-six constructs expressed sufficient soluble protein for further testing. The mutants were purified by glutathione affinity and judged better than 95% pure by SDS-PAGE. The GST-tag was not removed for the ELISA experiments.
Table 2.
Bla g 1 mutatations and Δ ΔG compared to wild type measured by ELISA.
| Mutation | ΔΔG |
|---|---|
| Q41A | −0.05 |
| V49A | * |
| D50A | 0.06 |
| I53A | 0.09 |
| T57A | * |
| L60A | 0.00 |
| D76A | −1.10 |
| E79A | −1.20 |
| T80A | −1.70 |
| V83A | −0.33 |
| N93A | 0.31 |
| N96A | 0.33 |
| N104A | 0.40 |
| D107A | 0.13 |
| H113A | 0.09 |
| H129A | −0.38 |
| V133A | −0.08 |
| D141A | * |
| D151A | 0.15 |
| E161A | 0.33 |
| L167A | * |
| N171A | −0.14 |
| E177A | −0.11 |
| Q183A | 0.33 |
| T184A | −0.25 |
| E190A | −0.62 |
| N193A | −2.10 |
| K197A | −1.40 |
| E200A | −0.02 |
| D206A | −0.01 |
Failed to express.
ELISA plates were coated overnight at 4 °C with 10 μg/ml scFv in coating buffer: 0.84% NaHCO3 (w/v), 0.356% Na2CO3 (w/v), pH 9.5. The plates were washed with PBS-Tween (0.05%, v/v) and were blocked with PBS saturated with casein. Incubation was typically 1 hr at room temperature. Wild-type or mutant rBla g 1-EC was added in serial dilutions. After washing, bound rBla g 1-EC was detected with an avidin-conjugated anti-GST mAb followed by streptavidin-horse radish peroxidase (HRP) and TMB as the colorometric reagent. The data (in duplicate or triplicate) were least-squares fit to a sigmoidal curve. The IC50 of wild-type versus mutant was used to calculate ΔΔG according to Eq. (1).
2.3. Molecular modeling
Initial models of the Bla g 1-scFv complex were created with HADDOCK (Dominguez et al., 2003). One thousand initial models were generated and the 200 lowest energy structures were further refined in explicit solvent. The aligned structures were clustered into four groups based on similar orientations of Bla g 1 relative to the scFv. Further refinement of the best model from each cluster and computational evaluations of ΔΔG were performed according to previous published methods (Massova and Kollman, 1999).
2.4. Capture of Per a 1 and Bla g 1 from extracts using bead-coupled anti-Bla g 1 scFv
Purified scFv antibody was coupled to polystyrene carboxyla-beled beads (Bio-Rad Laboratories). Primed beads (2.5 × 10⁶) were coupled with purified antibody (10 μg), washed and stored in PBS with 0.1% BSA, 0.02% Tween (v/v), and 0.05% sodium azide (w/v). For the bead-based assay, 96-well filter bottom plates (Millipore) were rinsed twice with wash buffer (PBS containing 1% BSA, w/v). Antibody-coupled beads were incubated in the presence of serially diluted German cockroach (E6Cg) and American cockroach extracts (ACr) for 1 hour at room temperature with gentle mixing. Bound allergen was detected by sequential incubation with polyclonal rabbit anti-E6Cg serum (1:500), biotinylated anti-rabbit IgG (H + L) (1:1000), and streptavidin-R-phycoerythrin (RPE) (1:250). All the reagents were diluted in the wash buffer. After the final incubation, the beads were resuspended in wash buffer and the median fluorescence intensities (MFI) were measured using a BioPlex 200 fluorimeter. The data were exported to Graph Pad Prism v5.0 for analysis.
2.5. Testing inhibition of IgE antibody binding to Bla g 1 by anti-Bla g 1 scFv
Serum was kindly provided by Dr. Robert Wood as part of a collaboration with the National Institute of Allergy and Infectious Diseases-funded Inner City Asthma Consortium (Oseroff et al., 2012). The patient was recruited under an Institutional Review Board protocol from Johns Hopkins University (National Institute of Allergy and Infectious Diseases protocol ICAC-18), and had a history of allergic rhinitis and/or asthma, as well as a strong sensitivity to cockroach (Total IgE 1852 kU/l; cockroach IgE >100 kU/l; and allergen-specific IgE of 29.6, 9.03, 23.0, 94.5, 69.6 kU/l to Bla g 1, Bla g 2, Bla g 4, Bla g 5 and Per a 7, respectively).
A microtiter plate was coated with rBla g 1 at 1 μg/well and incubated overnight at 4 °C. The plate was blocked with PBS-Tween containing 1% BSA. Antibodies or anti-Bla g 1 scFv were added and mixed with serum at a final dilution of 1:6 in the plate wells and incubated at room temperature for 2.5 h. Final concentrations of the mAbs were 0.67 μM (100 μg/ml) and three consecutive 1:10 dilutions. The concentrations of scFv tested were double that of the mAbs (highest value 1.33 μM, equivalent to 32 μg/ml of scFv) to take account of the fact that one binding site is present in scFv versus two in a monoclonal antibody, each corresponding to one Fab. A rabbit anti-Bla g 1 polyclonal Ab (1:4 and 1:10) and an anti-Bla g 1 mAb were used as positive controls, and an anti-Der p 1 mAb was used as a negative control. After washing the plate, per-oxidase conjugated goat anti-human IgE (KPL, Gaithersburg, MD) was added to the wells (1:1000) and incubated for 1 h. ABTS/H2O2 was added (1:1000) and absorbance was read at 405 nm.
3. Results
3.1. Analysis of the scFv structure
In order to better understand the interactions of antibodies with allergens, the complex structure of an avian scFv with the cockroach allergen Bla g 1 was sought using crystallography. As a first step, one set of conditions produced crystals that diffracted at better than 1.8 Å resolution, which were found to contain only scFv. The crystal structure of the scFv is presented in Fig. 1.
Fig. 1.

Crystal structure of scFv and analysis. Panel A shows a diagram of the two polypeptide chains of the scFv molecules (molecules 1 and 2), with colors corresponding to the ribbon diagram shown in panel B. The distances between the visible termini are indicated in angstroms. The abbreviations are LC (derived from light chain), HC (derived from heavy chain). Panel C shows an electrostatic rendering of the surface of the scFv. The dashed black ellipse indicates the antibody-combining site.
The scFv construct is a fusion of the immunoglobulin domains from the heavy chain and light chain of the original antibody against Bla g 1 that together form the antibody-combining site. The Bla g 1 scFv crystallized as a domain-swapped dimer where the N-terminal immunoglobulin light chain domain of one monomer forms an antibody-combining site with the C-terminal heavy chain domain of the other (Fig. 1A). In the crystal structure there is no density for the seven residue linker region (108–114) connecting the immunoglobulin domains. The connectivity between the domains was determined based on distances. The separation as annotated is 16.8 Å which is possible with a seven residue loop (Fig. 1B). To connect the two domains forming the antibody combining site with one polypeptide would require covering a distance of 35.0 Å with 7 residues, which is physically impossible.
Consistent with the dimeric nature of the scFv in the crystal, the Bla g 1-scFv complex eluted with a 2:2 stoichiometry in the size exclusion chromatography used for purification. If the complex contained one Bla g 1 and one scFv it would be approximately 40 kDa and if there were two of each the complex will be ~80 kDa. By comparison with Bla g 5 (~50 kDa dimer in solution) the Bla g 1-scFv peak eluted prior to Bla g 5, which suggested that a dimeric complex was forming (data not shown).
An analysis of the scFv structure revealed that basic residues dominated the antibody-combining site (Fig. 1C). This was not surprising since Bla g 1 has an unusually low pI of 4.5, and there are numerous acidic residues on the surface. This suggested that electorstatic interactions are likely important in Bla g 1 binding to the scFv. With this information, additional low ionic strength crystallization conditions were screened but did not produce any new crystals of the complex of sufficient quality. As an alternative to mapping the epitope via crystallography, alanine scanning muatagenesis in combination with ELISA was used to identify functionally important residues for the interaction.
3.2. ELISA
Since acidic residues were considered likely to be important, we focused primarily on mutating acidic and other charged residues dispersed on the surface of Bla g 1 in the first round of mutants prepared and screened by ELISA. Originally, only the D76A mutant had a markedly decreased ΔΔG of binding compared to the WT in the first round of screening. Based on this result, additional adjacent residues were mutated to alanine and compared to WT for relative affinity via ELISA. In total 30 mutants were tested; examples of the ELISA data are given in Fig. 2. Four failed to express sufficiently for assays, and six had a substantially different ΔΔG, as judged by a shift in the binding curve of at least one serial dilution, or a factor of 2 in concentration (ΔΔG = −0.41) (Mueller et al., 2001). A summary of the mutations studied and the corresponding changes in ΔG are presented in Table 2. The six residues determined to be functionally important are highlighted on the structure in Fig. 3: D76, E79, T80, E190, N193, K197. These residues are positioned in one region of the protein surface, but are located on helices 4 and 5′, defining a discontinuous epitope.
Fig. 2.

Representative ELISA data. The four curves shown correspond to Wild type (blue), E79A (red), T184A (green), and D76A (purple). The lines are the best least-squares fit to a sigmoidal function (For interpretation of the references to color in this figure legend, the reader is referred to the web version of this article.).
Fig. 3.

ELISA results mapped to the structure of Bla g 1. Residues on the structure of Bla g 1 are color coded according to the results of the ELISA experiments listed in Table 1. Magenta indicates residues with a significant difference in ΔΔG compared to WT, yellow indicates no significant change, and green indicates the mutation was created but failed to express (For interpretation of the references to color in this figure legend, the reader is referred to the web version of this article.).
3.3. Molecular modeling and analysis of epitope
Using the ELISA data and the structures of the unbound scFv and Bla g 1, molecular models were created of the allergen-scFv complex using the program HADDOCK (Dominguez et al., 2003). This program generated 1000 possible structures, and further refined the 199 lowest energy structures in explicit solvent. The refined structures were clustered into 4 groups according to structural similarity: 127 in the first group, 50 in the second group, 12 in the third group, and 6 in the fourth group. Primarily the same residues are involved in the interface in all four groups (Table 3), but the orientation of Bla g 1 relative to the scFv changes. In groups 1 and 2, which account for 89% of the low energy structures, Bla g 1 is rotated approximately 140 degrees about an axis that intersects the center of mass of the two proteins as shown in Fig. 4. Groups 3 and 4 are similar in orientation, approximately orthogonal to the first two groups rotated about the same axis (data not shown).
Table 3.
Number of structures in each cluster showing an interaction between specific Bla g 1 residues and the scFv.
| Bla g 1 Residue | Cluster 1 | Cluster 2 | Cluster 3 | Cluster 4 |
|---|---|---|---|---|
| 64 | 0 | 0 | 0 | 3 |
| 65 | 0 | 0 | 0 | 1 |
| 67 | 0 | 0 | 0 | 3 |
| 68 | 3 | 33 | 2 | 6 |
| 70 | 0 | 0 | 0 | 1 |
| 71 | 19 | 50 | 2 | 4 |
| 72 | 51 | 50 | 8 | 3 |
| 74 | 126 | 48 | 12 | 5 |
| 75 | 123 | 50 | 12 | 6 |
| 76 | 127 | 50 | 12 | 6 |
| 77 | 126 | 50 | 12 | 6 |
| 79 | 127 | 48 | 12 | 6 |
| 80 | 127 | 50 | 12 | 6 |
| 81 | 2 | 1 | 0 | 0 |
| 82 | 5 | 0 | 10 | 0 |
| 83 | 126 | 49 | 12 | 6 |
| 84 | 126 | 46 | 6 | 0 |
| 86 | 14 | 15 | 8 | 0 |
| 87 | 124 | 34 | 3 | 0 |
| 88 | 75 | 4 | 0 | 0 |
| 110 | 0 | 0 | 4 | 0 |
| 113 | 16 | 0 | 7 | 1 |
| 184 | 91 | 29 | 0 | 0 |
| 187 | 113 | 41 | 0 | 0 |
| 188 | 126 | 49 | 0 | 0 |
| 189 | 127 | 50 | 6 | 5 |
| 190 | 127 | 50 | 10 | 6 |
| 192 | 0 | 32 | 0 | 2 |
| 193 | 95 | 50 | 12 | 6 |
| 196 | 6 | 8 | 0 | 4 |
| 197 | 111 | 50 | 11 | 6 |
| 198 | 0 | 3 | 0 | 0 |
| 200 | 7 | 23 | 0 | 6 |
| 201 | 1 | 33 | 0 | 6 |
Fig. 4.
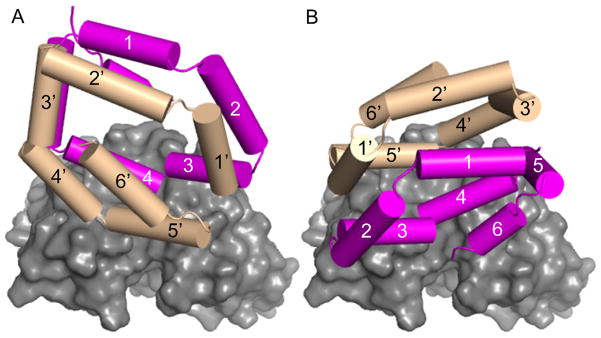
Two possible orientations of Bla g 1 binding to scFv. The lowest energy structure of the two major clusters from the docking results are displayed: panel A represents cluster 1 and panel B represents cluster 2. Bla g 1 helices are rendered as colored cylinders and the scFv is rendered with a solid, gray surface and oriented the same in panels A and B. Bla g 1 subunit α is colored magenta and subunit β is colored tan. Cluster 2 was judged more likely based on the residue interactions in the epitope.
In order to see if one group of models should be favored over the others, we carefully examined the interacting residues. The charge on the scFv paratope is dominated by three basic residues K65, R90, and K219 (Fig. 1C). In all the models buried acidic residues on Bla g 1 compensate the basic residues on the scFv including the important residues for binding listed in Table 2. However there is an acidic residue, D147, positioned to one side of the scFv epitope that forms an electrostatic interaction with K197 of Bla g 1 only in cluster 2. In the other three clusters K197 does not appear to significantly interact with the scFv, which is unsatisfactory given the observation that it contributes substantially to the binding energy (ΔΔG = −1.4 kCal/mol). In further molecular modeling studies designed to mimic the reduction of the side chain to alanine, we found that only group 2 predicted a negative ΔΔG for the alanine substitutions of all six residues: D76, E79, T80, E190, N193, K197 (data not shown). Hence, we suggest that group 2 contains the most probable orientation of Bla g 1 because it provides the best agreement with the ELISA data.
Since all of the models predict very similar residues on Bla g 1 to be involved in the epitope with the scFv (Table 3) any of the models should be useful in determining what other residues would be occluded from a second antibody interacting with Bla g 1. From the lowest energy structure of group 2, we simulated the interaction with a second antibody by rolling different sized spheres around the complex structure, up to the size of a typical epitope radius of 17 Å. In Fig. 5 Bla g 1 is colored based on this evaluation, with residues colored green highly likely to be accessible, yellow likely to be accessible, orange possibly occluded, and red completely occluded from interactions with the second antibody. In broad terms, helices 3, 4, 4′, and 5′ are mostly occluded while helices 1, 2, 5, 6, 1′, 2′, and 3′ would be mostly accessible to other antibodies.
Fig. 5.

Simulation of occluded regions of Bla g 1 by the scFv. The scFv is rendered as a ribbon diagram with a semitransparent surface and colored gray. Bla g 1 is rendered as a ribbon diagram and a semi transparent surface. The surface is colored as scFv epitope residues (red), likely occluded (orange), likely accessible (yellow), and accessible (green) (For interpretation of the references to color in this figure legend, the reader is referred to the web version of this article.).
3.4. scFv binding of cockroach group 1 allergens from extract
It was previously noted that residues in the vicinity of helix 4 are significantly different in Bla g 1 versus Per a 1 (Mueller et al., 2013). This suggested that an antibody (like the scFv) that interacts with helix 4 should be able to differentiate between the group 1 allergens from B. germanica versus Periplaneta americana. To test this hypothesis, the chicken derived anti-Bla g 1 scFv was used in a bead based assay for binding to group 1 allergen of B. germanica and P. americana. The scFv was able to capture Bla g 1 present in B. germanica extract (E6Cg) but Per a 1 from P. americana extract (ACr) was not able to bind this scFv (Fig. 6A). As a positive control for the quality of the extracts, an anti-Bla g 3 scFv successfully captured Bla g 3 and Per a 3 from the respective extracts (Fig. 6B). This result is consistent with helix 4 containing important residues of the scFv epitope.
Fig. 6.
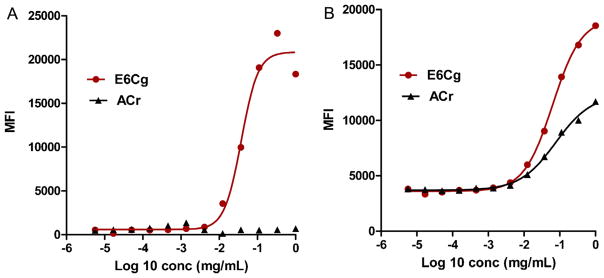
Binding of Bla g 1 and Per a 1 with anti-Bla g 1 scFv. Beads coupled with anti Bla g 1 and anti Bla g 3 scFv were mixed and analyzed for binding with Bla g 1 (A) and Bla g 3 (B) in E6Cg and their homologs (Per a 1 and Per a 3) in American cockroach extracts (ACr). The binding is presented as 4 Parametric logistic sigmoidal curve generated using GraphPad Prism 5 by least squares fit method.
3.5. Lack of inhibition of IgE antibody binding to Bla g 1 by scFv
No significant inhibition of IgE antibody binding to Bla g 1 was observed with the anti-Bla g 1 scFv up to a concentration of 1.33 μM (32 μg/ml). The scFv showed an equivalent behavior to an anti-Der p 1 monoclonal antibody used as negative control up to 0.67 μM (100 μg/ml), whereas an inhibition of up to 40% was observed with an anti-Bla g 1 specific mAb, used as positive control. A second positive control, consisting of a polyclonal rabbit antiserum raised against recombinant Bla g 1, inhibited IgE antibody binding to Bla g 1 by 58% at a 1:4 dilution.
4. Discussion
4.1. Antibody epitopes
Thirty years ago, Benjamin et al. (1984) published a milestone review paper stating that “… most of the accessible surface of any globular protein is potentially immunogenic…”. This has been supported by numerous studies and recently refined in a review article by Aalberse and Crameri (2011) covering IgE epitopes. This review hypothesizes that “… all epitopes can induce IgE antibodies, but some are more likely to do so than others.” They further advocate that in order to better understand allergy, detailed structural information on the allergen epitope and the antibody combining site interaction needs to be correlated with clinical and epidemiological data. In this paper we sought to describe the antibody-allergen interaction between a model scFv and the cockroach allergen Bla g 1 in order to better understand the species specificity of the scFv and determine if the recognized epitope was relevant for patient IgE interactions.
Antibody epitopes can be mapped by a number of methods (Dall’antonia et al., 2013). The most elegant and precise are co-structures determined either by X-ray crystallography or NMR spectroscopy (Chruszcz M et al., 2012; Li et al., 2008; Wilkinson et al., 2009). Despite numerous attempts, we were unsuccessfully in obtaining a co-structure of the scFv and Bla g 1 by crystallography. In data not shown, the complex tended to precipitate rapidly at room temperature, and the quality of the Bla g 1 NMR spectra was very poor, which suggested that determining the structure of the complex by NMR might be unfeasible. These properties would also make it difficult to perform other indirect yet high-resolution methods such as measuring H–D exchange in a protection assay to map the epitope (Mueller et al., 2001; Paterson and Englander, 1990). Nevertheless, the structure of the scFv alone was determined and with the previously determined Bla g 1 structure, we were able to generate hypotheses regarding the nature of the epitope. Based on these hypotheses, we adopted a shotgun approach of alanine-scanning-mutagenesis, focusing primarily on acidic residues scattered around the surface, and testing by ELISA their importance in binding to the scFv. From these results, we employed a guided molecular modeling approach to propose a high-resolution epitope and paratope.
4.2. scFv–Bla g 1 interactions
The buried surface area between Bla g 1 and the scFv average ~900 Å2 in the most likely cluster of HADDOCK structures. This value is in line with many protein-antibody interactions, which usually buried 600–900 Å2 per partner (Benjamin et al., 1984). As predicted, the epitope involved several acidic residues including E190, E79, E77, and D76 that interact with scFv residues K219, R90, and R211. The most surprising result from the ELISA data was the importance of K197 from Bla g 1, which we suggest must interact with the only acidic residue in the paratope D147. This asymmetric interaction allowed us to differentiate the suggested orientations of the Bla g 1 structure with respect to the scFv. Due to the highly symmetric nature of Bla g 1, this discovery was fortuitous.
While much of the analysis has focused on the readily apparent electrostatic interactions, there are other important contributions to the epitope and paratope. For example, in cluster 2 the side chain of Bla g 1 N193 putatively makes a hydrogen bond with the hydroxyl of Y172 on the scFv. Similarly, E79 of Bla g 1 is proposed to make hydrogen bond interactions with either N49 or N52 of the scFv in different models in cluster 2. Therefore, while the suggested electrostatic interactions guided our initial alanine scanning, the overall importance is possibly overstated.
4.3. Species specific cross-reactivity and environmental assessment
The observation that the scFv did not bind Per a 1 from P. americana extract further confirmed that helix 4 was involved in the epitope. A structural alignment indicated that this surface region was noted to differ significantly between Bla g 1 and Per a 1 (Mueller et al., 2013). In combination with other non-species-specific antibodies, this could be useful in differentiating allergen exposure to Blatella germanica from other cockroach species. A commonly used antibody currently is the mAb 10A6, which was raised against German cockroach extracts but recognized the group 1 allergens from 9 of 14 cockroach species, including the genera Blattella, Periplaneta, Blatta, Leucophea, and Supella sp. (Pollart et al., 1991b; Melen et al., 1999). On the other hand, the anti-Bla g 2 mAb 7C11 is B. germanica specific. Although it has not been tested on a purified Bla g 2-homolog from Periplaneta, none of the five main residues involved in the allergen-mAb 7C11 interaction are present in Per a 2. These residues were identified in the X-ray crystal structure of Bla g 2 in complex with Fab′ fragments of mAb 7C11 (Li et al., 2008). Their relevance in antibody recognition was confirmed by mutagenesis analysis (Glesner et al., 2011). We suggest that similar to testing with mAbs 7C11 and 10A6, this scFv could also be used in combination with 10A6 to measure total cockroach environmental exposure, and differentiate B. germanica specific exposure. For the purpose of evaluating the potency of clinical extracts, it is also extremely useful to know how and why this scFv does not detect Per a 1.
4.4. Patient IgE
In order to better understand the allergic IgE response, we attempted to block patient IgE binding with the scFv. In the one highly allergic patient tested, there was no significant difference in IgE binding with increasing concentrations of the scFv. Returning to our analysis of the possible occlusion of other antibodies by the scFv–Bla g 1 interaction (Fig. 5), we suggest that the green shaded residues are the most likely sites of IgE interactions, which include helices 1, 2, 5, 6, 1′, 2′, and 3′. It remains to be determined whether this result can be generalized to other patients. Several studies with grass pollen allergens suggested that IgE epitopes tend to cluster (Flicker et al., 2002; Vanree and Aalberse, 1995), so by elimination, the non-occluded areas in Fig. 5 may contain IgE antibody binding epitopes recognized by other cockroach allergic patients.
4.5. Summary
The interactions of an scFv with Bla g 1 were mapped using a combination of X-ray crystallography, scanning alanine mutagenesis, ELISA, and molecular modeling. From the lack of inhibition of patient IgE by the scFv, regions of allergy-associated epitopes can be inferred. The results provided confirmation that helix 4 can be used to differentiate Bla g 1 from Per a 1, in assays of environmental exposure and extract potency.
Acknowledgments
This research was supported in part by Research Project Number Z01-ES102885-01 to REL, and ZIA-ES102645 to LCP in the Intramural Research Program of the National Institute of Environmental Health Sciences, National Institutes of Health. Research reported in this publication was supported in part by the National Institute of Allergy and Infectious Diseases of the National Institutes of Health under Award Number R01AI077653 (PI: AP). The content is solely the responsibility of the authors and does not necessarily represent the official views of the National Institutes of Health. Use of the Advanced Photon Source was supported by the U. S. Department of Energy, Office of Science, Office of Basic Energy Sciences, under Contract No. W-31-109-Eng-38. The authors thank Traci Hall and Andrea Moon for a critical reading of the manuscript.
References
- Aalberse RC, Crameri R. IgE-binding epitopes: a reappraisal. Allergy. 2011;66:1261–1274. doi: 10.1111/j.1398-9995.2011.02656.x. [DOI] [PubMed] [Google Scholar]
- Arruda LK, Vailes LD, Mann BJ, Shannon J, Fox JW, Vedvick TS, Hayden ML, Chapman MD. Molecular-cloning of a major cockroach (Blattella-Germanica) allergen, Bla-G-2—sequence homology to the aspartic proteases. J Biol Chem. 1995;270:19563–19568. doi: 10.1074/jbc.270.33.19563. [DOI] [PubMed] [Google Scholar]
- Benjamin DC, Berzofsky JA, East IJ, Gurd FR, Hannum C, Leach SJ, Margoliash E, Michael JG, Miller A, Prager EM, et al. The antigenic structure of proteins: a reappraisal. Annu Rev Immunol. 1984;2:67–101. doi: 10.1146/annurev.iy.02.040184.000435. [DOI] [PubMed] [Google Scholar]
- Chruszcz M, Pomés A, Glesner J, Vailes LD, Osinski T, Porebski PJ, Majorek KA, Heymann PW, Platts-Mills TA, Minor W, Chapman MD. Molecular determinants for antibody binding on group 1 house dust mite allergens. J Biol Chem. 2012;287 (10):7388–7398. doi: 10.1074/jbc.M111.311159. [DOI] [PMC free article] [PubMed] [Google Scholar]
- Dall’antonia F, Pavkov-Keller T, Zangger K, Keller W. Structure of allergens and structure based epitope predictions. Methods. 2013;66 (1):3–21. doi: 10.1016/j.ymeth.2013.07.024. [DOI] [PMC free article] [PubMed] [Google Scholar]
- deVore NC, Huynh S, Dobrovolskaia EN, Slater JE. Multiplex microbead measurements for the characterization of cat and ragweed allergen extracts. Ann Allergy Asthma Immunol. 2010;105:351–358. doi: 10.1016/j.anai.2010.09.026. [DOI] [PubMed] [Google Scholar]
- Dominguez C, Boelens R, Bonvin AM. HADDOCK: a protein-protein docking approach based on biochemical or biophysical information. J Am Chem Soc. 2003;125:1731–1737. doi: 10.1021/ja026939x. [DOI] [PubMed] [Google Scholar]
- Eggleston PA, Rosenstreich D, Lynn M, Gergen P, Baker D, Kattan M, Mortimer KM, Mitchell H, Ownby D, Slavin R, Malveaux F. Relationship of indoor allergen exposure to skin test sensitivity in inner-city children with asthma. J Allergy Clin Immunol. 1998;102:563–570. doi: 10.1016/s0091-6749(98)70272-6. [DOI] [PubMed] [Google Scholar]
- Emsley P, Cowtan K. Coot: model-building tools for molecular graphics. Acta Crystallogr, Sect D: Biol Crystallogr. 2004;60:2126–2132. doi: 10.1107/S0907444904019158. [DOI] [PubMed] [Google Scholar]
- Finlay WJJ, deVore NC, Dobrovolskaia EN, Gam A, Goodyear CS, Slater JE. Exploiting the avian immunoglobulin system to simplify the generation of recombinant antibodies to allergenic proteins. Clin Exp Allergy. 2005;35:1040–1048. doi: 10.1111/j.1365-2222.2005.02307.x. [DOI] [PubMed] [Google Scholar]
- Flicker S, Steinberger P, Norderhaug L, Sperr WR, Majlesi Y, Valent P, Kraft D, Valenta R. Conversion of grass pollen allergen-specific human IgE into a protective IgG(1) antibody. Eur J Immunol. 2002;32:2156–2162. doi: 10.1002/1521-4141(200208)32:8<2156::AID-IMMU2156>3.0.CO;2-A. [DOI] [PubMed] [Google Scholar]
- Glesner J, Wunschmann S, Li M, Gustchina A, Wlodawer A, Himly M, Chapman MD, Pomes A. Mechanisms of allergen-antibody interaction of cockroach allergen Bla g 2 with monoclonal antibodies that inhibit IgE antibody binding. PLoS One. 2011;6 doi: 10.1371/journal.pone.0022223. [DOI] [PMC free article] [PubMed] [Google Scholar]
- Gustchina A, Li M, Wunschmann S, Chapman MD, Pomes A, Wlodawer A. Crystal structure of cockroach allergen Bla g 2, an unusual zinc binding aspartic protease with a novel mode of self-inhibition. J Mol Biol. 2005;348:433–444. doi: 10.1016/j.jmb.2005.02.062. [DOI] [PubMed] [Google Scholar]
- Helm R, Cockrell G, Stanley JS, Brenner RJ, Burks W, Bannon GA. Isolation and characterization of a clone encoding a major allergen (Bla g Bd90K) involved in IgE-mediated cockroach hypersensitivity. J Allergy Clin Immunol. 1996;98:172–180. doi: 10.1016/s0091-6749(96)70240-3. [DOI] [PubMed] [Google Scholar]
- Khurana T, Slater JE. Update on the FDA/CBER allergen standardization program. Arbeiten au dem Paul-Ehrlich-Institut. 2013;97:37–44. [PubMed] [Google Scholar]
- Li M, Gustchina A, Alexandratos J, Wlodawer A, Wunschmann S, Kepley CL, Chapman MD, Pomes A. Crystal structure of a dimerized cockroach allergen Bla g 2 complexed with a monoclonal antibody. J Biol Chem. 2008;283:22806–22814. doi: 10.1074/jbc.M800937200. [DOI] [PMC free article] [PubMed] [Google Scholar]
- Massova I, Kollman PA. Computational alanine scanning to probe protein-protein interactions: a novel approach to evaluate binding free energies. J Am Chem Soc. 1999;121:8133–8143. [Google Scholar]
- Matsui EC, Sampson HA, Bahnson HT, Gruchalla RS, Pongracic JA, Teach SJ, Gergen PJ, Bloomberg GR, Chmiel JF, Liu AH, Kattan M, Sorkness CA, Steinbach SF, Story RE, Visness CM. Allergen-specific IgE as a biomarker of exposure plus sensitization in inner-city adolescents with asthma. Allergy. 2010;65:1414–1422. doi: 10.1111/j.1398-9995.2010.02412.x. [DOI] [PMC free article] [PubMed] [Google Scholar]
- Melen E, Pomes A, Vailes LD, Arruda LK, Chapman MD. Molecular cloning of Per a 1 and definition of the cross-reactive Group 1 cockroach allergens. J Allergy Clin Immunol. 1999;103:859–864. doi: 10.1016/s0091-6749(99)70430-6. [DOI] [PubMed] [Google Scholar]
- Mueller GA, Smith AM, Chapman MD, Rule GS, Benjamin DC. Hydrogen exchange nuclear magnetic resonance spectroscopy mapping of antibody epitopes on the house dust mite allergen Der p 2. J Biol Chem. 2001;276:9359–9365. doi: 10.1074/jbc.M010812200. [DOI] [PubMed] [Google Scholar]
- Mueller GA, Pedersen LC, Lih FB, Glesner J, Moon AF, Chapman MD, Tomer KB, London RE, Pomes A. Novel structure of cockroach allergen Bla g 1 has implications for allergenicity and exposure assessment. J Allergy Clin Immunol. 2013;132:1420–1426. doi: 10.1016/j.jaci.2013.06.014. [DOI] [PMC free article] [PubMed] [Google Scholar]
- Oseroff C, Sidney J, Tripple V, Grey H, Wood R, Broide DH, Greenbaum J, Kolla R, Peters B, Pomes A, Sette A. Analysis of T cell responses to the major allergens from German cockroach: epitope specificity and relationship to IgE production. J Immunol. 2012;189:679–688. doi: 10.4049/jimmunol.1200694. [DOI] [PMC free article] [PubMed] [Google Scholar]
- Otwinowski Z, Minor W. Processing of X-ray diffraction data collected in oscillation mode. Method Enzymol. 1997;276:307–326. doi: 10.1016/S0076-6879(97)76066-X. [DOI] [PubMed] [Google Scholar]
- Ouyang SY, Gong B, Li JZ, Zhao LX, Wu W, Zhang FS, Sun LN, Wang SJ, Pan M, Li C, Liang WG, Shaw N, Zheng J, Zhao GP, Wang Y, Liu ZJ, Liang MF. Structural insights into a human anti-IFN antibody exerting therapeutic potential for systemic lupus erythematosus. J Mol Med. 2012;90:837–846. doi: 10.1007/s00109-012-0866-3. [DOI] [PubMed] [Google Scholar]
- Paterson Y, Englander SW, Roder H. An antibody binding site on cytochrome c defined by hydrogen exchange and two-dimensional NMR. Science. 1990;249:755–759. doi: 10.1126/science.1697101. [DOI] [PMC free article] [PubMed] [Google Scholar]
- Patterson ML, Slater JE. Characterization and comparison of commercially available German and American cockroach allergen extracts. Clin Exp Allergy. 2002;32:721–727. doi: 10.1046/j.1365-2222.2002.01397.x. [DOI] [PubMed] [Google Scholar]
- Pollart SM, Smith TF, Morris EC, Gelber LE, Plattsmills TAE, Chapman MD. Environmental exposure to cockroach allergens—Analysis with Mono-clonal Antibody-Based Enzyme Immunoassays. J Allergy Clin Immunol. 1991a;87:505–510. doi: 10.1016/0091-6749(91)90009-d. [DOI] [PubMed] [Google Scholar]
- Pollart SM, Mullins DE, Vailes LD, Hayden ML, Plattsmills TAE, Sutherland WM, Chapman MD. Identification, quantitation, and purification of cockroach allergens using monoclonal-antibodies. J Allergy Clin Immunol. 1991b;87:511–521. doi: 10.1016/0091-6749(91)90010-l. [DOI] [PubMed] [Google Scholar]
- Pomés A, Melen E, Vailes LD, Retief JD, Arruda LK, Chapman MD. Novel allergen structures with tandem amino acid repeats derived from German and American cockroach. J Biol Chem. 1998;273:30801–30807. doi: 10.1074/jbc.273.46.30801. [DOI] [PubMed] [Google Scholar]
- Pomés A, Wunschmann S, Hindley J, Vailes LD, Chapman MD. Cockroach allergens: function, structure and allergenicity. Protein Pept Lett. 2007;14:960–969. doi: 10.2174/092986607782541178. [DOI] [PubMed] [Google Scholar]
- Randall TA, Perera L, London RE, Mueller GA. Genomic RNAseq and molecular modeling evidence suggests that the major allergen domain in insects evolved from a homodimeric origin. Genome Biol Evol. 2013;5:2344–2358. doi: 10.1093/gbe/evt182. [DOI] [PMC free article] [PubMed] [Google Scholar]
- Rosenstreich DL, Eggleston P, Kattan M, Baker D, Slavin RG, Gergen P, Mitchell H, McNiffMortimer K, Lynn H, Ownby D, Malveaux F. The role of cockroach allergy and exposure to cockroach allergen in causing morbidity among inner-city children with asthma. New Engl J Med. 1997;336:1356–1363. doi: 10.1056/NEJM199705083361904. [DOI] [PubMed] [Google Scholar]
- Salo PM, Arbes SJ, Crockett PW, Thorne PS, Cohn RD, Zeldin DC. Exposure to multiple indoor allergens in US homes and its relationship to asthma. J Allergy Clin Immunol. 2008;121:678–684. doi: 10.1016/j.jaci.2007.12.1164. [DOI] [PMC free article] [PubMed] [Google Scholar]
- Satinover SM, Reefer AJ, Pomes A, Chapman MD, Platts-Mills TAE, Wood-folk JA. Specific IgE and IgG antibody-binding patterns to recombinant cockroach allergens. J Allergy Clin Immunol. 2005;115:803–809. doi: 10.1016/j.jaci.2005.01.018. [DOI] [PubMed] [Google Scholar]
- Vanree R, Aalberse RC. Rabbit Igg Directed to a Synthetic C-Terminal Peptide of the Major Grass-Pollen Allergen Lol-P-I Inhibits Human Basophil Histamine-Release Induced by Natural Lol-P-I. Int. Arch Allergy Immunol. 1995;106:250–257. doi: 10.1159/000236850. [DOI] [PubMed] [Google Scholar]
- Wilkinson IC, Hall CJ, Veverka V, Shi JY, Muskett FW, Stephens PE, Taylor RJ, Henry AJ, Carr MD. High Resolution NMR-based model for the structure of a scFv-IL-1 beta complex potential for nmr as a key tool in therapeutic antibody design and development. J Biol Chem. 2009;284:31928–31935. doi: 10.1074/jbc.M109.025304. [DOI] [PMC free article] [PubMed] [Google Scholar]
- Zwart PH, Afonine PV, Grosse-Kunstleve RW, Hung LW, Ioerger TR, McCoy AJ, McKee E, Moriarty NW, Read RJ, Sacchettini JC, Sauter NK, Storoni LC, Terwilliger TC, Adams PD. Automated structure solution with the PHENIX suite. Methods Mol Biol. 2008;426:419–435. doi: 10.1007/978-1-60327-058-8_28. [DOI] [PubMed] [Google Scholar]