

Abstract
Numerous previous studies have revealed that pleomorphic adenoma gene-like 2 (PLAGL2) is a transcription factor that is active in cancer progression. The aim of this study was to investigate the role of PLAGL2 in the development, progression and prognosis of gastrointestinal cancer. Immunohistochemical analysis revealed that PLAGL2 was expressed in gastrointestinal tumors and adjacent normal tissues. The expression of PLAGL2 was significantly higher in 225 colorectal cancer tissues than in 66 adjacent non-tumor tissues (P = 0.037). However, expression was not significantly different between 286 gastric tumors and 57 adjacent non-tumor tissues (P = 0.352). Moreover, the PLAGL2 expression level significantly correlated with the depth of tumor invasion in colorectal cancer (P = 0.030). However, the PLAGL2 expression level significantly correlated with tumor size in gastric cancer (P = 0.046). Furthermore, we performed survival analyses and found that neither higher nor lower PLAGL2 expression was a prognostic factor in gastrointestinal cancer. Our findings indicate that PALGL2 serves as a tumor oncoprotein in the development and progression of colorectal cancer. However, the role of this protein in the development, progression and prognosis of gastric cancer is uncertain. Further investigation into the molecular mechanisms of PLAGL2 activity in gastrointestinal cancer is warranted.
Keywords: Gastrointestinal cancer, PLAGL2, immunohistochemistry, tumor invasion, prognosis
Introduction
Gastrointestinal cancer is one of the most common malignancies worldwide. In recent times, gastrointestinal cancer incidence rates have increased year over year [1,2]. As is the case for other cancers, the development of gastrointestinal cancer originates from disturbances in the cellular functions of self-renewal, differentiation, survival and proliferation [3]. These disturbances are frequently driven by genetic abnormalities in cancer cells. In the recent studies, the pleomorphic adenoma gene (PLAG)-family proteins (e.g., PLAG1, PALGL1 and PLAGL2) have been shown to play an important role in the regulation of a wide variety of physiological processes in mammals, including cell proliferation and tissue-specific gene regulation. These proteins may also play a role in complex pathologies such as tumorigenicity [4,5].
Pleomorphic Adenoma Gene-like 2 (PLAGL2) is a zinc-finger transcription factor located in the nucleus [4,6-10] that was initially identified through sequence homology to its family member PLAG1, a proto-oncogene frequently rearranged and overexpressed in pleomorphic salivarygland adenomas, lipoblastomas, uterine leiomyomas, leiomyosarcomas, and smooth tumors [9,11-15]. PLAGL2 was initially found in mouse cell lines and fetal human tissues [8,11]. But soon afterwards, other studies revealed that PLAGL2 is ubiquitously expressed in all adult human tissues [10,16]. Like PLAG1, accumulating evidence indicated that PLAGL2 plays an important role in cancer progression [12,17-20]. Hensen et al. showed that overexpressed PLAGL2 causes neoplastic transformation in NIH3T3 cells [12]. Moreover, PLALG2 overexpression triggers the development of acute myeloid leukemia (AML) in the mouse, and the expression of PLAGL2 was elevated in 20% of AML samples [17]. In human malignant gliomas, Zheng et al. used integrated genomic and biological analyses to determine that the PLAGL2 gene was targeted for amplification and high expression [18]. Recent studies have shown that induced PLAGL2 double-transgenic mice developed lung adenocarcinoma, and the PLAGL2 expression level was elevated in human lung tumors [19]. Furthermore, Martin et al. demonstrated in a study of 42 primary CRC tumors and 37 CRC cell lines that PLAGL2 may be an oncogene relevant to CRC pathogenesis [20]. PLAGL2 expression has also exhibited oncogenic characteristics in functional studies of colorectal cancer cases [18]. Although many previous studies have focused on the expression or mechanisms of PLAGL2 in cancer progression, the role of PLAGL2 in the development, progression and prognosis of gastrointestinal cancer remains unclear. Therefore, the goal of this study was to investigate the expression of PLAGL2 in a large number of gastrointestinal cases and to analyze the relationship between PLAGL2 and the clinical characteristics of patients with a primary focus on prognosis.
Materials and methods
Patients and tissue samples
A total of 511 formalin-fixed and paraffin-embedded gastrointestinal tumor samples and 123 corresponding normal samples were obtained for this study. All of the cancer patients underwent gastrointestinal cancer resection with standard lymph node dissection at the Department of Surgical Oncology, First Hospital of China Medical University between 1998 and 2004. None of the patients had received chemotherapy or radiotherapy before the surgical procedure. We received written informed consent from all patients, and the study was approved by the ethics committee of the China Medical University. The detailed postoperative pathological diagnosis reports were gained and included age, gender, tumor location, size, differentiation status, growth pattern, invasion depth, lymph node metastasis, lymphatic invasion and TNM stage. We used the TNM classification system for gastrointestinal carcinoma from the 7th American Joint Committee on Cancer/International Union Against Cancer (AJCC/UICC) staging manual [21]. The criteria for tumor growth patterns in gastric cancers were from the Japanese classification of gastric carcinoma, 3rd English edition [22]. Our experimental cohort contained 225 colorectal cancer patients and 286 gastric cancer patients. The characteristics of all patients are summarized in Tables 1 and 2. All patients were followed up via telephone inquiry or questionnaires, and the follow-up time ranged from 2 to 71 months (median 47 months) for the colorectal cases and from 1 to 149 months (median 62 months) for the 286 gastric cases.
Table 1.
Clinicopathological characteristics of 225 colorectal cancer patients
| Variable | n |
|---|---|
| Age at surgery (years) | |
| Mean | 63 |
| Range | 32-88 |
| Gender | |
| Male | 126 |
| Female | 99 |
| Tumor size (cm) | |
| Mean | 5.5 |
| Range | 1.0-16.0 |
| Tumor location | |
| Rectum | 136 |
| Colon | 89 |
| Differentiation status | |
| Well | 123 |
| Moderately | 45 |
| Poorly | 57 |
| T stage | |
| T1/T2 | 70 |
| T3/T4 | 155 |
| Lymph node metastasis | |
| Negative | 138 |
| Positive | 87 |
| M stage | |
| Negative | 219 |
| Positive | 6 |
| Lymphatic invasion | |
| Negative | 206 |
| Positive | 19 |
| Tumor stage | |
| I | 58 |
| IIa, IIb, IIc | 79 |
| IIIa, IIIb, IIIc | 82 |
| IVa, IVb | 6 |
| Prognosis | |
| Alive | 155 |
| Dead, all causes† | 70 |
Dead, all causes, included death related to colorectal cancer (149), death unrelated to colorectal cancer (2), and information unavailable (4).
Table 2.
Clinicopathological characteristics of 286 gastric cancer patients
| Variable | n | Variable | n |
|---|---|---|---|
| Age at surgery (years) | T stage | ||
| Mean | 58 | T1 | 25 |
| Range | 26-81 | T2 | 45 |
| Gender | T3 | 154 | |
| Male | 211 | T4 | 62 |
| Female | 75 | Lymph node metastasis | |
| Tumour size (cm) | Negative | 74 | |
| Mean | 5.1 | Positive | 212 |
| Range | 0.5-15.0 | Lymphatic invasion | |
| Tumor location1 | Negative | 208 | |
| Upper | 31 | Positive | 78 |
| Middle | 46 | General classification3 | |
| Lower | 208 | Borrmann 1 | 3 |
| Differentiation status | Borrmann 2 | 31 | |
| Well differentiation | 29 | Borrmann 3 | 202 |
| Moderately differentiation | 41 | Borrmann 4 | 24 |
| Poorly differentiation | 208 | Tumor stage | |
| Undifferentiation | 8 | I/II | 97 |
| Growth pattern2 | III/IV | 189 | |
| Expanding | 67 | Prognosis | |
| Intermediate | 90 | Alive | 141 |
| Infiltrative | 122 | Dead, all causes† | 145 |
one case didn’t report the tumor location.
seven cases didn’t report the growth pattern.
Twenty-sixe patients were diagnosed with early gastric cancer.
Dead, all causes, included death related to gastric cancer (120), death unrelated to gastric cancer (12), and information unavailable (13).
Immunohistochemistry
Four-μm-thick sections cut from formalin-fixed, paraffin-embedded tissue blocks were deparaffinized with xylene and rehydrated using a graduated ethanol series. The tissue sections were incubated with 0.3% hydrogen peroxide (H2O2) solution for 12 min to block endogenous peroxidase activity. The sections were incubated in boiling citric-acid buffer (pH 6.0) for antigen retrieval in a steam pressure cooker. Then samples were incubated in goat serum at room temperature for 30 min. After blocking for non-specific antibody binding, the sections were separately incubated overnight at 4°C with an anti-PLAGL2 polyclonal antibody at a 1:200 dilution (ab121239, Abcam, Cambridge, USA). The secondary and tertiary antibodies were added sequentially at room temperature and incubated for 15 min each. Immunohistochemical staining was conducted using a Histostain-Plus kit (Zymed Laboratories Inc., San Francisco, CA, USA) with diaminobenzidine (DAB) as the chromogen. Sections were then counterstained with hematoxylin. Negative control staining was performed by substituting non-immune rabbit serum and phosphate buffered saline for the primary antibodies.
Evaluation of immunohistochemical staining results
Two pathologists who were blinded to patient outcomes independently interpreted the immunostaining results using a semi-quantitative scoring system. Immunostaining reactions were evaluated by staining intensity (0, no staining; 1, weak straining; 2, moderate straining; and 3, strong straining) and the percentage of stained cells (0, ≤5%; 1, 5-25%; 2, 25-50%; 3, 50-75%; and 4, ≥75%). Then, the percentage of positive cells and the staining intensity were multiplied to generate the immunoreactivity score (IS) for each case [23]. If there were discrepancies in the IS as determined by the two pathologists, specimens were rescored until a consensus was reached. All cases were summarized into two groups according to the IS. In the evaluation of PLAGL2, high expression was defined as detectable immunoreactivity in the nucleus and an IS ≥2 as determined by an ROC curve.
Statistics
PLAGL2 expression and clinicopathological parameters were investigated using the appropriate non-parametric tests (Chi-squared test, paired samples t-test and Spearman’s correlation test). Univariate survival analysis was performed using the Kaplan-Meier method, and differences between the groups were analyzed using the log-rank test. The multivariate Cox regression model of backward stepwise method was used to detect the independent predictors of survival. Two-tailed P values less than 0.05 were considered statistically significant. All statistical analyses were performed using SPSS software (version 19.0; SPSS for Windows, Chicago, IL, USA).
Results
Expression of PLAGL2 in gastrointestinal cancers
As is shown in Figures 1 and 2, PLAGL2 expression was predominantly nuclear with some expression also appearing in the cytoplasm in both cancer and normal tissue. The level of PLAGL2 expression in colorectal cancers was significantly higher than in adjacent non-tumor tissue (IS, 8.83 ± 3.824 versus 6.42 ± 4.445, respectively, P = 0.037). Furthermore, among the 66 paired colorectal samples, PLAGL2 expression was significantly higher in tumors than in adjacent non-tumor tissues (IS, 9.08 ± 3.718 versus 6.42 ± 4.445, P<0.001) (Table 3). In gastric cancer cases, PLAGL2 expression was not significantly difference between the gastric cancers and the adjacent non-tumor tissues (IS, 7.88 ± 3.921 versus 6.70 ± 4.183, respectively, P = 0.352). Moreover, there was no difference in the 57 paired gastric samples (IS, 7.95 ± 4.385 versus 6.70 ± 4.183, P = 0.150) (Table 3). In our experiments, 93.8% (211/225) of colorectal cancer cases showed high PLAGL2 expression and 92.9% (263/283) of gastric cancer cases displayed high expression.
Figure 1.
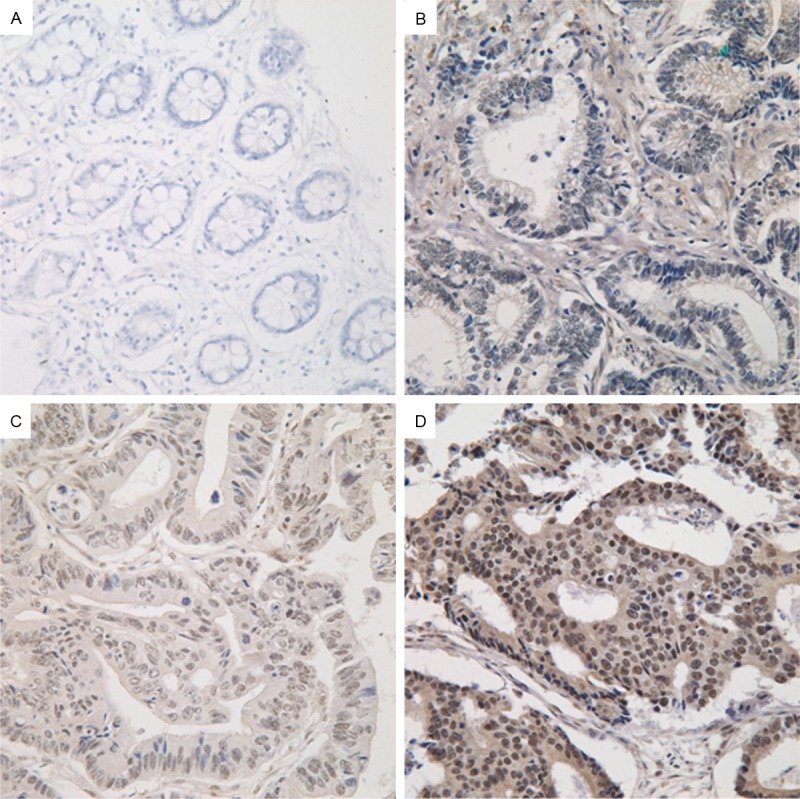
Immunohistochemical staining for PLAGL2 in colorectal cancer tissue and non-tumor adjacent tissue. A. Non-tumor adjacent tissue (no stain). B. Colorectal cancer tissue (weak). C. Colorectal cancer tissue (moderate). D. Colorectal cancer tissue (strong). Magnification ×400
Figure 2.
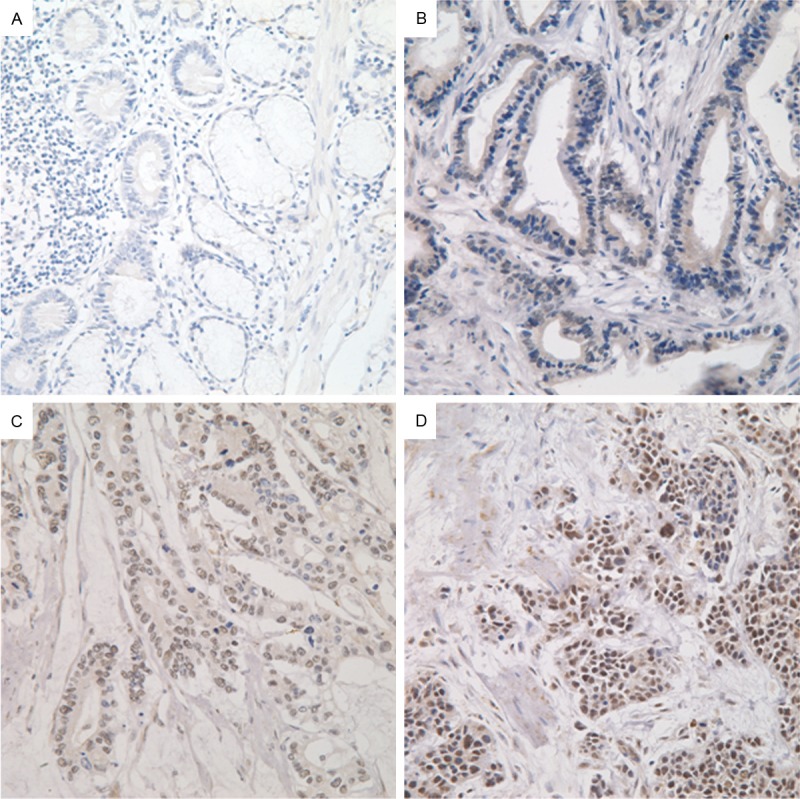
Immunohistochemical staining for PLAGL2 in gastric cancer tissue and non-tumor adjacent tissue. A. Non-tumor adjacent tissue (no stain). B. Gastric cancer tissue (weak). C. Gastric cancer tissue (moderate). D. Gastric cancer tissue (strong). Magnification ×400.
Table 3.
Normal-cancer paired sample comparisons (t-test)
| Variables | No. | IS Mean ± SD | P-value |
|---|---|---|---|
| PLAGL2 in colorectal samples | |||
| Normal | 66 | 6.42 ± 4.445 | <0.001* |
| Cancer | 66 | 9.08 ± 3.718 | |
| PLAGL2 in gastric samples | |||
| Normal | 57 | 6.70 ± 4.183 | 0.150 |
| Cancer | 57 | 7.95 ± 4.385 |
Indicated statistical significance (P<0.05).
Correlation between PLAGL2 expression and clinicopathological characteristics of gastrointestinal cancers and survival analysis
We utilized chi-squared analysis to evaluate the relationship between PLAGL2 expression and various clinicopathological parameters in colorectal and gastric cancers. In the colorectal cancer cases, the PLAGL2 expression level was significantly correlated with the depth of tumor invasion (pT stage, P = 0.030) (Table 4). However, our findings revealed no significant correlation between PLAGL2 expression and tumor size, location, histological type, lymph node metastasis, lymphatic invasion, M stage or tumor stage (Table 4). In the gastric cancer cases, the PLAGL2 expression level significantly correlated with the tumor size (P = 0.046) (Table 5), and there was no significant correlation between PLAGL2 expression and tumor location, histological grade, growth pattern, T stage, N stage, lymphatic invasion, general classification or tumor stage (Table 5).
Table 4.
Statistical results of relationships between PLAGL2 expression and various clinicopathologic characteristics in colorectal cancer
| Variables | Total | Low (%) | High (%) | P-value |
|---|---|---|---|---|
|
|
||||
| 225 | 14 | 211 | ||
| Age at surgery (years) | ||||
| ≤60 | 79 | 5 | 74 | 0.961 |
| >60 | 146 | 9 | 137 | |
| Gender | ||||
| Male | 126 | 10 | 116 | 0.230 |
| Female | 99 | 4 | 95 | |
| Pathophysiologic features | ||||
| Tumor size (cm) | ||||
| ≤5 | 116 | 8 | 108 | 0.666 |
| >5 | 109 | 6 | 103 | |
| Tumor location | ||||
| Rectum | 136 | 9 | 127 | 0.761 |
| Colon | 89 | 5 | 84 | |
| Histological type | ||||
| WD/MD | 168 | 12 | 156 | 0.326 |
| PD | 57 | 2 | 55 | |
| T stage | ||||
| T1/2 | 70 | 8 | 62 | 0.030* |
| T3/4 | 155 | 6 | 149 | |
| Lymph node metastasis | ||||
| Negative | 138 | 7 | 131 | 0.369 |
| Positive | 87 | 7 | 80 | |
| M stage | ||||
| M0 | 219 | 14 | 205 | 0.552 |
| M1 | 6 | 0 | 6 | |
| Lymphatic invasion | ||||
| Negative | 206 | 13 | 193 | 0.856 |
| Positive | 19 | 1 | 18 | |
| Tumor stage | ||||
| I | 58 | 5 | 53 | 0.312 |
| IIa, IIb, IIc | 79 | 2 | 77 | |
| IIIa, IIIb, IIIc | 82 | 7 | 75 | |
| IVa, IVb | 6 | 0 | 6 | |
Indicated statistical significance (P<0.05).
Table 5.
Statistical results of relationships between PLAGL2 expression and various clinicopathologic characteristics in gastric cancer
| Variables | Total | Low (%) | High (%) | P-value |
|---|---|---|---|---|
|
|
||||
| 286 | 23 | 263 | ||
| Age at surgery (years) | ||||
| ≤60 | 157 | 9 | 148 | 0.113 |
| >60 | 129 | 14 | 115 | |
| Gender | ||||
| Male | 211 | 20 | 191 | 0.134 |
| Female | 75 | 3 | 72 | |
| Pathophysiologic features | ||||
| Tumor size (cm) | ||||
| ≤5 | 168 | 9 | 159 | 0.046* |
| >5 | 118 | 14 | 104 | |
| Tumor location1 | ||||
| Upper | 31 | 5 | 26 | 0.087 |
| Middle | 46 | 1 | 45 | |
| Lower | 208 | 17 | 191 | |
| Histological grade | ||||
| Well differentiation | 29 | 2 | 27 | 0.293 |
| Moderate differentiation | 41 | 2 | 39 | |
| Poor differentiation | 208 | 17 | 191 | |
| Undifferentiation | 8 | 2 | 6 | |
| Growth pattern2 | ||||
| Expanding | 67 | 4 | 63 | 0.317 |
| Intermediate | 90 | 5 | 85 | |
| infiltrative | 122 | 13 | 109 | |
| T stage | ||||
| T1 | 25 | 0 | 25 | 0.119 |
| T2 | 45 | 5 | 40 | |
| T3 | 154 | 16 | 138 | |
| T4 | 62 | 2 | 60 | |
| N stage | ||||
| N0 | 74 | 4 | 70 | 0.243 |
| N1 | 36 | 4 | 32 | |
| N2 | 71 | 3 | 68 | |
| N3 | 105 | 12 | 93 | |
| M stage | ||||
| Negative | 203 | 14 | 189 | 0.265 |
| Positive | 83 | 9 | 74 | |
| Lymphatic invasion | ||||
| Negative | 208 | 19 | 189 | 0.267 |
| Positive | 78 | 4 | 74 | |
| General classification3 | ||||
| Borrmann 1 | 3 | 1 | 2 | 0.137 |
| Borrmann 2 | 31 | 0 | 31 | |
| Borrmann 3 | 202 | 20 | 182 | |
| Borrmann 4 | 24 | 2 | 22 | |
| Tumor stage | ||||
| I/II | 97 | 6 | 91 | 0.408 |
| III/IV | 189 | 17 | 172 | |
one case didn’t report the tumor location.
seven cases didn’t report the growth pattern.
Twenty-sixe patients were diagnosed with early gastric cancer.
Indicated statistical significance (P<0.05).
According to univariate survival analysis, T stage (P<0.001), lymph node metastasis (P<0.001), M stage (P<0.001), lymphatic invasion (P<0.001), and tumor stage (P<0.001) were all significant prognostic factors (Table 6) for colorectal cancer. According to Cox multivariate analysis, lymphatic invasion (P = 0.005) and tumor stage (P = 0.008) remained significant prognostic factors (Table 6). In survival analysis, higher PLAGL2 expression was not a prognostic factor (P = 0.475) (Figure 3A). In gastric cancers, tumor size (P<0.001), T stage (P<0.001), N stage (P<0.001), M stage (P<0.001), lymphatic invasion (P = 0.001), general classification (P<0.001), and tumor stage (P<0.001) were all significant prognostic factors, according to univariate survival analysis (Table 7). According to Cox multivariate analysis, T stage (P = 0.002), N stage (P<0.001), and M stage (P = 0.039) remained significant prognostic factors (Table 7). In survival analysis, higher PLAGL2 expression was still not prognostic for gastric cancers (P = 0.137) (Figure 3B).
Table 6.
Survival analysis in colorectal cancer
| Univariate | Multivariate | |||||
|---|---|---|---|---|---|---|
|
|
||||||
| Variable | Total (%) | 5 years (%) | P-value | RR | 95% CI | P-value |
| Age at surgery (years) | ||||||
| ≤60 | 79 | 68.7 | 0.413 | |||
| >60 | 146 | 70.4 | ||||
| Gender | ||||||
| Male | 126 | 73.2 | 0.470 | |||
| Female | 99 | 68.1 | ||||
| Pathophysiologic features | ||||||
| Tumor size (cm) | ||||||
| ≤5 | 116 | 70.0 | 0.749 | |||
| >5 | 109 | 70.8 | ||||
| Tumor location | ||||||
| Rectum | 136 | 74.8 | 0.438 | |||
| Colon | 89 | 68.3 | ||||
| Histological grade | ||||||
| WD/MD | 168 | 75.5 | 0.270 | |||
| PD | 57 | 62.8 | ||||
| T stage | ||||||
| T1/2 | 70 | 82.5 | <0.001* | 0.659 | 0.286-1.519 | 0.328 |
| T3/4 | 155 | 65.7 | ||||
| Lymph node metastasis | ||||||
| Negative | 138 | 89.9 | <0.001* | 4.738 | 0.501-44.789 | 0.175 |
| Positive | 87 | 39.7 | ||||
| M stage | ||||||
| M0 | 219 | 75.3 | <0.001* | 0.484 | 0.171-1.366 | 0.171 |
| M1 | 6 | 16.7 | ||||
| Lymphatic invasion | ||||||
| Negative | 206 | 76.2 | <0.001* | 0.377 | 0.192-0.740 | 0.005* |
| Positive | 19 | 31.6 | ||||
| Tumor stage | ||||||
| I | 58 | 92.1 | <0.001* | 0.042 | 0.004-0.436 | 0.008* |
| IIa, IIb, IIc | 79 | 80.9 | ||||
| IIIa, IIIb, IIIc | 82 | 40.9 | ||||
| IVa, IVb | 6 | 16.7 | ||||
| PLAGL2 expression | ||||||
| Low | 14 | 76.2 | 0.475 | |||
| High | 211 | 73.4 | ||||
Indicated statistical significance (P<0.05).
Figure 3.
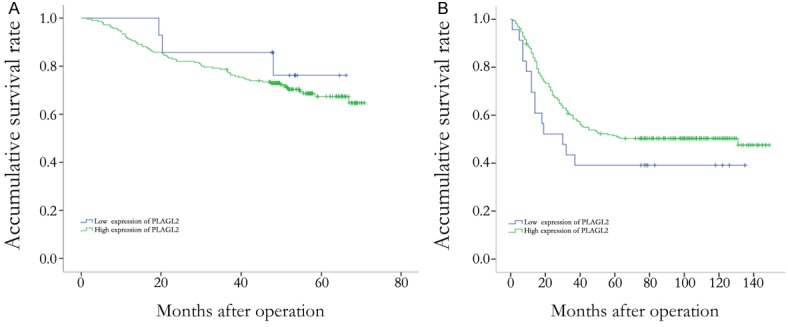
Survival analysis in patients with colorectal cancer and gastric cancer. A. PLAGL2 expression was no associated with overall survival in colorectal cancer patients. B. PLAGL2 expression was no associated with overall survival in gastric cancer patients.
Table 7.
Survival analysis in gastric cancer
| Univariate | Multivariate | |||||
|---|---|---|---|---|---|---|
|
|
||||||
| Variable | Total (%) | 5 years (%) | P-value | RR | 95% CI | P-value |
| Age at surgery (years) | ||||||
| ≤60 | 157 | 61.8 | 0.428 | |||
| >60 | 129 | 54.8 | ||||
| Gender | ||||||
| Male | 211 | 72.4 | 0.612 | |||
| Female | 75 | 46.7 | ||||
| Pathophysiologic features | ||||||
| Tumor size (cm) | ||||||
| ≤5 | 168 | 64.8 | <0.001* | 0.983 | 0.691-1.400 | 0.925 |
| >5 | 118 | 49.7 | ||||
| Tumor location1 | ||||||
| Upper | 31 | 33.5 | 0.134 | |||
| Middle | 46 | 43.5 | ||||
| Lower | 208 | 71.2 | ||||
| Histological grade | ||||||
| Well/Moderate differentiation | 70 | 49.3 | 0.634 | |||
| Poor differentiation | 216 | 73.1 | ||||
| Growth pattern2 | ||||||
| Expanding | 67 | 58.2 | 0.287 | |||
| Intermediate | 90 | 48.9 | ||||
| infiltrative | 122 | 51.3 | ||||
| T stage | ||||||
| T1 | 25 | 70.0 | <0.001* | 0.555 | 0.380-0.811 | 0.002* |
| T2 | 45 | 77.8 | ||||
| T3 | 154 | 61.5 | ||||
| T4 | 62 | 21.0 | ||||
| N stage | ||||||
| N0 | 74 | 85.1 | <0.001* | 0.449 | 0.301-0.671 | <0.001* |
| N1 | 36 | 71.2 | ||||
| N2 | 71 | 46.5 | ||||
| N3a/3b | 105 | 42.9 | ||||
| M stage | ||||||
| Negative | 203 | 71.8 | <0.001* | 0.667 | 0.453-0.981 | 0.039* |
| Positive | 83 | 32.4 | ||||
| Lymphatic invasion | ||||||
| Negative | 208 | 71.5 | 0.001* | 0.798 | 0.556-1.145 | 0.221 |
| Positive | 78 | 35.9 | ||||
| General classification3 | ||||||
| Borrmann 1 | 3 | 66.7 | <0.001* | 0.654 | 0.393-1.089 | 0.102 |
| Borrmann 2 | 31 | 70.8 | ||||
| Borrmann 3 | 202 | 70.7 | ||||
| Borrmann 4 | 24 | 20.8 | ||||
| Tumor stage | ||||||
| I/II | 97 | 88.5 | <0.001* | 0.456 | 0.182-1.143 | 0.094 |
| III/IV | 189 | 69.8 | ||||
| PLAGL2 expression | ||||||
| Low | 23 | 39.1 | 0.137 | |||
| High | 263 | 77.5 | ||||
one case didn’t report the tumor location.
seven cases didn’t report the growth pattern.
Twenty-sixe patients were diagnosed with early gastric cancer.
Indicated statistical significance (P<0.05).
Discussion
In this study, we used immunohistochemistry to investigate the expression of PLAGL2 in 511 gastrointestinal cancer patients. According to previous studies and the manufacturer’s instructions, PLAGL2 immunostaining was predominantly nuclear, and we also found that PLAGL2 was expressed in the cytoplasm. This pattern of expression may be caused by the use of polyclonal antibodies. Goldenberg et al. used immunohistochemistry to demonstrate that there was no PLAGL2 expression in human colon cancer [24]. Conversely, we found substantial PLAGL2 expression in human gastrointestinal tissues, including tumor and normal tissues. The level of PLAGL2 expression may be different in different cancers, however. In recent studies, aberrant PLAGL2 expression has been observed in acute myeloid leukemia (AML), glioblastomas (GBM), and lung adenocarcinoma [17,18,24-27]. In the present study, PLAGL2 expression in colorectal cancers was significantly higher than in adjacent non-tumor tissues. However, there was no significant difference between the expression of PLAGL2 in gastric cancers and adjacent non-tumor tissues. Also, we found that higher expression levels of PLAGL2 significantly correlated with the depth of tumor invasion. This result was consistent with the observation that high PLAGL2 expression in GBM promoted glioma cell invasion [18,24]. Although PLAGL2 could inhibit cell differentiation in GBM, we found that the expression of PLAGL2 did not correlate with the degree of differentiation. Thus far, there has been no reported research concerning that the role that PLAGL2 plays in gastric tissues. In this study, we demonstrated that PLAGL2 expression was widespread in the gastric tissues, and elevated expression of PLAGL2 significantly correlated with tumor size in gastric cancers. Moreover, we believe that PLAGL2 expression is likely to be influenced by tissue specificity, the patient population and environment, and sample size. These issues need to be resolved by larger multicenter studies in the future.
To date, few studies have evaluated the relationship between PLAGL2 and prognosis in cancer. Recently, Yang et al. have reported that female patients with low PLAGL2 expression at an early stage of disease had better prognosis for survival from lung adenocarcinoma, while no correlation was observed for male patients [19]. In our present study of gastrointestinal cancer, PLAGL2 expression was not a prognostic factor in survival analysis.
Currently, the mechanism of action for PLAGL2 in gastrointestinal tissues, and especially in colorectal cancers, remains unknown. In the NIH3T3 cells, Hensen et al. have suggested that PLAGL2’s oncogenic capacity is mediated by the activation of the insulin-like growth factor-II (IGF-II) mitogenic pathway via IGF-I-R, which activates the Ras/Raf mitogen-activated protein kinase pathway and restarts the developmental program with a loss of differentiation [12,15]. Moreover, PLAGL2 increased proliferation by promoting the G1 to S transition and increasing cell renewal in a manner that induces acute myeloid leukemia in cooperation with Cbfb-MYH11 [17]. In recent studies of glioblastoma, PLAGL2 expression suppressed cellular differentiation and promoted cellular capacity for self-renewal by activating the Wnt/β-catenin pathway and cell-to-cell fusion that permits the transfer of genetic information between tumor and stromal cells [18,24,27]. Another study has reported that PLAGL2 might program cell growth and contribute to the development of lung adenocarcinoma by modifying the bNip3 gene [19]. In addition, PLAGL2 regulation of the activation of p53 and its family members may represent another mechanism of cellular activation [13,28]. On the one hand, PLAGL2 serves as an oncoprotein through interactions with Pirh2 dimers that stabilize Pirh2 by inhibiting proteasome-mediated Pirh2 degradation and promoting the degradation of p53 in HKE293 cells [13]. On the other hand, PLAGL2 serves as a tumor suppressor by inducing cell-cycle block and apoptosis via the regulation of p73, a p53 family member in human promonocytic U937 cells [28]. Clearly, the mechanism of PLAGL2 action in colorectal cancers is complex and requires further study.
Although we didn’t find any differences in PLAGL2 expression between gastric cancers and adjacent non-tumor tissue, we did observe expression in gastric tissues in our study. In previous studies, PLAGL2 has been identified as an oxidative stress-responsive regulator that activates the SP-C promoter during lung development under hypoxia [7,16,29]. Yang et al. found that PLAGL2 expression significant resulted in functional and structural defects in the respiratory system by mediating airway epithelial cell injury and apoptosis [7]. These issues prompted us to determine the role of PLAGL2 in gastric tissues.
In addition, the activity of PLAGL2 protein requires various modulatory factors. In the mouse macrophage cell line RAW264.7, PLAGL2 was induced when cells were incubated under hypoxic conditions or with desferrioxamine [8]. Zheng et al. found that sumoylation and acetylation played opposite roles in the transactivation of PLAGL2 at the same lysine residues [6]. They showed that the transcriptional activity of PLAGL2 was negatively regulated by sumoylation. They also revealed that PLAGL2 was acetylated and activated by p300 and Tip60, and deacetylated and repressed by HDAC7 [6,9]. Furthermore, PC2, a component of the ARC/Mediator complex, modulated the transactivation of PLAGL2 by binding to its C-terminus [4].
In conclusion, we studied expression of PLAGL2 in gastrointestinal carcinoma and found that PLAGL2 expression in the gastric and colorectal cancer tissues was significantly higher than in adjacent non-tumor tissues. Also, elevated PLAGL2 expression was associated with the depth of tumor invasion in colorectal cancer tissues, but the mechanism of PLAGL2 in gastrointestinal is still unknown. Our findings suggest that PLAGL2 should be evaluated as a novel preoperative biomarker to assist in the evaluation of tumor invasion and guide treatment in colorectal cancer.
Acknowledgements
We thank the department of Surgical Oncology of First Hospital of China Medical University for providing human gastrointestinal tissue samples. We also thank the College of China Medical University for technical assistance in experiments. This work was supported by National Science Foundation of China (No. 81201888, 81372549 and No. 81172370), Specialized Research Fund for the Doctoral Program of Higher Education (No. 20122104110009) and the Project of Science and Technology of Shenyang (F12-193-9-08)
Disclosure of conflict of interest
None.
References
- 1.Jemal A, Bray F, Center MM, Ferlay J, Ward E, Forman D. Global cancer statistics. CA Cancer J Clin. 2011;61:69–90. doi: 10.3322/caac.20107. [DOI] [PubMed] [Google Scholar]
- 2.Are C, Rajaram S, Are M, Raj H, Anderson BO, Chaluvarya Swamy R, Vijayakumar M, Song T, Pandey M, Edney JA, Cazap EL. A review of global cancer burden: Trends, challenges, strategies, and a role for surgeons. J Surg Oncol. 2013;107:221–226. doi: 10.1002/jso.23248. [DOI] [PubMed] [Google Scholar]
- 3.Al-Hajj M, Clarke MF. Self-renewal and solid tumor stem cells. Oncogene. 2004;23:7274–7282. doi: 10.1038/sj.onc.1207947. [DOI] [PubMed] [Google Scholar]
- 4.Wezensky SJ, Hanks TS, Wilkison MJ, Ammons MC, Siemsen DW, Gauss KA. Modulation of plagl2 transactivation by positive cofactor 2 (pc2), a component of the arc/mediator complex. Gene. 2010;452:22–34. doi: 10.1016/j.gene.2009.12.003. [DOI] [PMC free article] [PubMed] [Google Scholar]
- 5.Abdollahi A. Lot1 (zac1/plagl1) and its family members: Mechanisms and functions. J Cell Physiol. 2007;210:16–25. doi: 10.1002/jcp.20835. [DOI] [PubMed] [Google Scholar]
- 6.Zheng G, Yang YC. Sumoylation and acetylation play opposite roles in the transactivation of plag1 and plagl2. J Biol Chem. 2005;280:40773–40781. doi: 10.1074/jbc.M504334200. [DOI] [PubMed] [Google Scholar]
- 7.Yang YS, Yang MC, Guo Y, Williams OW, Weissler JC. Plagl2 expression-induced lung epithelium damages at bronchiolar alveolar duct junction in emphysema: Bnip3- and sp-c-associated cell death/injury activity. Am J Physiol Lung Cell Mol Physiol. 2009;297:L455–466. doi: 10.1152/ajplung.00144.2009. [DOI] [PMC free article] [PubMed] [Google Scholar]
- 8.Furukawa T, Adachi Y, Fujisawa J, Kambe T, Yamaguchi-Iwai Y, Sasaki R, Kuwahara J, Ikehara S, Tokunaga R, Taketani S. Involvement of plagl2 in activation of iron deficient- and hypoxia- induced gene expression in mouse cell lines. Oncogene. 2001;20:4718–4727. doi: 10.1038/sj.onc.1204647. [DOI] [PubMed] [Google Scholar]
- 9.Ning J, Zheng G, Yang YC. Tip60 modulates plagl2-mediated transactivation by acetylation. J Cell Biochem. 2008;103:730–739. doi: 10.1002/jcb.21444. [DOI] [PubMed] [Google Scholar]
- 10.Ammons MC, Siemsen DW, Nelson-Overton LK, Quinn MT, Gauss KA. Binding of pleomorphic adenoma gene-like 2 to the tumor necrosis factor (tnf)-alpha-responsive region of the ncf2 promoter regulates p67(phox) expression and nadph oxidase activity. J Biol Chem. 2007;282:17941–17952. doi: 10.1074/jbc.M610618200. [DOI] [PubMed] [Google Scholar]
- 11.Kas K, Voz ML, Hensen K, Meyen E, Van de Ven WJ. Transcriptional activation capacity of the novel plag family of zinc finger proteins. J Biol Chem. 1998;273:23026–23032. doi: 10.1074/jbc.273.36.23026. [DOI] [PubMed] [Google Scholar]
- 12.Hensen K, Van Valckenborgh IC, Kas K, Van de Ven WJ, Voz ML. The tumorigenic diversity of the three plag family members is associated with different DNA binding capacities. Cancer Res. 2002;62:1510–1517. [PubMed] [Google Scholar]
- 13.Zheng G, Ning J, Yang YC. Plagl2 controls the stability of pirh2, an e3 ubiquitin ligase for p53. Biochem Biophys Res Commun. 2007;364:344–350. doi: 10.1016/j.bbrc.2007.10.003. [DOI] [PMC free article] [PubMed] [Google Scholar]
- 14.Astrom AK, Voz ML, Kas K, Roijer E, Wedell B, Mandahl N, Van de Ven W, Mark J, Stenman G. Conserved mechanism of plag1 activation in salivary gland tumors with and without chromosome 8q12 abnormalities: Identification of sii as a new fusion partner gene. Cancer Res. 1999;59:918–923. [PubMed] [Google Scholar]
- 15.Van Dyck F, Declercq J, Braem CV, Van de Ven WJ. Plag1, the prototype of the plag gene family: Versatility in tumour development (review) Int J Oncol. 2007;30:765–774. [PubMed] [Google Scholar]
- 16.Yang MC, Weissler JC, Terada LS, Deng F, Yang YS. Pleiomorphic adenoma gene-like-2, a zinc finger protein, transactivates the surfactant protein-c promoter. Am J Respir Cell Mol Biol. 2005;32:35–43. doi: 10.1165/rcmb.2003-0422OC. [DOI] [PubMed] [Google Scholar]
- 17.Landrette SF, Kuo YH, Hensen K, Barjesteh van Waalwijk van Doorn-Khosrovani S, Perrat PN, Van de Ven WJ, Delwel R, Castilla LH. Plag1 and plagl2 are oncogenes that induce acute myeloid leukemia in cooperation with cbfb-myh11. Blood. 2005;105:2900–2907. doi: 10.1182/blood-2004-09-3630. [DOI] [PubMed] [Google Scholar]
- 18.Zheng H, Ying H, Wiedemeyer R, Yan H, Quayle SN, Ivanova EV, Paik JH, Zhang H, Xiao Y, Perry SR, Hu J, Vinjamoori A, Gan B, Sahin E, Chheda MG, Brennan C, Wang YA, Hahn WC, Chin L, DePinho RA. Plagl2 regulates wnt signaling to impede differentiation in neural stem cells and gliomas. Cancer cell. 2010;17:497–509. doi: 10.1016/j.ccr.2010.03.020. [DOI] [PMC free article] [PubMed] [Google Scholar]
- 19.Yang YS, Yang MC, Weissler JC. Pleiomorphic adenoma gene-like 2 expression is associated with the development of lung adenocarcinoma and emphysema. Lung cancer. 2011;74:12–24. doi: 10.1016/j.lungcan.2011.02.006. [DOI] [PMC free article] [PubMed] [Google Scholar]
- 20.Martin ES, Tonon G, Sinha R, Xiao Y, Feng B, Kimmelman AC, Protopopov A, Ivanova E, Brennan C, Montgomery K, Kucherlapati R, Bailey G, Redston M, Chin L, DePinho RA. Common and distinct genomic events in sporadic colorectal cancer and diverse cancer types. Cancer Res. 2007;67:10736–10743. doi: 10.1158/0008-5472.CAN-07-2742. [DOI] [PubMed] [Google Scholar]
- 21.Edge S, Byrd D, Compton C. AJCC cancer staging manual, 7th ed. JAMA. 2010;304:1726–1727. [Google Scholar]
- 22.Japanese Gastric Cancer Association. Japanese classification of gastric carcinoma: 3rd English edition. Gastric Cancer. 2011;14:101–112. doi: 10.1007/s10120-011-0041-5. [DOI] [PubMed] [Google Scholar]
- 23.Agarwal R, D’Souza T, Morin PJ. Claudin-3 and claudin-4 expression in ovarian epithelial cells enhances invasion and is associated with increased matrix metalloproteinase-2 activity. Cancer Res. 2005;65:7378–7385. doi: 10.1158/0008-5472.CAN-05-1036. [DOI] [PubMed] [Google Scholar]
- 24.Goldenberg DM, Zagzag D, Heselmeyer-Haddad KM, Berroa Garcia LY, Ried T, Loo M, Chang CH, Gold DV. Horizontal transmission and retention of malignancy, as well as functional human genes, after spontaneous fusion of human glioblastoma and hamster host cells in vivo. Int J Cancer. 2012;131:49–58. doi: 10.1002/ijc.26327. [DOI] [PMC free article] [PubMed] [Google Scholar]
- 25.Mackinnon RN, Selan C, Wall M, Baker E, Nandurkar H, Campbell LJ. The paradox of 20q11.21 amplification in a subset of cases of myeloid malignancy with chromosome 20 deletion. Genes Chromosomes Cancer. 2010;49:998–1013. doi: 10.1002/gcc.20806. [DOI] [PubMed] [Google Scholar]
- 26.Landrette SF, Madera D, He F, Castilla LH. The transcription factor plagl2 activates mpl transcription and signaling in hematopoietic progenitor and leukemia cells. Leukemia. 2011;25:655–662. doi: 10.1038/leu.2010.301. [DOI] [PMC free article] [PubMed] [Google Scholar]
- 27.Kornblum HI. A multipronged approach to the identification and study of an important oncogene in gbm. Cancer Cell. 2010;17:417–418. doi: 10.1016/j.ccr.2010.04.019. [DOI] [PubMed] [Google Scholar]
- 28.Hanks TS, Gauss KA. Pleomorphic adenoma gene-like 2 regulates expression of the p53 family member, p73, and induces cell cycle block and apoptosis in human promonocytic u937 cells. Apoptosis. 2012;17:236–247. doi: 10.1007/s10495-011-0672-3. [DOI] [PubMed] [Google Scholar]
- 29.Guo Y, Yang MC, Weissler JC Yang YS. Plagl2 translocation and sp-c promoter activity--a cellular response of lung cells to hypoxia. Biochem Biophys Res Commun. 2007;360:659–665. doi: 10.1016/j.bbrc.2007.06.106. [DOI] [PMC free article] [PubMed] [Google Scholar]