

Abstract
Breast cancer is a highly invasive and metastatic disease. Recent studies report that breast cancer cells that have undergo epithelial-to-mesenchymal transition (EMT) obtain malignant characteristic, however, the molecular mechanism underlying this transition are poorly understood. Here, we found that over-expression associated with the process of breast cancer and that high B-cell-specific moloney murine leukemia virus insertion site 1 (Bmi-1) levels predict shorter survival of breast cancer patients. We demonstrate that Bmi-1 regulates EMT and the migration of breast cancer cells. RNA interference-mediated knockdown Bmi-1 expression restored E-cadherin expression and cell-cell junction formation in breast cancer cells, suppressing cell migration and invasion. In contrast, the over-expression of Bmi-1 decreased the expression of the epithelial mark (E-cadherin) but increased the mesenchymal makers (N-cadherin and vimentin) in breast cancer cells.
Keywords: Bmi-1, EMT, breast cancer, migration, invasion
Introduction
Bmi-1 (B-cell-specific moloney murine leukemia virus insertion site 1), a member of the polycomb group transcription repressors, is known to play an important role in carcinogenesis as it was originally identified as an oncogenic partner of c-Myc in murine lymphomagenesis [1-5]. Previous studies demonstrated that Bmi-1 regulates the differentiation and clonogenic self-renewal of I-type neuroblastoma cells [6]. Other studies also have revealed that Bmi-1 is involved in the regulation of stem-cell-associated genes to control cell self-renewing and differentiation [7-9].
EMT is a complex multi-step process that occurs during embryonic development, tumor progression, and tissue fi brosis [10,11]. During EMT, epithelial cells lose many of their epithelial characteristics and adopt a mesenchymal appearance and mesenchymal characteristics, such as increased motility and invasiveness. Dynamic changes in gene expression and cytoskeleton reorganization are often observed during the process of EMT [12,13]. One of the hallmarks of EMT is the suppression of E-cadherin, a transmembrane protein essential for cell-cell junction. The loss of E-cadherin expression not only disrupts cell-cell adhesion but also activates multiple pathways that induce cellular migration, invasion, and metastasis [14].
In this study, we report that siRNA-mediated knockdown Bmi-1 expression induces EMT in breast cancer cells. We show that Bmi-1 increases the expression of the epithelial markers E-cadherin but decreases the expression of mesenchymal markers N-cadherin and vimentin. Bmi-1 depletion also down-regulated the expression of EMT-inducing transcription factors (Snail, Slug, ZEB1 and ZEB2).
Materials and methods
Tissue microarray and immunohistochemistry
Tissue microarrays containing cancer and matched metastatic tissues, HBre-Duc068Bch (68 patients, 100 tumor cores), HBre-Duc040Bch (40 patients, 80 tumor cores) were purchased from Shanghai Outdo Biotech Company. (Shanghai, China). For immunohistochemistry, slides were routinely deparaffinized and rehydrated, and then were subjected to heat-induced epitope retrieval in 0.01 mM citrate buffer (pH 6.0). Endogenous peroxidase activity was blocked for 10 min in 3% hydrogen peroxide and methanol. The slides were then incubated with Bmi-1 rabbit polyclonal antibody (1:200; Cell Signaling Technology) at 4°C overnight. Sections were then stained with DAB (Maixin. Bio, Fuzhou, China) for 5 min. All sections were counterstained with hematoxylin, dehydrated and mounted. Scoring was performed blindly by a pathologist according to the semi-quantitative seven-tier system developed by Allred et al [15]. This system assesses the percentage of positive cells (none = 0, < 10% = 1, 10-50% = 2 and > 50% = 3) and the intensity of staining (none = 0, weak = 1, intermediate = 2 and strong = 3). The intensity and percentage scores are then added to give a fi nal immunoreactivity score ranging from 0 to 6.
Cells, plasmidsand antibodies
MDA-MB-231, T47D and BT474 cell lines were cultured in RPMI-1640 supplemented with 10% FBS and antibiotics. All cells obtained from the cell bank of the Committee on Type Culture Collection of the Chinese Academic of Science (CCTCC, Shanghai, China).
The human Bmi-1 expression vector GV144-Bmi-1 were generated as previously described. T47D and BT474 cell lines were transfected with GV144-Bmi-1 or control plasmid. Then, the growth medium was supplemented with G418 (Beyotime, China), which was used to select for G418-resitant transfectants. E-cadherin, N-cadherin, MMP-2, MMP-9, Bmi-1 and Fibronectin antibodies were purchased from Cell Signaling Technology (Danvers, MA, USA).
siRNA transfection
The sequences of the siRNAs used to suppress Bmi1 expression was:sense, 5’-AUGAAGAGAGAAGGGAUUTT-3’; antisense The control siRNA sequence that targeted GFP was:sense, 5’-UUCUCCGAACGUGUAACGUTT-3’; antisense, 5’-ACGUGACACGUUCGGAGAATT-3’; Cells were transfected with 90 nM of siRNA using Lipofectamine RNAiMAX according to manufacturer’s instructions.
Migration and invasion assay
For transwell migration assays, 1 × 10⁵ cells were seeded in the top chamber with the non-coated membranes (24 well insert, 8.0-mm, BD Bioscience). Cells were seeded in a serum-free medium and then migrated toward complete growth medium. For the invasion assay, cells were serum-starved overnight and 2 × 10⁴ cells were seeded in a Matrigel-coated chamber and cultured for 48 h. The invaded or migrated cells were fixed with 70% methanol and stained 0.5% crystal violet. Cells invaded or migrated the lower surface of filters were counted in five randomly selected fields. All experiments were carried out in triplicate.
Quantitative real-time PCR
Total RNA was extracted from cultured cells using EZNA Total Rna Kit (OMEGA Bio-tek, USA), and cDNA was generated using PrimeScript RT reagent Kit with gDNA Eraser (TaKaRa, Otsu, Japan). Quantitative real-time PCR was performed using the SYBR Premix ExTaq II (TLiRNaseH Plus) (TaKaRa, Otsu, Japan) with a CFX96 Real-Time PCR Detection System (Bio-Rad, Hercules, CA, USA).
Immunoblot analysis
Cells were lysed with RIPA buffer (Beyotime, China) and boiled for 5 minutes. The protein concentration of each lysate was measured using the BCA method (Beyotime, China). Equal quantities of protein from each cell lysate were separated on SDS-polyacrylamide electrophoresis gels and transferred to PVDF membranes (Millipore, Billerica, MA). The membranes were blocked with 5% skim milk, incubated with each primary antibody overnight at 4°C, washed with TBS-T buffer (10 mM Tris-HCl pH 7.4, 150 mM NaCl, 0.05% Tween20) and incubated with secondary antibodies. The proteins were visualized using enhanced chemiluminescence (GE Healthcare Biosciences).
Soft agar assay
1 × 10⁵ cells were mixed with 0.36% agar in RPMI-1640 medium supplemented with 10% FBS and overlaid onto 0.72% agar layer in 6-well plates. After 2 weeks incubation, colonies were counted in five randomly selected fields. All experiments were performed were carried out in triplicate.
Flow cytometry analysis
The cell cycle distribution was detected using flow cytometry (FCM) with propidium iodide staining. In brief, both floating and adherent cells were collected, washed with ice-cold PBS, and then fixed in ice-cold 70% ethanol overnight at 4°C. The fixed cells were treated with RNaseA and stained with propidium iodide for 1 h at room temperature, and finally analyzed by FCM (BD Biosciences).
Statistical analysis
All variables between groups were compared using the Pearson X2-test or Student’s t-test. P < 0.05 was considered statistically significant. Numerical data were calculated using Microsoft Excel and analyzed using SPSS 17.0 (SPSS Inc., Chicago, IL, USA).
Results
Bmi-1 is highly expressed in primary human breast cancer and metastatic breast cancer cells
To further examine special expression to breast cancer progression, we analyzed the relationship of Bmi-1 in tumors and lymph nodes tissues from 108 patients. Each sample was assigned an immunoreactivity score ranging from 0 to 6. Representative samples are shown in Figure 1A along with date analysis (Figure 1B). Primary tumors and corresponding lymph node metastases exhibited diffuse cytoplasmic staining for Bmi-1. Paired comparisons of immunoreactivity scores between primary and metastatic tumors were significant (P < 0.001).
Figure 1.
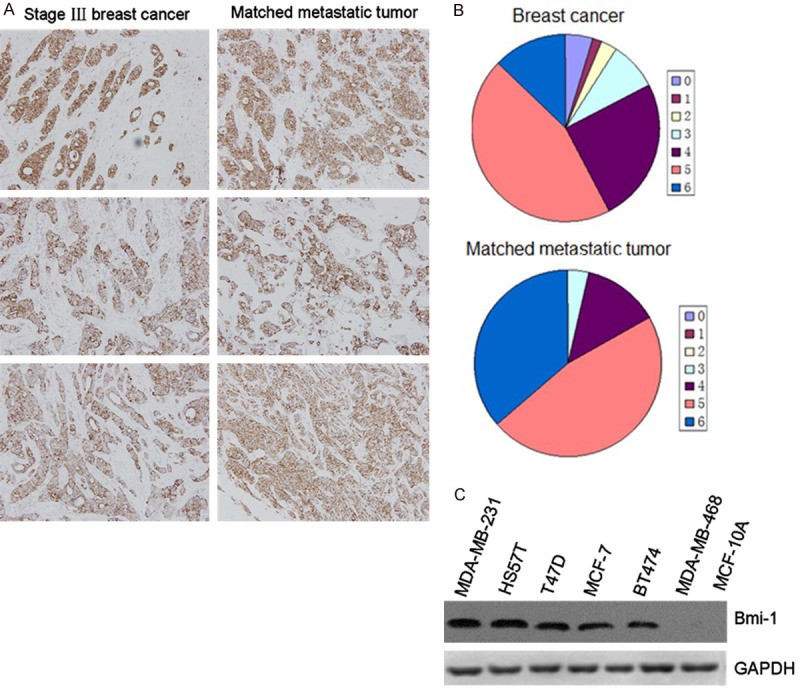
A. Expression levels of Bmi-1 in primary breast cancer and matched lymph node tumors. B. Distribution of immunoreactivity scores in primary breast cancer and matched lymph node tumors (n = 106). P < 0.05 indicate significant differences between two groups. C. Expression of Bmi-1 in breast cancer cell lines. Equal amounts of proteins from seven non-or low metastatic breast cancer cell lines (MDA-MB-468, T47D, BT474, MCF-7, MCF-10A) and two highly metastatic breast cancer cell lines (MDA-MB-231 and HS578T) were examined by immunoblot analysis with antibodies against Bmi-1 and glyceraldehyde 3-phosphate dehydrogenase (GAPDH).
We also investigated the expression of Bmi-1 in a serious of human mammary epithelial cells and tumor cell lines (MDA-MB-468, T47D, BT474, MCF-7, MDA-MB-231, MCF-10A). Higher levels of Bmi-1 RNA and protein were observed in breast cancer cells, especially over-expressed in metastatic cancer cells (Figure 1C). These findings indicated that Bmi-1 is highly expressed in primary human breast cancer and metastatic breast cancer cells. This correlation also shows that Bmi-1 might have a crucial role in breast cancer metastasis.
Depletion of Bmi-1 induces reversion of EMT and regulates the phenotype in breast cancer cells
Previous studies have highlighted EMT as the mechanism by which epithelial cells lose many of their epithelial characteristics and adopt a mesenchymal appearances and mesenchymal characteristics, such as motility and invasiveness. We speculated that the cells had undergone a reversion of EMT by depletion in MDA-MB-231 cell. Bm-1 knockdown resulted in a dramatic shift from “Spindle” mesenchymal phenotype to “Cube” epithelial morphology (Figure 2A). To test this hypothesis, the expression levels of epithelial and mesenchymal markers were examined. The expression of Bmi-1 was sufficiently suppressed by siRNA (Figure 2B). The up-regulation of E-cadherin and the down-regulation of N-cadherin and vimentin were detected at both the mRNA and the protein levels in MDA-MB-231 cell (Figure 2C).
Figure 2.
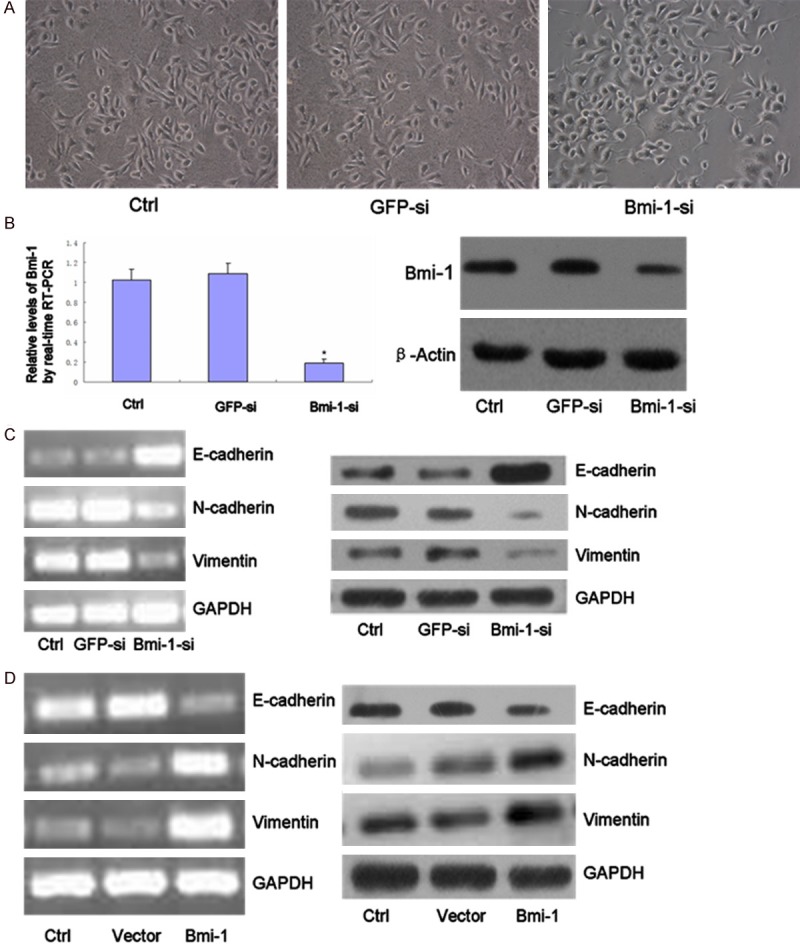
(A) Down-regulated expression of Bmi-1 led to morphological changes consistent with a mesenchymal to epithelial transition. Cells were photoed magnification in × 200. (B) qRT-PCR and Immunoblot for Bmi-1 in MDA-MB-231 cells at 72 h after transiently transfection with Bmi-1 siRNA. Cells that were transfected with GFP siRNA or no siRNA (Ctrl) were used as negative controls (*, P < 0.05). (C) Total RNA was extracted from MDA-MB-231 siRNA-transfected, and the mRNA expression levels of the indicated genes were determined by RT-PCR. (D) Follwing siRNA transfection, the expression of the indicated proteins was examined by immuoblot. (D) Bmi-1 overexpression in MDA-MB-468 cell line was established by transfection of GV144 or GV144-Bmi-1 vectors, respectively, and stably transfected colonies were selected for 14 days in the presence of G418 and then collected. Enforced expression of Bmi-1 reduced epithelial marker (E-cadherin) and increased mesenchymal markers expression levels in MDA-MB-468 cells.
Similar reciprocal relationship was observed with Bmi-1 over-expression in breast cancer cell BT474, we found that over expressed Bmi-1 caused a decrease in E-cadherin, but an increase in N-cadherin and vimentin in BT474 cells, by westernblot (Figure 2D). These results indicate that Bmi-1 has a crucial role in EMT regulation in breast cancer cells.
Bmi-1 regulates cell migration and invasion
EMT is associated with malignant properties, such as migration and invasion [16,17]. We tested whether Bmi-1 was required for these properties in mammary carcinoma cells. MDA-MB-231, BT474 cells were used to determine the effect of Bmi-1 on cell migration and invasion. Migration was assessed using a short-term transwell assay and scratch test. We next assessed cell invasiveness, we used Matrigel-coated Boyden chambers. Bmi-1 knockdown reduced cell migration and invasion of MDA-MB-231 cell (Figure 3A). The reduced invasiveness by Bmi-1 depletion is not due to the impaired viability of cells because cell proliferation was not inhibited by Bmi-1 siRNA transfection. We also assessed anchorage independent cell growth in the Bmi-1 knockdown cells. The knockdown of Bmi-1 expression suppressed colony formation in soft agar (Figure 3B).
Figure 3.
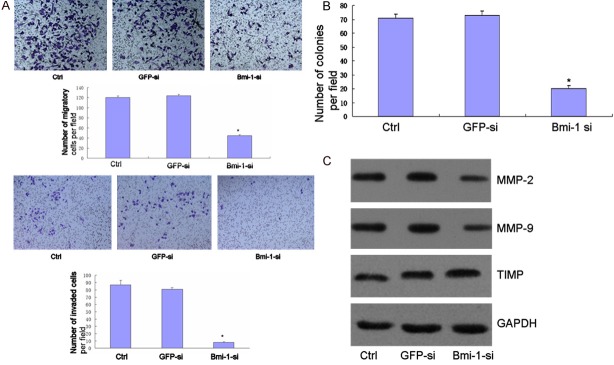
A. MDA-MB-231 cell was transfected with Bmi-1 small interfering RNA and GFP siRNA, and then subjected to the in vitro migration and invasion assay 72 hours later. Representative images of invading cells are shown (Magnification in × 200). The graph indicates the average number of invaded cells per fi eld. Three independent experiments were carried out, and the data are shown as the mean SD (*, P < 0.05). B. MDA-MB-231 was transfected with siRAN and then subjected to the soft agar colony formation assay. The graph indicates the average number of colonies per field. Three independent experiments were carried out, and data are shown as the Mean ± SD (*, P < 0.05). C. Equal amounts of cell lysates were loaded and probed with the MMP-2, MMP-9 and TIMP antibodies. Glyceraldehyde 3-phosphate dehydrogenase (GAPDH) was used as a loading control.
EMT has also been associated with the expression of MMPs/TIMP, which serve to degrade extracellular matrix proteins and facilitate cell invasion. We therefore determined the capacity of Bmi-1 regulate the expression of MMP/TIMP. Depletion of Bmi-1 decreased the levels of MMP-2, MMP-9 and increased TIMP secreted by MDA-MB-231 (Figure 3C).
Bmi-1 induces cell cycle arrest
The effect of Bmi-1 depletion on cell cycle progression was analyzed using FCM. Bmi-1 silencing induced an obvious increase in the number of cells at G0/G1 phase and reduction in S phase, as 77.10% of the MDA-MB-231 cells in Bmi-1si were noticed at G0/G1 phase, compared to 63.75% and 64.84% cells in the blank control and GFPsi, respectively (Figure 3A). There were significant differences between Bmi-1si and controls (p < 0.05). Western blot results clearly showed a reduction in the expression of cyclin D1 and an increase of p21 in Bmi-1si compared to the blank control and GFPsi (Figure 4A).
Figure 4.
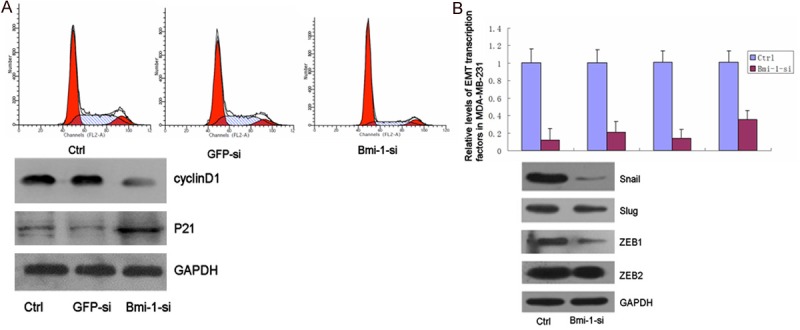
A. Effect of Bmi-1 depletion on cell cycle distribution and expression of cyclin D1, p21 of MDA-MB-231 cells. The effect of Bmi-1 depletion on cell cycle distribution as shown by FCM. Cells were collected 48 h after transfection and then stained with propidium iodide (PI). Bmi-1 silencing induced an obvious increase in the number of cells at G0/G1 phase and reduction in S phase; There were significant differences between Bmi-1si and control (*, P < 0.05). B. Western blot analysis of cyclin D1 and p21 in MDA-MB-231 cells 48 h after transfection. (5a) Bmi-1 depletion reduces EMT-induced transcription factors expression. The mRNA and protein levels of EMT-related transcription factors in MDA-MB-231 were examined by quantitative real-time PCR and immuoblot. The mRNA and protein levels of Snail, Slug, ZEB1 and ZEB2 were expressed relative to glyceraldehyde 3-phosphate dehydrogenase (GAPDH) transcript levels. Each experiment was performed in triplicate. Asterisks indicate significant differences between two groups (*, P < 0.05).
Bmi-1 silencing reduces the expression of EMT-induced transcription factors
To gain further insight into the molecular mechanisms by which Bmi-1 regulates EMT and malignant conversion, we determine whether Bmi-1-mediated repression of E-cadherin in EMT occurs through the regulation of EMT transcription factors. RNA was extracted from MDA-MB-231 cell that had been transfected with Bmi-1-targeting siRNA, and the mRNA expression of EMT-related transcription factors was examined by RT-PCR. We found that depletion of Bmi-1 reduced the expression of Snail, Slug, ZEB1 and ZEB2 in MDA-MB-231 (Figure 4B).
Discussion
We identified Bmi-1 as an oncogene highly expressed in breast cancer cells that promotes EMT and cellular motility. Firstly, we defined the overexpression of Bmi-1 in breast cancer, particularly in advanced cancer. Secondly, we showed that Bmi-1 is a positive regulator of cell migration and invasion in breast cancer cells. In addition, we found depletion of Bmi-1 decrease the migration and invasion of breast cancer cells concomitant with altered cytoskeleton rearrangement. Our results suggest that Bmi-1 may serve as a predictive marker for breast cancer with high metastatic potential.
Recent studies have shown that a morphologic conversion, known as epithelial-to-mesenchymal transition, is associated with the acquisition of malignant characteristics in breast cancer cells [18-20]. Owing to the clinical importance of this development, inhibition of EMT is an attractive therapeutic approach. However, it remains unknown which pathways should be inhibited to reverse EMT. In our study, we show for the fi rst time that Bmi-1 is a positive regulator of EMT. This conclusion was based on the phenomenon that depletion of Bmi-1 induced hallmarks of EMT (increased E-cadherin and decreased N-cadherin, vimentin, and fi bronectin), morphologic and decreased MMP production that reverse EMT. Given that EMT represents a critical event in the transition from early to invasive carcinomas and that E-cadherin downregulation is associated with poor prognosis and lower survival, our fi nding with Bmi-1 in cancer progression and metastasis is clinically relevant.
Acknowledgements
This work was supported by National Natural Science Foundation of China (Nos. 20125503110012 and cstc2011jjA10035).
Disclosure of conflict of interest
None.
References
- 1.van Lohuizen M, Verbeek S, Scheijen B, Wientjens E, van der Gulden H, Berns A. Identification of cooperating oncogenes in E mu-myc transgenic mice by provirus tagging. Cell. 1991;65:737–752. doi: 10.1016/0092-8674(91)90382-9. [DOI] [PubMed] [Google Scholar]
- 2.Joensuu K, Hagström J, Leidenius M, Haglund C, Andersson L, Sariola H, Heikkilä P. Bmi-1, c-myc, and Snail expression in primary breast cancers and their metastases-elevated Bmi-1 expression in late breast cancer relapses. Virchows Archiv. 2011;459:31–39. doi: 10.1007/s00428-011-1096-8. [DOI] [PubMed] [Google Scholar]
- 3.Lukacs RU, Memarzadeh S, Wu H, Witte ON. Bmi-1 Is a Crucial Regulator of Prostate Stem Cell Self-Renewal and Malignant Transformation. Cell Stem Cell. 2010;7:682–693. doi: 10.1016/j.stem.2010.11.013. [DOI] [PMC free article] [PubMed] [Google Scholar]
- 4.Kim JH, Yoon SY, Jeong SH, Kim SY, Moon SK, Joo JH, Lee Y, Choe IS, Kim JW. Overexpression of Bmi-1 oncoprotein correlates with axillary lymph node metastases in invasive ductal breast cancer. Breast. 2004;13:383–388. doi: 10.1016/j.breast.2004.02.010. [DOI] [PubMed] [Google Scholar]
- 5.Song W, Tao K, Li H, Jin C, Song Z, Li J, Shi H, Li X, Dang Z, Dou K. Bmi-1 is related to proliferation, survival and poor prognosis in pancreatic cancer. Cancer Sci. 2010;101:1754–1760. doi: 10.1111/j.1349-7006.2010.01577.x. [DOI] [PMC free article] [PubMed] [Google Scholar]
- 6.Cui H, Hu B, Li T, Ma J, Alam G, Gunning WT, Ding HF. Bmi-1 Is Essential for the Tumorigenicity of Neuroblastoma Cells. Am J Pathol. 2007;170:1370–1378. doi: 10.2353/ajpath.2007.060754. [DOI] [PMC free article] [PubMed] [Google Scholar]
- 7.Ye QH, Qin LX, Forgues M, He P, Kim JW, Peng AC, Simon R, Li Y, Robles AI, Chen Y, Ma ZC, Wu ZQ, Ye SL, Liu YK, Tang ZY, Wang XW. Predicting hepatitis B virus-positive metastatic hepatocellular carcinomas using gene expression profiling and supervised machine learning. Nat Med. 2003;9:416–423. doi: 10.1038/nm843. [DOI] [PubMed] [Google Scholar]
- 8.Wu J, Hu D, Yang G, Zhou J, Yang C, Gao Y, Zhu Z. Down-regulation of BMI-1 cooperates with artemisinin on growth inhibition of nasopharyngeal carcinoma cells. J Cell Biochem. 2011;112:1938–1948. doi: 10.1002/jcb.23114. [DOI] [PubMed] [Google Scholar]
- 9.Park IK, Morrison SJ, Clarke MF. Bmi1, stem cells, and senescence regulation. J Clin Invest. 2004;113:175–179. doi: 10.1172/JCI20800. [DOI] [PMC free article] [PubMed] [Google Scholar]
- 10.Yang J, Weinberg RA. Epithelial-Mesenchymal Transition: At the Crossroads of Development and Tumor Metastasis. Dev Cell. 2008;14:818–829. doi: 10.1016/j.devcel.2008.05.009. [DOI] [PubMed] [Google Scholar]
- 11.Thiery JP, Acloque H, Huang RYJ, Nieto MA. Epithelial-Mesenchymal Transitions in Development and Disease. Cell. 2009;139:871–890. doi: 10.1016/j.cell.2009.11.007. [DOI] [PubMed] [Google Scholar]
- 12.Yilmaz M, Christofori G. EMT, the cytoskeleton, and cancer cell invasion. Cancer Metastasis Rev. 2009;28:15–33. doi: 10.1007/s10555-008-9169-0. [DOI] [PubMed] [Google Scholar]
- 13.Birchmeier W, Birchmeier C. Epithelial-mesenchymal transitions in development and tumor progression. EXS. 1995;74:1–15. doi: 10.1007/978-3-0348-9070-0_1. [DOI] [PubMed] [Google Scholar]
- 14.Onder TT, Gupta PB, Mani SA, Yang J, Lander ES, Weinberg RA. Loss of E-cadherin promotes metastasis via multiple downstream transcriptional pathways. Cancer Res. 2008;68:3645–3654. doi: 10.1158/0008-5472.CAN-07-2938. [DOI] [PubMed] [Google Scholar]
- 15.Allred DC, Clark GM, Elledge R, Fuqua SA, Brown RW, Chamness GC, Osborne CK, McGuire WL. Association of p53 protein expression with tumor cell proliferation rate and clinical outcome in node-negative breast cancer. J Natl Cancer Inst. 1993;85:200–206. doi: 10.1093/jnci/85.3.200. [DOI] [PubMed] [Google Scholar]
- 16.Tiwari N, Gheldof A, Tatari M, Christofori G. EMT as the ultimate survival mechanism of cancer cells. Semin Cancer Biol. 2012;22:194–207. doi: 10.1016/j.semcancer.2012.02.013. [DOI] [PubMed] [Google Scholar]
- 17.Schmalhofer O, Brabletz S, Brabletz T. E-cadherin, β-catenin, and ZEB1 in malignant progression of cancer. Cancer Metastasis Rev. 2009;28:151–166. doi: 10.1007/s10555-008-9179-y. [DOI] [PubMed] [Google Scholar]
- 18.Song LB, Zeng MS, Liao WT, Zhang L, Mo HY, Liu WL, Shao JY, Wu QL, Li MZ, Xia YF, Fu LW, Huang WL, Dimri GP, Band V, Zeng YX. Bmi-1 Is a Novel Molecular Marker of Nasopharyngeal Carcinoma Progression and Immortalizes Primary Human Nasopharyngeal Epithelial Cells. Cancer Res. 2006;66:6225–6232. doi: 10.1158/0008-5472.CAN-06-0094. [DOI] [PubMed] [Google Scholar]
- 19.Song LB, Li J, Liao WT, Feng Y, Yu CP, Hu LJ, Kong QL, Xu LH, Zhang X, Liu WL, Li MZ, Zhang L, Kang TB, Fu LW, Huang WL, Xia YF, Tsao SW, Li M, Band V, Band H, Shi QH, Zeng YX, Zeng MS. The polycomb group protein Bmi-1 represses the tumor suppressor PTEN and induces epithelial-mesenchymal transition in human nasopharyngeal epithelial cells. J Clin Invest. 2009;119:3626–3636. doi: 10.1172/JCI39374. [DOI] [PMC free article] [PubMed] [Google Scholar]
- 20.Park IK, Qian D, Kiel M, Becker MW, Pihalja M, Weissman IL, Morrison SJ, Clarke MF. Bmi-1 is required for maintenance of adult self-renewing haematopoietic stem cells. Nature. 2003;423:302–305. doi: 10.1038/nature01587. [DOI] [PubMed] [Google Scholar]