Abstract
We present simulations of stimulated X-ray Raman (SXRS) signals from covalent porphyrin heterodimers with different linkers, chemical bonding structures and geometries. The signals are interpreted in terms of valence electron wavepacket motion. One- and two-color SXRS signals can jointly indicate excitation energy transfer (EET) between the porphyrin monomers. It is shown that the SXRS signals provide a novel window into EET dynamics in multiporphyrin systems, and can be used as a powerful tool to monitor the subtle chemical environment which affects EET.
I. INTRODUCTION
Porphyrin macrocycles can be found in almost every living organism. Coordinated to various metal atoms, porphyrins make the basic structural unit of many bio-molecules such as heme, cytochrome P450 and chlorophyll, which play key roles in supporting aerobic life. Porphyrins are arranged regularly in light-harvesting antenna complexes, acting as pigments to absorb the photon energy in sunlight and then transfer the excitation energy to the reaction center,1,2 where the energy is converted to chemical bonds. Excitation energy transfer (EET) in multiporphyrin systems is fundamental in understanding the natural light-harvesting process and may lead to applications in solar cell and molecular electronic3–5 or spintronic devices.6,7
Previously the EET process of multiporphyrin systems were probed by time-resolved fluorescence anisotropy decay.8 Combining fluorescence anisotropy decay rates with some kinetic model for the system allows the EET coupling strength to be estimated. Two-dimensional electronic spectroscopy (2DES) technique had been used to study the EET process in photosynthetic complexes.9,10 Compared to optical pulses, ultrashort (attosecond) X-ray pulses have bandwidths covering multiple electron volts, and can therefore coherently excite many electronic excited states through an impulsive Raman process. X-ray pulses can also take the advantage of the fact that core excitation are spectrally isolated, which allows to create a spatially localized valence excitation in the neighborhood of the atom in question. Combining attosecond duration with X-ray central frequency makes it possible to create an electronic excitation wavepacket specifically localized in a molecule, which is not generally achievable by using visible, UV, or XUV pulses. The one-dimensional stimulated X-ray Raman (SXRS) signal11 can directly detect the EET dynamics triggered by the pump pulse.
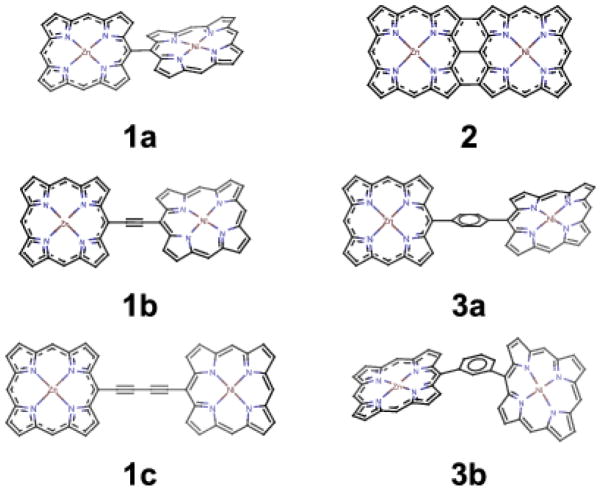
In this paper we want to study various factors which affect EET in a series of Zn-Ni porphyrin dimers with different linkers, chemical bonding and conformations (see Fig. 1). Understanding the EET between the two monomers in a dimer is the starting point for studying EET in multiporphyrin arrays, and a porphyrin dimer is still within the application range of modern quantum chemistry methods. We choose the Zn-Ni heterodimers since we can pump and probe on different monomers at different energy edges. We want to study the following dimer series (see Fig. 1): (1) 1a, 1b and 1c. In this series we compare a directly-linked porphyrin dimer with dimers with one or two ethynyl linkers. We will known how different linkers affect EET and the distance (between two metal centers) effect can also be analyzed; (2) 1a and 2. Comparison of SXRS signals of these two dimers will reveal the effect of π-conjugation in EET (we note the Zn-Ni distances are almost the same in the two dimers); (3) 3a and 3b. Structural units like 3a and 3b are very common in linear and cyclic porphyrin arrays, respectively. Comparison of their SXRS signals will give us some guidance in new molecular electronic device design. (4) Finally, we compare the signals of porphyrin dimers with different torsion angles (see Fig. 2 for details) of the two porphyrin monomers. This might help us to find the subtle relation between EET and the local geometries of porphyrin dimer units.
FIG. 1.
Various Zn-Ni porphyrin dimers in this study
FIG. 2.
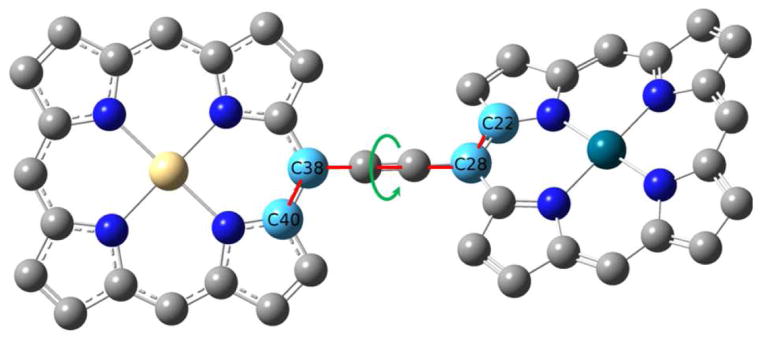
Zn-Ni porphyrin dimer in its equilibrium geometry. The torsion angle between carbon 22, 28, 38, 40 is 141.5 degree. This torsion angle is allowed to change to 90, 120 and 180 degree for comparsion in our simulation. The carbon atoms used to define the torsion angle are light blue; other carbon atoms are grey; the zinc atom is golden; the nickel atom is dark green; and the nitrogen atoms are dark blue.
The paper is structed as follows. We start with a brief description of the theory about SXRS signal and quantum chemistry methods we used in the studies. Then the SXRS signals of different dimers are compared and analyzed as mentioned above. Finally conclusions are drawn and possible future directions are discussed.
II. THEORY AND COMPUTATIONAL METHODS
Here we present simulations of the integrated two-pulse stimulated X-ray Raman spectroscopy (I2P-SXRS) signals for the various dimers. In the experiment, the X-ray pump and probe pulses create valence excitation wavepackets through Raman processes. The signal is the integrated intensity of the transmitted probe pulse with the pump minus that without, recorded versus the interpulse delay τ. The signals can be one-color, when the pump and probe are identical, or two-color, where the pump and probe are resonant with different core transitions. In our simulations, the signal is averaged to account for an isotropic distribution of molecular orientations. The probe polarization is set at the magic angle (θ = 54.7°) with respect to the pump polarization, which allows to treat the effective polarizability as a scalar rather than a tensor.12 We assume transform-limited Gaussian pulses in our simulations with FWHM of 166 as (10.9 eV). The power spectra of pulses used in this paper are shown over top of the XANES spectra in Fig. S1, S3, S5, S7 in the Supplemental Material.
The I2P-SXRS signal can be written as
| (1) |
where
| (2) |
is the effective isotropic polarizability of the molecule, averaged over the spectral envelope of the jth ultrashort pulse, εj. g is the ground state; e is a core-excited state; g′, g″ are valence-excited states; μkl and ωkl (k, l = e, g′, g″) are the transition dipoles and frequencies between the corresponding states, respectively. The summation in Eq. 1 is over the set of valence-excited states g′. This formula only contains the valence-excited coherence, and ignores any core-excited population created by the first X-ray pulse. The core edges considered here, the K- and L-edges of zinc and nickel, have lifetimes of a few fs13 after which Auger processes are expected to fill the core hole and ionize the molecule, taking it out of resonance with the probe pulse. For interpulse delays shorter than the core hole lifetime, excited-state absorption contributions not included in our simulations are to be expected. This signal can be recast as the imaginary part of the overlap SI2P–SXRS = −
 〈ψW |ψD(τ)〉 between the doorway wavepacket ψD created by the pump pulse and window wavepacket ψW created by the probe pulse. For detailed derivations, please see Ref. 14 and 15
The geometries of different Zn-Ni porphyrin dimers were optimized using the quantum chemistry package Gaussian0916 at the B3LYP17,18/6-31G* level of theory. Core excitations were calculated with restricted excitation window time-dependent density functional theory(REW-TDDFT).19–23 All REW-TDDFT calculations and transition dipole calculations were performed with a locally modified version of NWChem code24 at the CAM-B3LYP25/6-311G** level of theory, and with the Tamm-Dancoff approximation26.
III. RESULTS AND DISCUSSION
As shown previously,8 I2P-SXRS can be used to probe energy transfer in porphyrin dimers. When a two-color setup is used where the pump and probe excite metal centers on different monomers, the signal will vanish in the absence of intermonomer coupling. However, it is the one-color signal that reveals whether the valence wavepacket created by a given pulse undergoes significant energy transfer. This can be understood by using the doorway-window picture. When a local doorway excited state wavepacket is created in a porphyrin dimer by an X-ray pump pulse, it usually can have three possible fates: (1) The doorway wavepacket is stationary. In this case the signal will show only high-frequency oscillations as the doorway changes phase with respect to the window. (2) EET does occur and the doorway wavepacket moves back and forth between the two monomers. In this case we can observe low-frequency amplitude oscillations in both the one- and two-color SXRS signals, on top of the high-frequency oscillations described above. (3) The doorway wavepacket becomes delocalized, spreading over the entire dimer, and does not concentrate again on a single monomer. In this case the SXRS signal has many Fourier components and the overall pattern becomes very complicated.
In these model porphyrin heterodimer systems, we choose the zinc and nickel 1s and 2p edges for our SXRS signal simulation. There are 16 possible combinations for the pump/probe pulse pairs. We find if the pump/probe pulse order is switched, e.g., Zn2p/Ni1s to Ni1s/Zn2p, the SXRS signals look very similar. This is not surprising since if we look at the Eq. 1 we see that the time-reversed signal, obtained by interchanging the identity of the pump and probe, differs from the ordinary signal by substituting α1 and with and α2. This was discussed in detail in Sec. IIID of Ref. 23. So, for two-color signals, we only show and study signals correspond to one of the two pump/probe combinations in this paper.
We want to emphasize that except for dimer 2, all Ni porphyrin rings are not planar, while all Zn porphyrin rings are almost planar. In dimer 2, the triple linkages to the planar Zn porphyrin ring force the Ni porphyrin ring to be planar as well. A planar macrocycle usually means strong electron conjugation. We will see the conjugation effect on EET in the following comparison series.
A. SERIES 1
In Fig. S1 in the Supplemental Material we show the simulated XANES spectra for the dimer series 1a, 1b and 1c. For the four spectral regions considered in the figure, the K- and L-edges of nickel and zinc, the position of the dominant peaks are largely unchanged.27 This indicates that the unoccupied valence orbitals into which the core electron is promoted are largely unaffected by the changes between these dimers, being localized to one monomer or the other. Fig. S2 (see Supplemental Material) shows the simulated absorption spectra in the UV and visible regions for the three dimers in this series. Unlike the XANES, there is a large difference between the spectra for the directly linked dimer (1a), and those with ethynyl linking groups (1b and 1c), indicating that the unoccupied valence orbitals participating in these excitations are delocalized over both monomers. The valence absorption for dimers 1b and 1c are similar, with the first two excitations lower in energy for dimer 1c, indicating that a longer linking group lowers the energy of the unoccupied valence orbitals.
The four one-color I2P-SXRS signals for each of the dimers in this series are shown in the first, fifth, third, and fifth columns of Figs. 3 and 4, respectively. In order to see more clearly the magnitude of any low-frequency oscillations, we have suppressed the exponential lifetime decay present in previous calculations.8 Low-frequency oscillations which may indicate energy transfer are seen in just a few of the one-color signals in this series. The Zn2p/Zn2p signal for dimer 1b in Fig. 3 is the best example of this, and was examined in detail in Ref. 8. This signal shows low-frequency oscillations with period of ~ 25 fs which was shown to correlate with electron and hole density migration between monomers. That this is energy transfer in dimer 1b can also be confirmed by comparing the Zn2p/Zn2p signal with the Zn2p/Ni2p signal (see Fig. 3, where the pump and probe pulses are resonant with the zinc and nickel L-edges, respectively) shown. When the amplitude of the Zn2p/Zn2p signal is highest, the Zn2p/Ni2p signal amplitude is lowest, and vice versa. These two signals provide complementary windows on the time-evolution of the Zn2p doorway wavepacket. The Zn2p/Zn2p signals for dimers 1a and 1c, however, do not show any evidence of significant wavepacket motion; the amplitude oscillations shown in these signals are only a small percentage of the total signal.
FIG. 3.
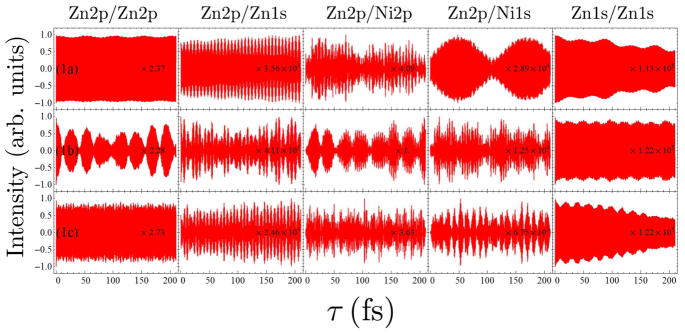
Comparison of the I2P-SXRS signals for dimers 1a, 1b, and 1c, for five combinations of pump and probe. All signals have been normalized to lie between −1 and 1 prior to plotting. The relative scale is indicated as a multiplier on each signal, i.e. the largest signal, the Zn2p/Ni2p for dimer 1b, has a multiplier of 1.
FIG. 4.
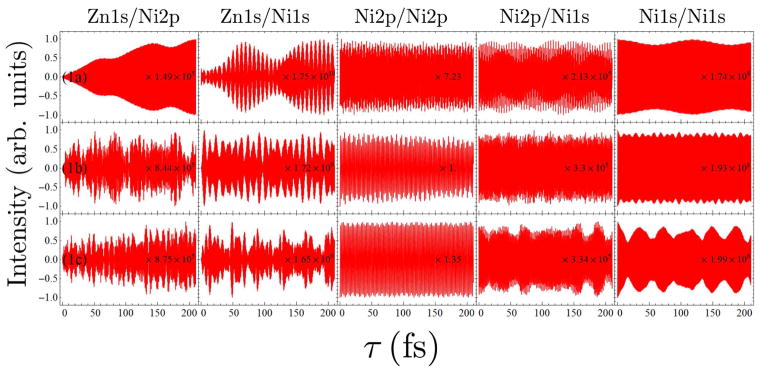
Comparison of the I2P-SXRS signals for dimers 1a, 1b, and 1c, for the other five different combinations of pump and probe.
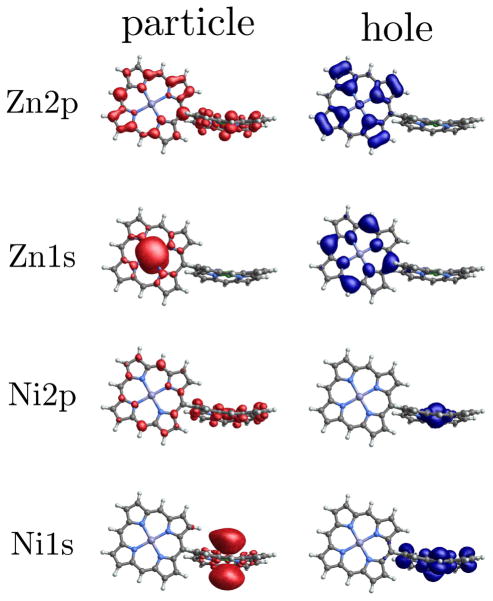
Not all signals are as indicative as the Zn2p/Zn2p signal of 1b. For example, the Ni2p/Ni1s (Fig. 4) and Ni1s/Ni1s signals (Fig. 4) only show small amplitude oscillations, which suggests a hovering or diffusing doorway wavepacket. In other cases, the window wavepacket is so localized that it only probes a small region of the monomer. This explains why the Zn2p/Zn2p signal of 1a does not show too much amplitude oscillation but the Zn2p/Ni1s signal does. In Fig. 5 we show the electron and hole densities for the Zn2p, Zn1s, Ni2p, and Ni1s window wavepackets for dimer 1a (for details on the calculation of the electron and hole densities, see the supplementary information for Refs. 8 and 28). For 2p excitation, the hole is localized to the monomer containing the relevant metal center but the particle is spread across both monomers, so the overlap with the doorway wavepacket does not change too much as time goes by. While for the 1s excitations, both particle and hole are localized, with the particle being tightly focused near the metal atom, so we may see oscillating signals as the doorway wavepaket accumulates and decays within the window wavepacket domain.
FIG. 5.
Electron and hole densities for window wavepackets prepared using the four pulses considered here, for dimer 1a. The zinc monomer, which is planar, is on the left and the nonplanar nickel monomer is on the right. Particle and hole isosurfaces are shown in red and blue, respectively. The wavepackets were normalized prior to plotting.
The Zn1s/Zn1s signals (Fig. 3) do show some low-frequency oscillations, and those for dimers 1a and 1c show diminish in amplitude by half over the course of 200 fs, perhaps suggestive of weak energy transfer coupling. For dimer 1a, the Zn1s/Ni2p signal in Fig. 4 appears to grow in on this same timescale, suggestive of weak energy transfer coupling for this wavepacket. There is no apparent intermonomer motion of the Zn1s wavepacket for dimer 1b, however. The Ni2p/Ni2p signals (Fig. 4) do not show significant amplitude fluctuations for any of the dimers in this series. The Ni1s/Ni1s signals (Fig. 4) are likewise not indicative of any significant energy transfer for this series of dimers.
Since the transition dipoles of the Zn and Ni 1s core excitations are much smaller than those of the Zn and Ni 2p core excitations, the SXRS signals involving the K-edge pulses are also much smaller than the Zn2p/Zn2p, Ni2p/Ni2p or Zn2p/Ni2p signals. So we focus on the L-edge one- and two-color signals to examine the EET efficiency in the system. From the Zn2p/Zn2p and Zn2p/Ni2p signals (Fig. 3) we can see 1b shows significant EET while 1a and 1c do not show much EET. This suggests an ethynyl linker may facilitate EET between the two porphyrin rings but two ehtynyl linkers might be too long for the excited state wavepacket to travel through. The Ni2p/Ni2p signals (Fig. 4) of the three species only show very weak EET. By analyzing the proper SXRS signals one may find the good linker candidate with optimal length to gain high EET efficiency in a multiporphyrin system.
B. SERIES 2
Here we compare two porphyrin dimers with a similar intermonomer distance, but vastly different bonding motifs. Dimer 1a is the directly linked dimer where a C-C single bond connects the monomers, and steric hindrance keeps the monomers at a fixed angle with respect to each other. Dimer 2 features three bonds between monomers, extending the π-conjugation across monomers. The XANES spectra for these two dimers, shown in Fig. S3 (Supplemental Material), are largely the same. Unsurprisingly, the UV/visible absorption spectra for these two dimers in Fig. S4 (Supplemental Material) are radically different from each other due to the extended conjugation between monomers in dimer 2.
As shown in the previous section, energy transfer of the four doorway wavepackets considered here in dimer 1a is very limited in extent. The limited wavepacket motion that is present is limited to the Zn1s and Ni1s wavepackets, indicating that the 2p excitations are confined to the monomers on which they begin. For dimer 2, the opposite appears to be the case. The Zn1s/Zn1s and Ni1s/Ni1s signals for dimer 2, in Figs. 6 and 7, respectively, do not show any reduction in amplitude over the first 200 fs. The Zn2p/Zn2p and Ni2p/Ni2p signals for dimer 2, in Figs. 6 and 7, respectively, reduce in amplitude by to less than half their initial values within the first 5 fs, and show a complicated pattern not indicative of simple back-and-forth motion. Taken together, these data suggest that the π-cloud is completely delocalized in dimer 2, and that the initially localized electronic wavepacket quickly spreads to the whole molecule and does not re-localize on the timescale of our investigation. This delocalization behavior should be attributed to the strong π-conjugation effect in the planar dimer 2. Strong electron conjugation between the two monomers will facilitate EET, which supported by theoretical studies on porphyrin arrays consisting of structural dimer unit 2.29–31
FIG. 6.
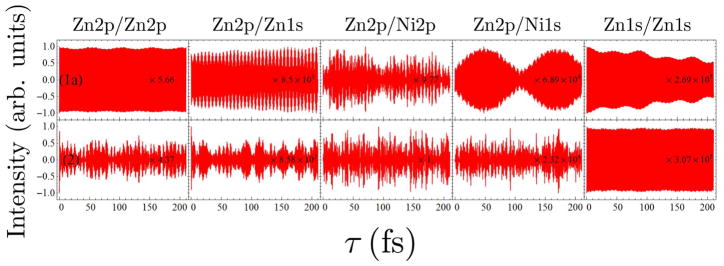
Comparison of the I2P-SXRS signals for dimers 1a and 2, for five combinations of pump and probe.
FIG. 7.
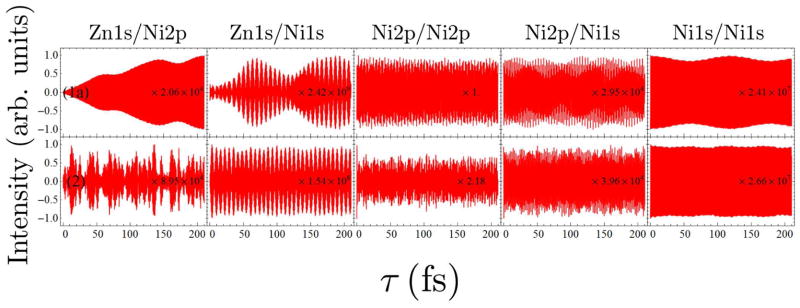
Comparison of the I2P-SXRS signals for dimers 1a and 2, for the other five different combinations of pump and probe.
IV. SERIES 3
Here we compare two dimers with a benzyl linking group, but with different bonding structures. Dimer 3a has the two porphyrin monomers para to each other, while dimer 3b has them in the meta position. The XANES spectra for these two dimers, shown in Fig. S5 (Supplemental Material) are largely the same for the nickel L-edge and zinc K-edge. However, the nickel K-edge and zinc L-edge spectra show marked differences, specifically in the higher energy regions. The UV/visible absorption spectra for this series in Fig. S6 (Supplemental Material) have peaks in roughly the same positions, but with a slightly different intensity pattern.
In Fig. 8, we can find the Zn2p/Zn2p signal of dimer 3b show a little more oscillations than that of dimer 3a, and the Zn2p/Ni2p signals show the same tendency. This suggests in EET process of a porphyrin dimer, a “face-to-face” configuration (dimer 3b) might be more efficient than an “edge-to-edge” configuration (dimer 3a). Cofacially-stacking porphyrin arrays are Nature’s choice. One can find porphyrin monomers arranged in a slipped-cofacial way in the B800 ring of the light-harvesting complex 2 (LH2) of purple bacterium.1 This stimulates researchers to synthesis cyclic porphyrin arrays to achieve high EET efficiency.32,33
FIG. 8.
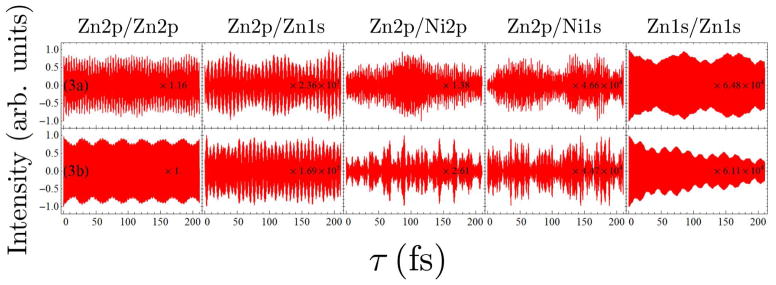
Comparison of the I2P-SXRS signals for dimers 3a and 3b, for five combinations of pump and probe.
The Zn1s/Zn1s signal, shown in Fig. 8, is suggestive of some energy transfer between monomers. In dimer 3a, the signal shows low-frequency oscillations with a period of ~ 90 fs. This same oscillation period can be seen in the Zn1s/Ni2p signal (Fig. 9), which is further evidence of intermonomer motion of the Zn1s wavepacket. This is a regular signal pattern we have seen in the Zn2p/Zn2p and Zn2p/Ni2p signals of dimer 1b. In dimer 3b, the one-color Zn1s/Zn1s signal amplitude reaches ten percent of its initial value after 200 fs, however, the Zn1s/Ni2p signal of 3b grows suddenly at τ = 48 fs. An explanation of this is although the Zn1s doorway wavepacket leaves the monomer gradually, it enters the domain of localized Ni2p suddenly and then stays there, so that we see a particular pattern of the Zn1s/Ni2p signal of 3b. We can not see this pattern in the signals of dimer 3a. This means we can use SXRS signal to distinguish different bonding structures.
FIG. 9.
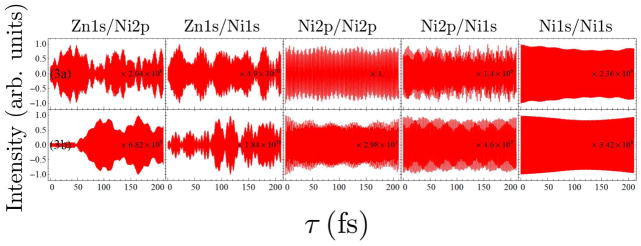
Comparison of the I2P-SXRS signals for dimers 3a and 3b, for the other five different combinations of pump and probe.
V. SERIES 4
Here we look at the porphyrin dimer 1b, with an ethynyl linking group, with the inter-monomer angle (see Fig. 2) set to different values. In Fig. S7 (Supplemental Material) we show the XANES spectra for this series. Note that for θ = 141.5° (dimer 1b), a higher number of core-excited states were calculated leading to many high-energy peaks not present for the other dimers of this series. In the lower-energy region, near to the core edges, the nickel K- and L-edge spectra are largely insensitive to changes of the intermonomer angle. The Zn1s spectra are roughly the same for θ = 90°, θ = 120°, and θ = 141.5°, but different for θ = 180°. The Zn2p spectra are, conversely, the same for intermonomer angles of 120°, 141.5°, and 120°, but much different for 90°. The UV/visible absorption spectra in Fig. S8 (Supplemental Material) appears to depend heavily on the intermonomer angle, with a low-energy peak at 2.1 eV growing in as the angle is increased.
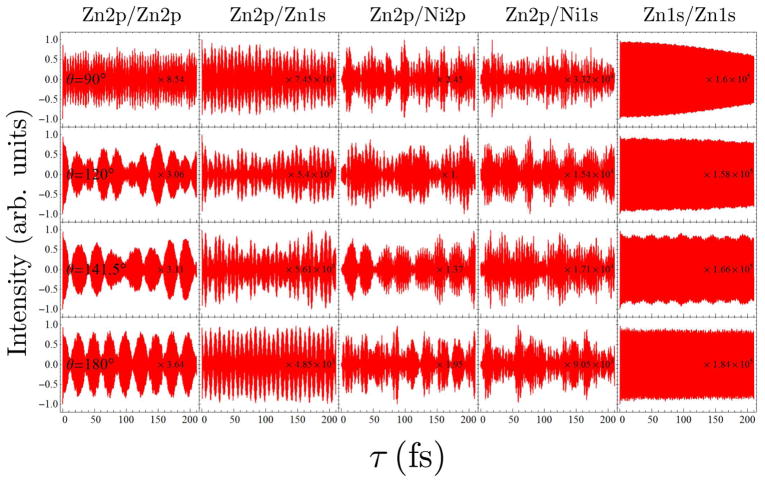
The I2P-SXRS signals for this series are shown in Figs. 10–11. From the one-color signals, we see that only certain doorway wavepackets have significant amplitude leave the local region they initially occupy. The Zn2p/Zn2p signals (Fig. 10) for all angles quickly decrease to a fraction of their initial value, although only for intermonomer angles of 120°, 141.5°, and 180° do we see a simple low-frequency beating pattern. For these three angles, the Zn2p/Zn2p signals are very similar, with the first signal minimum occurring between τ = 12.15 fs and τ = 12.30 fs. The two-color signals for with a Zn2p pump are quite dissimilar for this series, however. For θ = 90° there is no simple pattern of wavepacket motion in the signals, indicating that the initially localized doorway quickly spreads and remains delocalized. For θ = 120°, there is some indication that when the Zn2p/Zn2p signal is low, the Zn2p/Ni1s signal (Fig. 10) grows, as the doorway moves into a region of spatial overlap with the Ni1s window. For the optimized geometry, with θ = 141.5°, we see clear evidence that the doorway moves coherently into the Ni2p window on the other monomer. For θ = 180°, the two-color signals are complicated, similar to the θ = 90° case.
FIG. 10.
Comparison of the I2P-SXRS signals for dimer 1b with four different intermonomer angles, for five combinations of pump and probe.
FIG. 11.
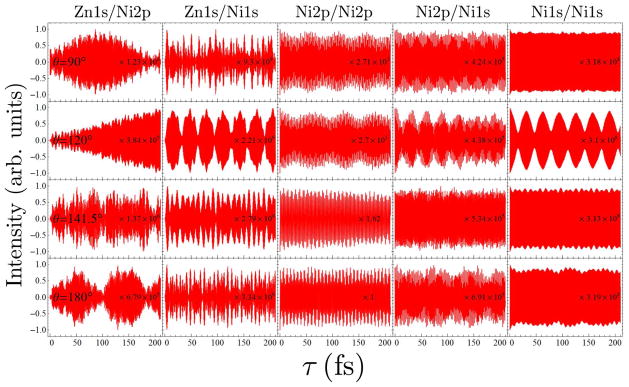
Comparison of the I2P-SXRS signals for dimer 1b with four different intermonomer angles, for the other five different combinations of pump and probe.
The Zn1s/Zn1s signals (Fig. 10) for this series do not give any indication of wavepacket motion, and the Ni2p/Ni2p signals (Fig. 11) show very complicated patterns indicative of multiple spectral components, and are not suggestive of intermonomer excitation transfer. The Ni1s/Ni1s signals (Fig. 11) for intermonomer angles of 90°, 141.5°, and 180° are similar to the Zn1s/Zn1s signals, but the case of θ = 120° uniquely shows low-frequency motion. For this dimer only, clear evidence of energy transfer is seen. The Ni1s/Ni1s signal shows a clear and strong beating with a period of ~ 30 fs, which is matched by the corresponding Ni1s/Zn1s(Zn1s/Ni1s) signal pattern (Fig. 11). When the Ni1s doorway leaves the spatial region of the Ni1s window, it clearly enters the Zn1s window. This pattern is very distinct from those of the Ni1s/Ni1s signal of dimers with other torsion angles. This tells us that SXRS is very sensitive to the local geometry of where EET taking place and may serve as a powerful tool to detect the local geometrical factors.
VI. CONCLUSION
Integrated two-pulse stimulated X-ray Raman spectroscopy can probe intermonomer excitation energy transfer by creating localized electronic wavepackets and watching their time-evolution through localized spatial windows on the same or a different porphyrin monomer. When the one-color signal shows a strong low-frequency oscillation, this can be interpreted as motion of the wavepacket out of the region it is initially excited into. When this oscillation is matched by a similar oscillation in the two-color signal with the same pump, this corresponds to the wavepacket moving into and out of the spatial window centered around the probe atom. Although not all pump/probe combinations show signatures of EET, we can generally select a proper SXRS signal out of many pump/probe combinations to study EET. SXRS signals can guide us in molecular engineering of porphyrin arrays, which are important in building highly efficient artificial light-harvesting devices. The signal is also very sensitive to the chemical bonding and local geometrical environment of EET, and could offer us a specific window to see the refined structures along the EET pathway. This study is the first step in making connections between SXRS signals and chemical structures. No doubt there is still unexplored rich information hidden in all kinds of SXRS signals. This is left for future study.
Supplementary Material
Acknowledgments
The support of the Chemical Sciences, Geosciences and Biosciences Division, Office of Basic Energy Sciences, Office of Science, U.S. Department of Energy is gratefully acknowledged. We also gratefully acknowledge the support of the National Science Foundation (Grant CHE-1058791), and the National Institutes of Health (Grant GM-59230). Help on the REW-TDDFT calculations from Niranjan Govind of the Pacific Northwest National Lab (PNNL) is greatly appreciated. A portion of the research was performed using EMSL, a national scientific user facility sponsored by the Department of Energy’s Office of Biological and Environmental Research and located at Pacific Northwest National Laboratory.
References
- 1.McDermott GM, Prince SM, Freer AA, Hawthornthwaite-Lawless AM, Papiz MZ, Cogdell RJ, Isaacs NW. Crystal structure of an integral membrane light-harvesting complex from photosynthetic bacteria. Nature. 1995;374:517–521. [Google Scholar]
- 2.Freer A, Prince S, Sauer K, Papiz M, Lawless AH, McDermott G, Cogdell R, Isaacs NW. Pigmentcpigment interactions and energy transfer in the antenna complex of the photosynthetic bacterium rhodopseudomonasacidophila. Structure. 1994;4:449. doi: 10.1016/s0969-2126(96)00050-0. [DOI] [PubMed] [Google Scholar]
- 3.Jurow M, Schuckmanb AE, Batteasb JD, Drain CM. Porphyrins as molecular electronic components of functional devices. Coord Chem Rev. 2010;254:2297–2310. doi: 10.1016/j.ccr.2010.05.014. [DOI] [PMC free article] [PubMed] [Google Scholar]
- 4.Lindsey JS, Bocian DF. Molecules for charge-based information storage. Acc Chem Res. 2011;44:638–650. doi: 10.1021/ar200107x. [DOI] [PubMed] [Google Scholar]
- 5.Hasobe T. Photo- and electro-functional self-assembled architectures of porphyrins. Phys Chem Chem Phys. 2012;14:15975–15987. doi: 10.1039/c2cp42957h. [DOI] [PubMed] [Google Scholar]
- 6.Cho WJ, Cho Y, Min SK, Kim WY, Kim KS. Chromium porphyrin arrays as spintronic devices. J Am Chem Soc. 2011;133:9364–9369. doi: 10.1021/ja111565w. [DOI] [PubMed] [Google Scholar]
- 7.Ma Y, Dai Y, Zhang Z, Yu L, Huang B. Magnetic properties of phthalocyanine-based organometallic nanowire. App Phys Lett. 2012;101:062405. [Google Scholar]
- 8.Biggs JD, Zhang Y, Healion D, Mukamel S. Watching energy transfer in metel-loporphyrin heterodimers using x-ray raman spectroscopy. Proc Natl Acad Sci. 2013;110:15597. doi: 10.1073/pnas.1308604110. [DOI] [PMC free article] [PubMed] [Google Scholar]
- 9.Brixner T, Stenger J, Vaswani HM, Cho M, Blankenship RE, Fleming GR. Two-dimensional spectroscopy of electronic couplings in photosynthesis. Nature. 2005;434:625–628. doi: 10.1038/nature03429. [DOI] [PubMed] [Google Scholar]
- 10.Engel GS, Calhoun TR, Read EL, Ahn T-K, Mancal T, Cheng Y-C, Blankenship RE, Fleming GR. Evidence for wavelike energy transfer through quantum coherence in photosynthetic systems. Nature. 2007;446:782–786. doi: 10.1038/nature05678. [DOI] [PubMed] [Google Scholar]
- 11.Healion D, Biggs JD, Mukamel S. Manipulating one- and two-dimensional stimulated-x-ray resonant-raman signals in molecules by pulse polarizations. 2012;86:033429. [Google Scholar]
- 12.Mukamel S, Healion D, Zhang Y, Biggs JD. Multidimensional attosecond resonant x-ray spectroscopy of molecules: Lessons from the optical regime. Ann Rev Phys Chem. 2013;64:101–127. doi: 10.1146/annurev-physchem-040412-110021. [DOI] [PMC free article] [PubMed] [Google Scholar]
- 13.Zschornack GH. Handbook of x-ray Data. 1. Springer; 2007. [Google Scholar]
- 14.Yan YJ, Mukamel S. Femtosecond pump-probe spectroscopy of polyatomic molecules in condensed phases. Phys Rev A. 1990 Jun;41:6485–6504. doi: 10.1103/physreva.41.6485. [DOI] [PubMed] [Google Scholar]
- 15.Mukamel S. Principles of Nonlinear Optical Spectroscopy. Oxford University Press; New York: 1995. [Google Scholar]
- 16.Frisch MJ, Trucks GW, Schlegel HB, Scuseria GE, Robb MA, Cheese-man JR, Scalmani G, Barone V, Mennucci B, Petersson GA, Nakatsuji H, Caricato M, Li X, Hratchian HP, Izmaylov AF, Bloino J, Zheng G, Sonnenberg JL, Hada M, Ehara M, Toyota K, Fukuda R, Hasegawa J, Ishida M, Nakajima T, Honda Y, Kitao O, Nakai H, Vreven T, Montgomery JJA, Peralta JE, Ogliaro F, Bearpark M, Heyd JJ, Brothers E, Kudin KN, Staroverov VN, Kobayashi R, Normand J, Raghavachari K, Rendell A, Burant JC, Iyengar SS, Tomasi J, Cossi M, Rega N, Millam JM, Klene M, Knox JE, Cross JB, Bakken V, Adamo C, Jaramillo J, Gomperts R, Stratmann RE, Yazyev O, Austin AJ, Cammi R, Pomelli C, Ochterski JW, Martin RL, Morokuma K, Zakrzewski VG, Voth GA, Salvador P, Dannenberg JJ, Dapprich S, Daniels AD, Farkas Ö, Foresman JB, Ortiz JV, Cioslowski J, Fox DJ. “Gaussian 09, revision c.01,” 2009. Gaussian Inc; Walling-ford CT: 2009. [Google Scholar]
- 17.Becke AD. Density-functional thermochemistry. III. the role of exact exchange. J Chem Phys. 1993;98:5648–5652. [Google Scholar]
- 18.Stephens PJ, Devlin FJ, Chabalowski CF, Frisch MJ. Ab initio calculation of vibrational absorption and circular dichroism spectra using density functional force fields. J Phys Chem. 1994;98:11623–11627. [Google Scholar]
- 19.Stener M, Fronzoni G, de Simone M. Time dependent density functional theory of core electrons excitations. Chem Phys Lett. 2003;373:115–123. [Google Scholar]
- 20.Besley NA, Noble A. Time-dependent density functional theory study of the x-ray absorption spectroscopy of acetylene, ethylene, and benzene on si(100) J Phys Chem C. 2007;111:3333–3340. [Google Scholar]
- 21.DeBeer-George S, Petrenko T, Neese F. Time-dependent density functional calculations of ligand k-edge x-ray absorption spectra. Inorg Chim Acta. 2008;361:965–972. [Google Scholar]
- 22.Lopata K, Van Kuiken BE, Khalil M, Govind N. Linear-response and real-time time-dependent density functional theory studies of core-level near-edge x-ray absorption. J Chem Theory Comput. 2012;8:3284–3292. doi: 10.1021/ct3005613. [DOI] [PubMed] [Google Scholar]
- 23.Zhang Y, Biggs JD, Healion D, Govind N, Mukamel S. Core and valence excitations in resonant x-ray spectroscopy using restricted excitation window time-dependent density functional theory. J Chem Phys. 2012;137:194306. doi: 10.1063/1.4766356. [DOI] [PMC free article] [PubMed] [Google Scholar]
- 24.Valiev M, Bylaska E, Govind N, Kowalski K, Straatsma T, van Dam H, Wang D, Nieplocha J, Apra E, Windus T, de Jong W. NWChem: A comprehensive and scalable open-source solution for large scale molecular simulations. Comput Phys Commun. 2010;181:1477–1489. [Google Scholar]
- 25.Yanai T, Tew D, Handy N. A new hybrid exchangecorrelation functional using the coulomb-attenuating method (CAM-B3LYP) Chem Phys Lett. 2004;393:51–57. [Google Scholar]
- 26.Hirata S, Head-Gordon M. Time-dependent density functional theory within the tammdancoff approximation. Chem Phys Lett. 1999;314:291–299. [Google Scholar]
- 27.For dimer 1b, the number of core-excited states included in our calculations is larger, so more higher-energy peaks are included.
- 28.Healion D, Zhang Y, Biggs JD, Govind N, Mukamel S. Entangled valence electron–hole dynamics revealed by stimulated attosecond x-ray raman scattering. 2012;3(17):2326–2331. doi: 10.1021/jz300981w. [DOI] [PMC free article] [PubMed] [Google Scholar]
- 29.Gao G, Kang HS. Engineering of the electronic structures of metal-porphyrin tapes and metal-hexaphyrin tapes: A first-principles study. Chem Phys. 2010;369:66–70. [Google Scholar]
- 30.Cho S, Yoon MC, Kim KS, Kim P, Kim D. Electron delocalization in various triply linked zinc(ii) porphyrin arrays: role of antiaromatic junctions between aromatic porphyrins. Phys Chem Chem Phys. 2011;13:16175–16181. doi: 10.1039/c1cp21737b. [DOI] [PubMed] [Google Scholar]
- 31.Makino M, ichi Aihara J. Macrocyclic aromaticity of porphyrin units in fully conjugated oligoporphyrins. J Phys Chem A. 2012;116:8074. doi: 10.1021/jp304681h. [DOI] [PubMed] [Google Scholar]
- 32.Nakamura Y, Aratani N, Osuka A. Cyclic porphyrin arrays as artificial photo-synthetic antenna: synthesis and excitation energy transfer. Chem Soc Rev. 2007;36:831–845. doi: 10.1039/b618854k. [DOI] [PubMed] [Google Scholar]
- 33.Yang J, Yoon MC, Yoo H, Kim P, Kim D. Excitation energy transfer in multiporphyrin arrays with cyclic architectures: towards artificial light-harvesting antenna complexes. Chem Soc Rev. 2012;41:4808–4826. doi: 10.1039/c2cs35022j. [DOI] [PubMed] [Google Scholar]
Associated Data
This section collects any data citations, data availability statements, or supplementary materials included in this article.


