Abstract
Genetic interaction networks that underlie most human diseases are highly complex and poorly defined. Better-defined networks will allow identification of a greater number of therapeutic targets.
Here we introduce our Yeast Augmented Network Analysis (YANA) approach and test it with the X-linked spinal muscular atrophy (SMA) disease gene UBA1. First, we express UBA1 and a mutant variant in fission yeast and use high-throughput methods to identify fission yeast genetic modifiers of UBA1. Second, we analyze available protein-protein interaction network databases in both fission yeast and human to construct UBA1 genetic networks. Third, from these networks we identified potential therapeutic targets for SMA. Finally, we validate one of these targets in a vertebrate (zebrafish) SMA model. This study demonstrates the power of combining synthetic and chemical genetics with a simple model system to identify human disease gene networks that can be exploited for treating human diseases.
Introduction
Many disease-associated genes have been identified, yet most genetic diseases remain untreatable. One path to treatment is to develop extensive genetic networks in which human disease genes function (or dysfunction) and then target therapies to the genes identified in those networks. Eventually, an individual’s own genotype for proteins in the network may also be considered in the therapeutic options. Developing gene networks is already widely recognized as a powerful approach to identify new drug targets 1– 6. Gene networks are based on the principle that networks contain proteins that interact (physically and/or functionally) and that these interactions govern most, if not all, cellular functions. Importantly, gene network interactions are often conserved in different organisms even though the output of the networks may differ 7. Candidate networks can be generated from studies in model organisms and then extrapolated to human cells. One can expect that, for disease gene networks, some of the interacting genes might modulate the disease phenotype thus representing potential therapeutic targets.
The direct identification of disease networks from studies in human cells is, of course, challenging because of the large number of potential proteins and incomplete knowledge of how the activity of any one protein may affect the network output. Analysis of networks would benefit from studies in a tractable model organism amenable to high throughput methods. Given that network interactions may be conserved between humans and model organisms, even while the outputs may differ, we hypothesized that we can identify human disease networks in the fission yeast Schizosaccharomyces pombe, a simple, genetically tractable model organism, coupled to existing protein-protein interaction databases. We can then transfer that network knowledge to human cells with the goal of identifying therapeutic target genes.
How valid is the approach of using fission yeast networks to identify human disease gene networks? First, the proteins that control most core cellular functions are in fact evolutionarily conserved, underscoring the “deep homology” that exists between all living organisms 8, 9. For example, in S. pombe >65% of the genome is orthologous to human ( http://orthomcl.org/orthomcl/ and http://www.pombase.org). Second, many of the cellular processes implicated in human disease, e.g. vesicular transport, protein folding, metabolism, and RNA processing, are also evolutionarily conserved and highly interconnected 10. Importantly, the value of a simple model organism for discovering “druggable” genetic pathways has recently been demonstrated for the budding yeast Saccharomyces cerevisiae 11, and thus extending the study of human disease genes to fission yeast seems promising.
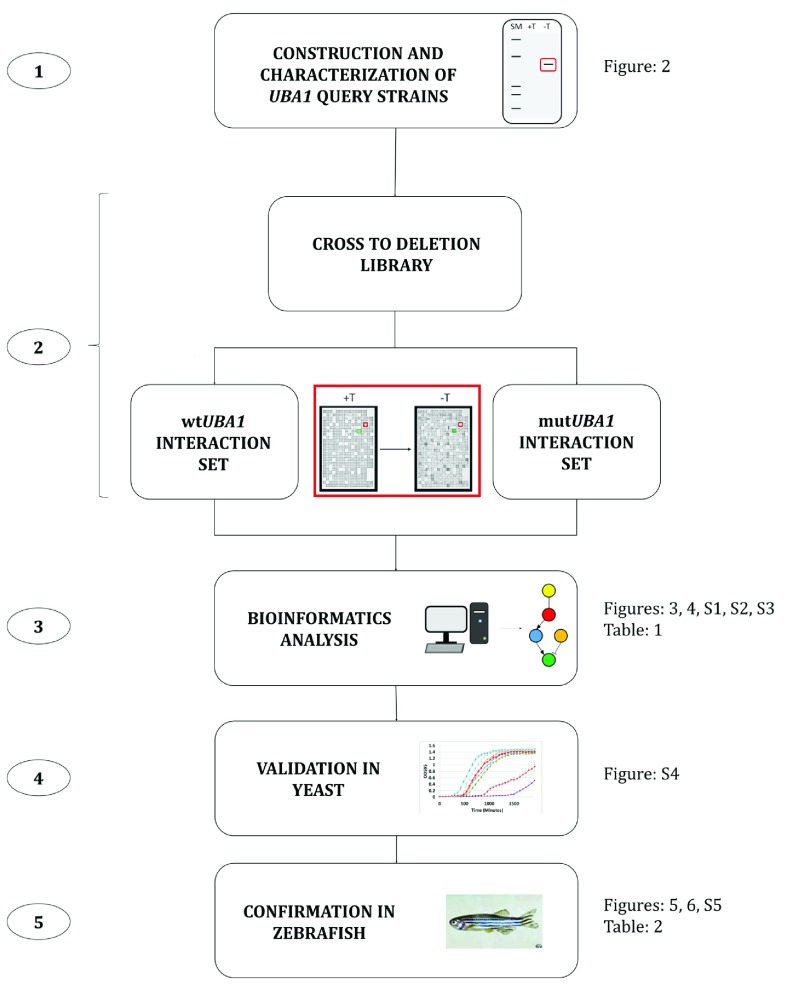
Our approach ( Figure 1) involves the expression of human disease associated genes in S. pombe and then the analysis of their effect on yeast fitness (growth). We performed high-throughput synthetic genetic array (SGA) screens to identify the fission yeast genetic modifiers that alter this effect, as measured by a simple yeast growth assay. The genetic modifiers are then assembled into human disease gene networks or clusters (using protein-protein interaction datasets from both S. pombe and humans). Any modifiers or genes in the networks or clusters represent potential therapeutic targets. This unbiased high-throughput approach could be widely and rapidly applied to many different disease-associated genes at relatively low cost.
Figure 1. YANA analysis of UBA1 genes. Numbers illustrate various steps in our analysis.
(1) Construction of query strains by integrating wildtype and mutant variants of the UBA1 gene into pombe. (2) Crossing the query strains (mutant or wildtype) to a complete non-essential deletion collection. (3) Bioinformatic analysis to generate the top ‘gene hits’. (4) Validation of the top hits in yeast. (5) Confirmation of the top hits in zebrafish.
To demonstrate the power of YANA, we considered spinal muscular atrophy, a common neurodegenerative disease affecting approximately 1/6000 births worldwide and the number one genetic cause of infantile death in the United States 12. Most cases (>90%) are caused by deletion of SMN1, a gene encoding the survival motor neuron (SMN), a protein involved in the assembly of spliceosomal small nuclear ribonuceoproteins (snRNPs) 13. In contrast, X-linked spinal muscular atrophy is caused by mutations in UBA1, a gene encoding the ubiquitin activating (UBA) enzyme 1, an E1 ubiquitin ligase 14, 15. Consistent with a role of ubiquitination in spinal muscular atrophy and SMN biology, it was recently shown that ubiquitin-mediated proteolysis regulates SMN stability 16, 17. Therefore, we systematically investigated the genetic network for UBA1 to better understand the potential connections between UBA1, its modifiers and the spinal muscular atrophy phenotype. Using YANA we identified several potential therapeutic targets and validated one of these targets in a SMA vertebrate (zebrafish) model.
Methods
Query Strain Creation
UBA1 was cloned into a pENTR/D-TOPO vector (Life Technologies, Cat # K2400-20) from cDNA (Origene, Cat. # SC320329) following the manufacturer’s protocols. The following primers were used: forward primer: 5′- CACCATGTCCAGCTCGCCGC-3′; reverse primer: 5′- TCAGCGGATGGTGTATCGGAC-3′. Genetic insertion was confirmed by sequencing ( http://sylvester.org/shared-resources/oncogenomics). UBA1 (G1617T), mut UBA1, was created by site directed mutagenesis using a QuikChange Lightning Site-Directed Mutagenesis kit (Agilent Technologies, Cat. # 210518; the detailed protocol is available in the kit). The primers used were: forward primer: 5′-GCAGCTGTGCGCCAAATTAATCCACATATCCGG-3′; reverse primer: 5′-CCGGATATGTGGATTAATTTGGCGCACAGCTGC-3′. LR Gateway reactions (Gateway Cloning Protocols: http://www.lifetechnologies.com/us/en/home/life-science/cloning/gateway-cloning/protocols.html#lr) were then performed to flip the UBA1 genes into destination vectors, to create N-terminal HA-tagged UBA1 under the control of the nmt1 promoter (LR Clonase II from Life Technologies, Cat # 11791020). The newly generated expression vectors were then integrated into an h - leu1-32 ura4-D18 Ade6-M210 S. pombe strain (PN572) to create a wt UBA1 query strain ( h - integrated pjk148-nmt1 3X-HA-UBA1-nmt1 term. leu1-32 ura4-D18 Ade6-M210) and a mut UBA1 query strain ( h - integrated pjk148-nmt1 3X-HA-UBA1(G1617T)-nmt1 term. leu1-32 ura4-D18 Ade6-M210). All media, growth conditions, and genetic manipulations were as previously described 18.
Western Blot and Growth Curves
Strains containing wt UBA1 and mut UBA1 were grown exponentially in PMG media (Sunrise Scientific Cat. #2060, keeping the OD 595 below 0.4) or eight generations at 32°C and then induced for expression of the HA-tagged wt UBA1 and mut UBA1 by washing the cells three times with sterile water to remove thiamine. Cells were then grown exponentially for 16 hours and then lysed using a FastPrep 120 bead beater (MP Biomedical), followed by boiling in sample buffer (2x Laemmli Sample Buffer, Bio-Rad Cat. #161-0737) and then clarified by centrifugation. The expression of UBA1 was confirmed by Western Blot analysis using an anti-HA antibody at 1:2000 dilution (Covance, Cat #MMS-101P, AB_10063488) and standard procedures 19. Growth curve analysis was completed in the presence and absence of thiamine (final concentration, 15 µM; Sigma, Cat. #T4625). Removal of thiamine was achieved by washing the cells three times with sterile water. Cells were incubated in the absence of thiamine for 22 hours under exponential growth, diluted and 120 µl added to the Tecan Infinity F200 plate readers (starting OD 595 of 0.05) for growth curve analysis with an n=5 for each sample. For validation experiments, cul3 and gsk3 were not pre-induced, while pub1 was pre-induced for 22 hours. The deletions of cul3, pub1, and gsk3 were confirmed by PCR analysis of genomic DNA from each strain, as previously described 20.
SGA screening
Query strains were grown in liquid media and then pinned to agar in a 384-format using a RoToR HDA (Singer Instruments). The query was then crossed to the S. pombe haploid deletion library (Bioneer, Version 3.0 equivalent) on SPAS media (details can be found at http://www-bcf.usc.edu/~forsburg/media.html) using a modified SGA procedure 21. For germination, four replicates of each cross were pinned to a 1536 format on selective PMG media containing thiamine, adenine (225 mg/L, Sigma Cat. #A8751), leucine (225 mg/L, Sigma Cat. #L8912), and the antibiotic G418 (150 µM, Gold Bio Cat. #G-1418) (PAUT+G418). After three days, the plates were then pinned to both PAUT+G418 (non-inducing) and PAU+G418 (inducing) plates. The colonies growing on the PAUT+G418 plates were documented on a flatbed scanner for the next three consecutive days. The PAU+G418 plates were grown for two days, and then re-pinned to fresh PAU+G418 plates and documented over the next three consecutive days. Based on the growth characteristics of the wt UBA1 strain, the plates were then pinned to fresh PAU+G418 plates and documented for an additional three days.
Hit analysis
The documented plates were analyzed for ‘Hits’ representing a growth defect (SL) or growth suppressor (SS) using ScreenMill software 22. The software is used to quantify colony size for each individual cross and then to normalize the quantified plates with and without replicate exclusion for each quadruplicate of the query crossed to a specific deletion strain. Data was then compared (between non-induced versus induced) and ranked in Excel (P≤0.05) (Microsoft). The orthologs were then identified based on curated data from PomBase ( www.pombase.org; build 2013-11-11-v1), OrthoMCL ( http://orthomcl.org/orthomcl/; Version 5), InParanoid8 ( http://inparanoid.sbc.su.se/cgi-bin/index.cgi; Version 8.0), and Homologene ( http://www.ncbi.nlm.nih.gov/homologene; build 67).
Bio-Informatics
The S. pombe and human ‘Hits’ were analyzed in String ( www.string-db.org) to map protein-protein interactions limited to data from experiments at the highest confidence level (0.900), and named pombe primary and human primary. The S. pombe primary was then extended by adding first degree neighbors to the original pombe ‘Hits’, keeping all interactions based on data from experiments at the highest confidence level (0.900). From the extended pombe network interaction map, new ‘Hits’ were extracted that corresponded to at least two previous ‘orphans’ (‘Hits’ that were not previously mapped) that interact through a nearest neighbor. All ‘Hits’ were then analyzed through PubMed ( http://www.ncbi.nlm.nih.gov/pubmed/) for relevance in terms of SMA, with special focus on the ‘Hits’ in the interaction maps.
Morpholino (MO) injection and drug test
Transgenic Tg(mnx1:0.6hsp70:GFP)os26 embryos that express GFP in ventrally projecting motor axons, referred to as Tg(mnx1:GFP) embryos, were used for all zebrafish experiments. Embryos were staged according to Fritz et al. 23 All fish were grown and maintained in the Ohio State University (OSU) zebrafish facility following established protocols and OSU animal welfare guidelines as stated in Dr. Beattie's animal protocol (On file at OSU: 2009A0141-R1). Tg(mnx1:GFP) embryos were injected with 4 ng smn MO at the one- to 2-cell stage to knock down Smn as previously described 24. At 10 hours post-fertilization (hpf) injected embryos (in their chorions) were placed in Petri dishes in fish water (60 µg/ml Instant Ocean ® sea salts) containing compounds in 0.75% dimethyl sulfoxide (DMSO) or 0.75% DMSO only and incubated at 28.5°C in incubator until 28 hpf.
Tg(mnx1:GFP) embryos at 28 hpf were anesthetized with tricaine (250 µg/ml, Sigma A-5040) and fixed overnight at 4°C in 4% formaldehyde/PBS. After removing embryos from fix, they were mounted on glass coverslips for observation under a Zeiss Axioplan microscope. Motor axons innervating the mid-trunk (myotomes 6–15) on both sides of the fish were scored as described 25.
The control topped b458 embryos were treated and fixed as described above for Tg(mnx1:GFP) embryos; the topped mutants, however, were processed for znp1 antibody (Hybridoma Bank Cat#znp-1, AB_531910) labeling as previously described 26 to visualize motor axons for scoring as they did not have the Tg(mnx1:GFP) in the background.
Zebrafish western blot
Samples of zebrafish embryos injected with 4 ng smn MO at the one- to two-cell stage and uninjected embryos were treated from 10 to 28 hpf with DMSO or with DMSO and compounds as described above were collected for western blot.
Samples were generated by boiling 25 identically treated embryos in 75 µl blending buffer (63 mM Tris (pH 6.8), 5 mM EDTA, 10% SDS). 10 µl (equivalent to 3 embryos or 75 µg of protein) were added to 10 µl of sample buffer (100 mM Tris (pH 6.8), 0.2% bromophenol blue, 20% glycerol, 200 mM dithiothreitol) and run on a 10% polyacrylamide gel, blotted to nitrocellulose, probed with mouse anti-Smn (1/500; MANSMA12, a gift from Dr. G.E. Morris or anti HuD (1/1000; Santa Cruz Cat#sc-28299, AB_627765) and detected by chemiluminescence of bound HRP-conjugated mouse antibody. Blots were stripped and re-probed with mouse anti-β-actin (1/1000; Santa Cruz Cat #sc-47778, AB_626632).
Results
We expressed the human wildtype UBA1 (wt UBA1) and the disease-causing variant 1617 UBA1 (mutUBA1) in S. pombe under the control of a regulatable nmt1 promoter 27. We identified strains with stable integrated human UBA1 genes expressing equivalent levels of UBA1 proteins ( Figure 2A). Under non-inducing conditions (+ thiamine) all UBA1-containing strains had a similar growth rate to the control non- UBA1-containing wildtype strain ( Figure 2B). We then found that cells expressing human wt UBA1 (fission yeast cells grown in media lacking thiamine to induce UBA1 expression), experienced a decrease in cell growth. No growth defect was observed for yeast cells expressing mut UBA1 when compared to the control ( Figure 2B).
Figure 2. Construction of S. pombe strains integrated with human UBA1.
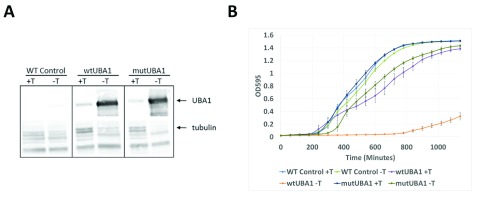
Wildtype and mutant forms of UBA1 were integrated into fission yeast under the control of the nmt1 thiamine-repressible promoter. ( A) Western blot analysis of protein expression levels shows that both forms of UBA1 (wildtype and mutant) are expressed to equivalent levels. ( B) Expression of wild-type UBA1 inhibits S. pombe cell growth.
We set out to identify yeast gene mutations that either enhance or suppress cell growth dependent upon expression of either wt or mut UBA1 (i.e., epistatic modifiers). We used automated genetics to introduce the wt and mut UBA1 genes into a deletion strain collection corresponding to more than 90% of the non-essential genes in S. pombe (ca. 80% of the complete genome). We then tested each of the >7000 unique strains expressing either wt or mut UBA1 combined with a specific gene deletion, for growth properties. Each strain was scored for significance of growth difference compared to a control, and the top hits (P<0.05) were assembled into a database ( Table 1). The categories of growth phenotypes were those that were synthetic lethal for wildtype or mutant (wt-SL, or mut-SL) or synthetically suppressed for wildtype or mutant (wt-SS, or mut-SS). We identified 173 UBA1 or mutUBA1 modifiers. Notably, 145 of the modifiers (83.8%) were orthologous to human genes, and thus are potential drug targets to modify the SMA phenotype.
Table 1. S. pombe SGA top hits.
The tops hits for wtUBA1 SL, wtUBA1 SS, mutUBA1 SL, and mutUBA1 SS were identified by bioinformatic analysis as described in the materials and methods section.
| wtUBA1 SL | wtUBA1 SS | mutUBA1 SL | mutUBA1 SS | |
|---|---|---|---|---|
| 1 | SPAC24H6.03 | SPBC365.06 | SPBC8D2.01 | SPAC11G7.02 |
| 2 | SPAC1687.15 | SPAC11G7.02 | SPBC6B1.10 | SPCC13B11.01 |
| 3 | SPAC3G9.07c | SPCC31H12.05c | SPBC216.05 | SPBC2G2.03c |
| 4 | SPBC6B1.10 | SPBC31F10.13c | SPCC1795.01c | SPBC31F10.13c |
| 5 | SPAPYUG7.04c | SPCC1620.14c | SPBC24C6.11 | SPCC1620.14c |
| 6 | SPBC24C6.11 | SPAC57A10.02 | SPBC1734.08 | SPAC3G6.02 |
| 7 | SPBC1734.08 | SPAC1556.01c | SPAC9.13c | SPAC1556.01c |
| 8 | SPAC23D3.09 | SPAC30D11.13 | SPAC23D3.09 | SPAC821.05 |
| 9 | SPAC17A5.11 | SPCC970.07c | SPAC57A10.02 | SPBC6B1.04 |
| 10 | SPAC16A10.05c | SPAC23H4.12 | SPAC16A10.05c | SPCC1919.15 |
| 11 | SPCP1E11.07c | SPCC11E10.08 | SPCC895.07 | SPBC23E6.09 |
| 12 | SPBC146.13c | SPBC21D10.12 | SPCP31B10.05 | SPBC21D10.11c |
| 13 | SPAC821.09 | SPCC1672.06c | SPCC550.12 | SPAC22H10.07 |
| 14 | SPBC23E6.09 | SPAC3C7.03c | SPAC23H4.12 | SPCC338.08 |
| 15 | SPCC1682.16 | SPBC32F12.02 | SPBC11C11.02 | SPBP35G2.08c |
| 16 | SPBC106.01 | SPCC736.04c | SPBC1289.11 | SPBC29A3.14c |
| 17 | SPCC622.16c | SPBC30D10.13c | SPCC126.02c | SPAC29A4.18 |
| 18 | SPAC22H10.07 | SPCC737.09c | SPBC13G1.13 | SPBC1921.03c |
| 19 | SPBC13G1.13 | SPBC56F2.01 | SPCC188.13c | SPBC2F12.11c |
| 20 | SPBC16H5.06 | SPBC2F12.11c | SPCC663.12 | SPAPB1E7.02c |
| 21 | SPBC29A10.05 | SPBC16A3.07c | SPCC338.05c | SPAC17A5.16 |
| 22 | SPBC28F2.07 | SPAC5D6.05 | SPAC343.11c | SPAC20H4.03c |
| 23 | SPCC1827.08c | SPAC18G6.02c | SPCC1919.03c | SPCC1259.03 |
| 24 | SPAC9G1.10c | SPAC19D5.01 | SPAC343.18 | SPAC18G6.02c |
| 25 | SPBC83.03c | SPAC688.11 | SPCC737.09c | SPAPB1E7.06c |
| 26 | SPBC342.04 | SPAC227.07c | SPBC106.16 | SPAC1851.04c |
| 27 | SPCC4G3.19 | SPAC1851.04c | SPAC3A11.14c | SPAC13G7.06 |
| 28 | SPAC9G1.05 | SPBC16H5.07c | SPAC589.02c | SPBC725.11c |
| 29 | SPCC4E9.02 | SPAC17A5.18c | SPCC1450.05c | SPCC1739.12 |
| 30 | SPCC794.11c | SPBC725.11c | SPAC8F11.03 | SPCC663.01c |
| 31 | SPBC216.06c | SPAC23C11.08 | SPAC13A11.04c | SPBC21C3.02c |
| 32 | SPCC1450.05c | SPBC3B8.02 | SPAC1952.07 | SPAC1F7.09c |
| 33 | SPAC22A12.16 | SPBC17D1.06 | SPAC14C4.03 | SPBC365.11 |
| 34 | SPAC12B10.07 | SPAC11E3.06 | SPAC19G12.06c | SPAC144.04c |
| 35 | SPAC4A8.05c | SPCC663.01c | SPAC2F7.04 | SPCC4F11.03c |
| 36 | SPAC1B9.02c | SPAC167.04 | SPAC1006.09 | SPAC4G8.03c |
| 37 | SPAC16C9.05 | SPAC14C4.12c | SPAC17G6.04c | SPBP8B7.06 |
| 38 | SPAC23H3.08c | SPBC2A9.06c | SPAC22H12.02 | SPCC1223.05c |
| 39 | SPAC2F7.04 | SPAC24H6.13 | SPBC725.02 | SPAC1556.05c |
| 40 | SPAC22H12.02 | SPAPB1A10.03 | SPAC140.01 | SPBC16C6.03c |
| 41 | SPBC725.02 | SPAC12G12.03 | SPAC1805.04 | SPBC2G2.07c |
| 42 | SPAC21E11.03c | SPCC663.03 | SPBC1709.10c | SPAC31G5.12c |
| 43 | SPBC12C2.02c | SPBC1539.10 | SPBC577.15c | SPAC4G9.15 |
| 44 | SPBC21B10.13c | SPCC1223.05c | SPAC1420.03 | SPAC25B8.05 |
| 45 | SPAC1687.13c | SPCC31H12.04c | SPBC29A10.03c | SPAC1071.07c |
| 46 | SPBC3F6.05 | SPCC1739.08c | SPAC4F10.04 | |
| 47 | SPBC4B4.03 | SPAC2C4.07c | SPAPB1E7.12 | |
| 48 | SPAC222.16c | SPAC1142.08 | SPCC320.08 | |
| 49 | SPAC4F10.04 | SPCC830.07c | ||
| 50 | SPAC19B12.10 | SPAC4G9.05 | ||
| 51 | SPBC2G2.02 | SPBC13G1.14c | ||
| 52 | SPAC1834.04 | SPCC24B10.08c | ||
| 53 | SPAPB1E7.12 | SPAC4H3.03c | ||
| 54 | SPCC320.08 | SPAC1805.05 | ||
| 55 | SPCC830.07c | |||
| 56 | SPAC4G9.05 | |||
| 57 | SPBC13G1.14c |
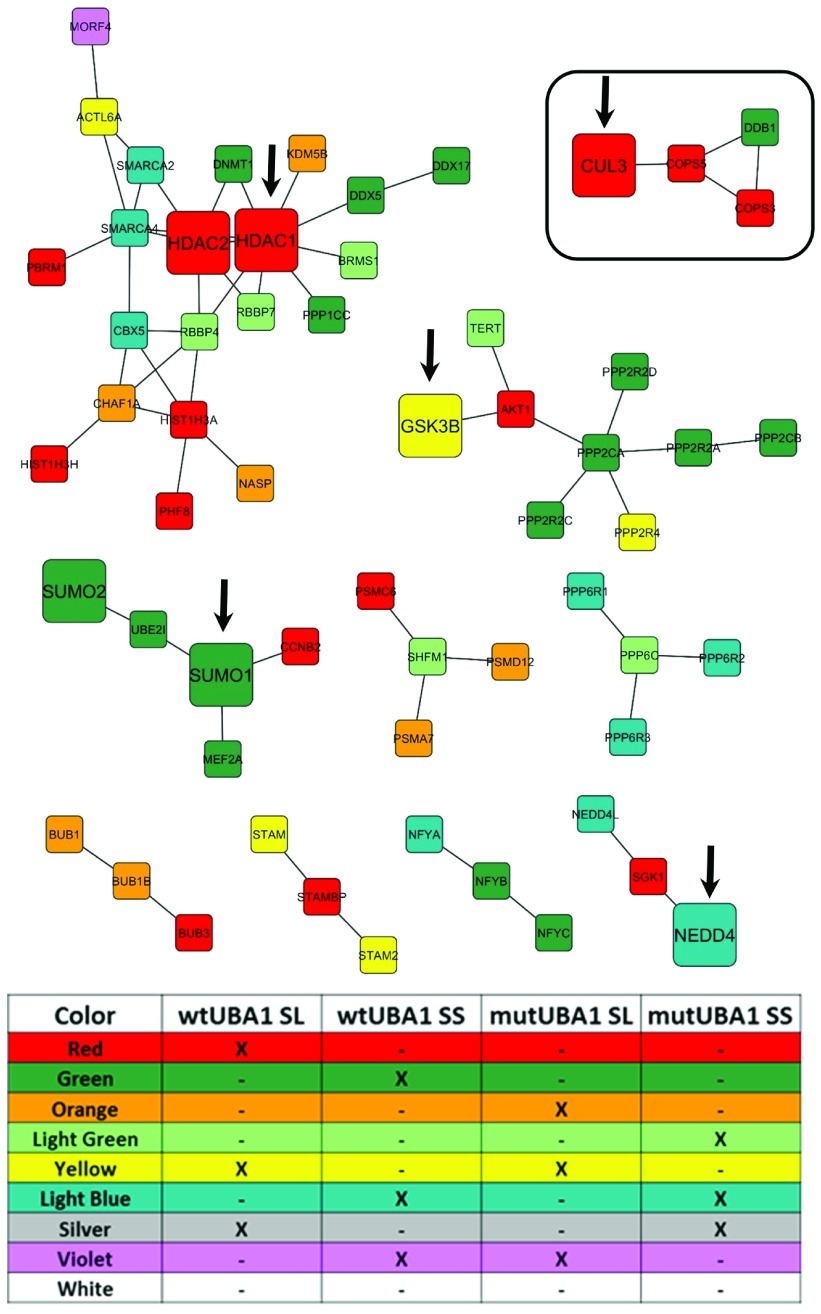
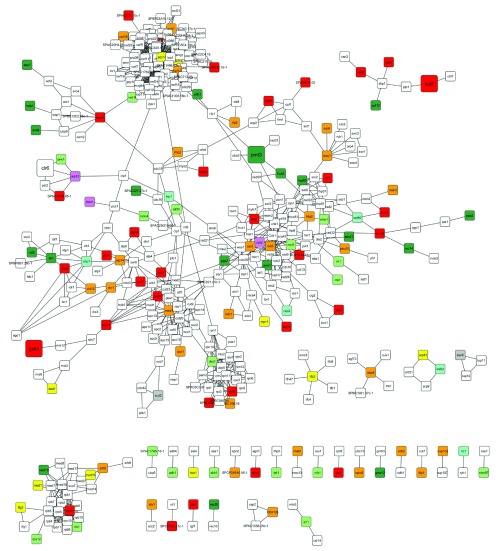
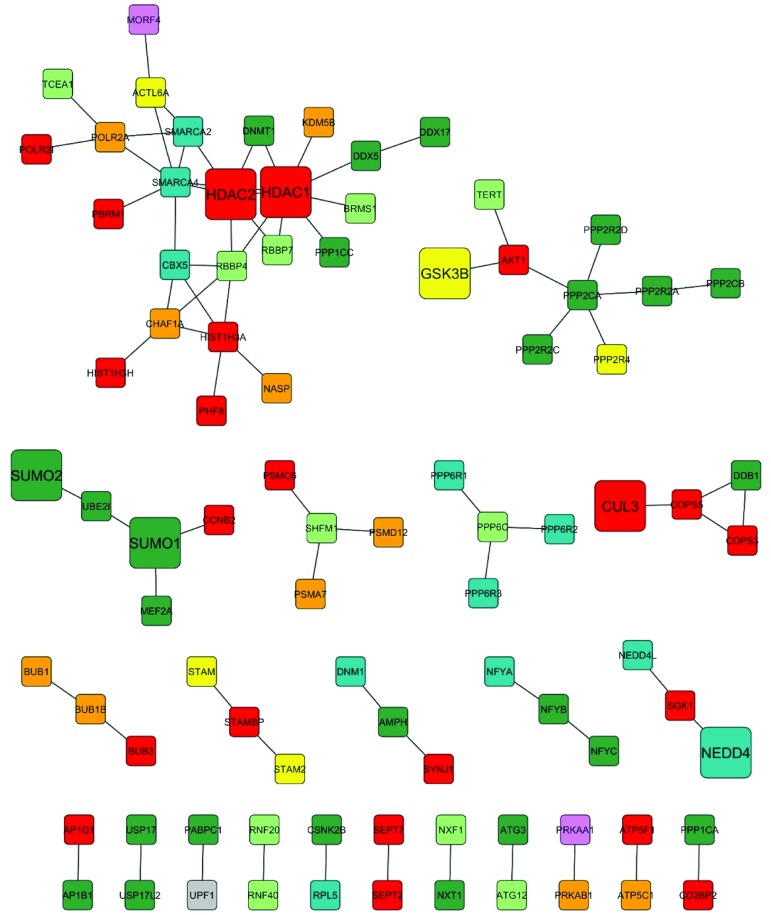
To generate our candidate human disease gene networks (that we shall call network clusters) we relied on two complementary approaches. Both approaches rely on networks constructed from published protein-protein interaction data from either human ( Figure 3 and Figure S3) or fission yeast ( Figure 4, Figure S1 and Figure S2). By including two types of genetic interactions, synthetic lethals or synthetic suppressors, yeast augmented network analysis (YANA), yields the most complete unbiased list of potential modifiers. In a first approach, we converted all 145 S. pombe modifier genes to their corresponding human orthologs. All the data were combined to create network cluster diagrams. Individual datasets were delineated using a color key. (Note that we designate each interaction as a synthetic lethal or synthetic suppressor a priori, and include them both as it is difficult to predict which of these classes will have potential therapeutic value). Using the highest confidence (0.9) experimentally confirmed protein-protein interaction data (from www.string-db.org), we used cytoscape to draw network cluster modules that include all modifier genes. We identified 22 clusters using this approach ( Figure S3). We then limited the number of networks by focusing on those modifiers that shared at least two interactions with other modifiers shrinking the number of clusters to 10 ( Figure 3). Within our human primary network clusters, we identified several genes that represent compelling therapeutic targets. These included GSK3 (Glycogen Synthase Kinase-3), CUL3 (Cullin-3) and NEDD4 (E3 ubiquitin ligase) along with SUMO1 (Small Ubiquitin Modifier-1) and HDAC (Histon deacetylase), a known chromatin modifier. Interestingly, GSK3 inhibitors increase SMN levels in spinal muscular atrophy patient-derived fibroblasts and mouse motor neurons 28. The HDAC inhibitor Trichostatin A increases SMN expression and survival in a mouse model of spinal muscular atrophy 29. Therefore, evidence already exists that genes within our clusters affect SMA biology.
Figure 3. Human UBA1 primary gene interaction network.
Human orthologs of yeast genes identified from four independent SGA screens were used to map the corresponding protein-protein interaction network. Only proteins that have experimentally verified data (STRING) supporting a physical interaction with at least two additional genes/proteins identified in the UBA1-SGA screens are displayed. Of particular interest is the discovery of NEDD4, CUL3, GSK3, SUMO and HDAC in distinct network clusters. Proteins of interest are highlighted by a larger node size and indicated with an arrow.
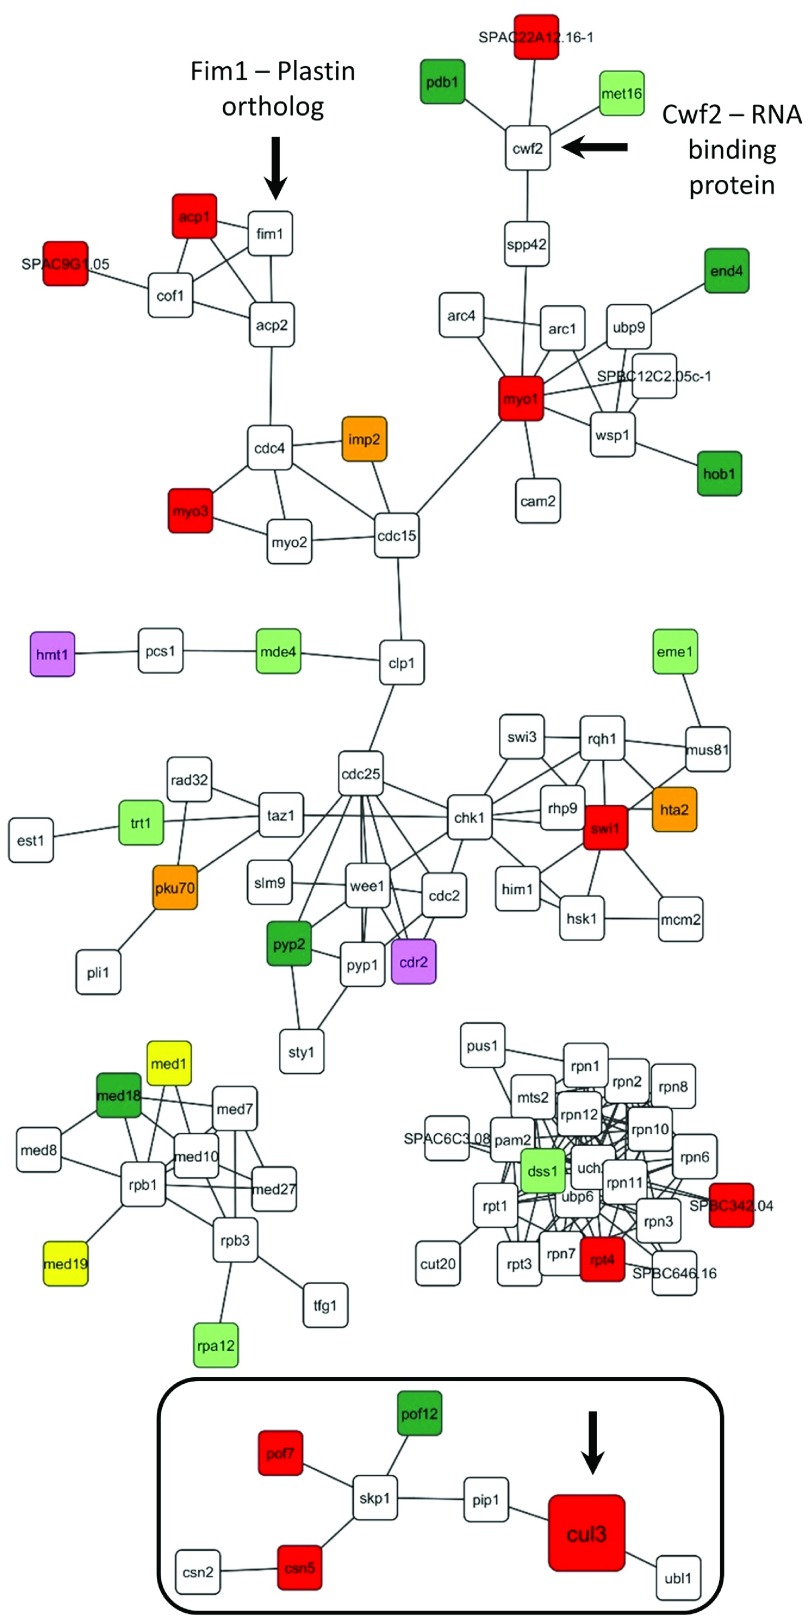
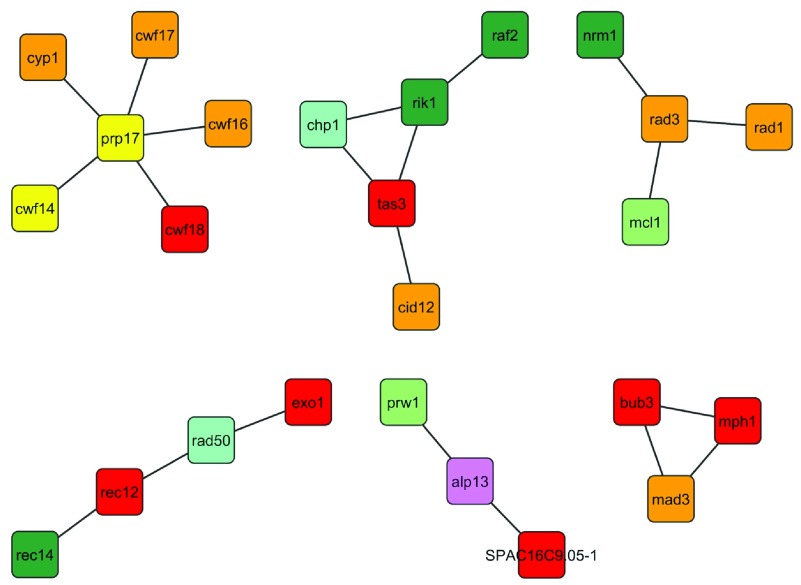
Figure 4. S. pombe extended UBA1 gene interaction network (extracted from Figure S1 on the basis of identifying new primary hit interactions through a 1° neighbor).
Primary yeast gene hits from all four SGA screens were combined and mapped based on highest confidence experimentally confirmed protein-protein interaction data. For this extended analysis, we also included first-degree neighbors of modifiers that were not directly identified in the SGA screens. Only selected gene clusters are shown here; the complete extended network is shown in Figure S1. When extrapolated to human, the yeast extended network analysis identified Csn5 and Cul3, two modifiers also identified in our human UBA1 primary gene interaction network (boxed; see also Figure 3).
In our second approach, we constructed networks from just the S. pombe modifier genes using high confidence S. pombe protein-protein interaction data from STRING. For this analysis, we identified network clusters that were expanded to include all the so-called “first-degree (1°) interacting proteins”, proteins not identified in our SGA screens but that physically interact with a genetically identified modifier ( Figure S1). The rationale underlying our approach to generate larger clusters comes from the facts that the 1° neighbor may be an essential gene (and therefore it is not present in our deletion library) or may fail to be detected in our screens for other, unknown reasons. This “Cluster with 1° neighbor” analysis reveals new interactions not observed in the yeast primary UBA1 gene interaction network ( Figure S2). A few examples of these types of clusters are shown in Figure 4. The clusters include several genes all of which were uniquely identified in the wildtype screen, including both synthetic lethals and synthetic suppressors. Of particular interest is the cluster of proteins surrounding Skp1(S-phase kinase associated protein-1), a protein that interacts and stablilizes F-box proteins, additional F-box proteins, and proteins involved in cullin deneddylation and neddylation. In addition, we found that the RNA-binding protein Cwf2 interacts directly with three of our modifiers, and the plastin ortholog Fim1, interacts with two. Interestingly, Plastin 3 (PLS3) has been identified as a disease modifier in animal models of spinal muscular atrophy 30– 32.
We then identified correlations between the extended S. pombe network clusters ( Figure 4) and the human primary network clusters ( Figure 3). In both networks, we identified components of the COPS complex, a known regulator of E3 cullins, and the E3 cullin Cul3. Note that Cul3 was not present in our primary S. pombe network ( Figure S2) yet was present in the more extended network clusters that incorporate 1° neighbors; this illustrates the importance of adding 1° neighbors to our analysis of the S. pombe data.
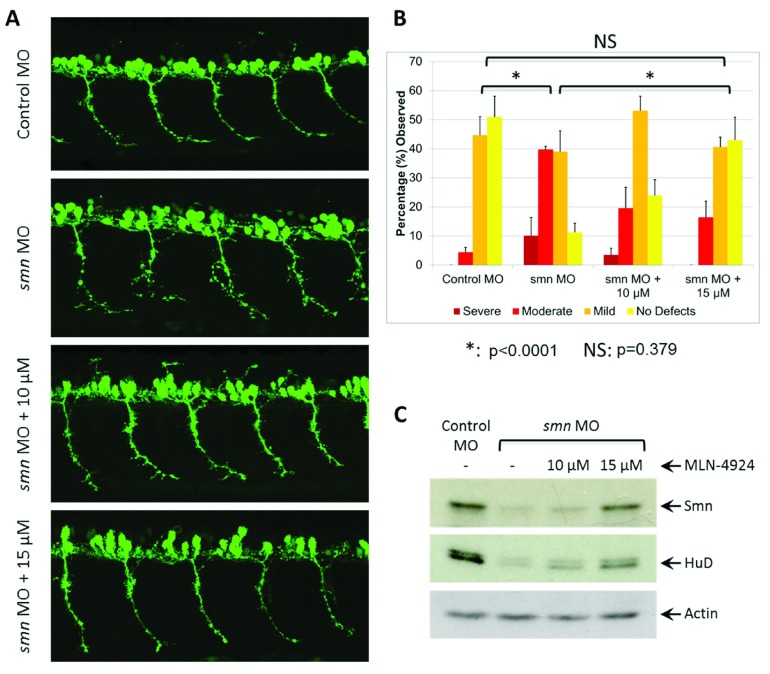
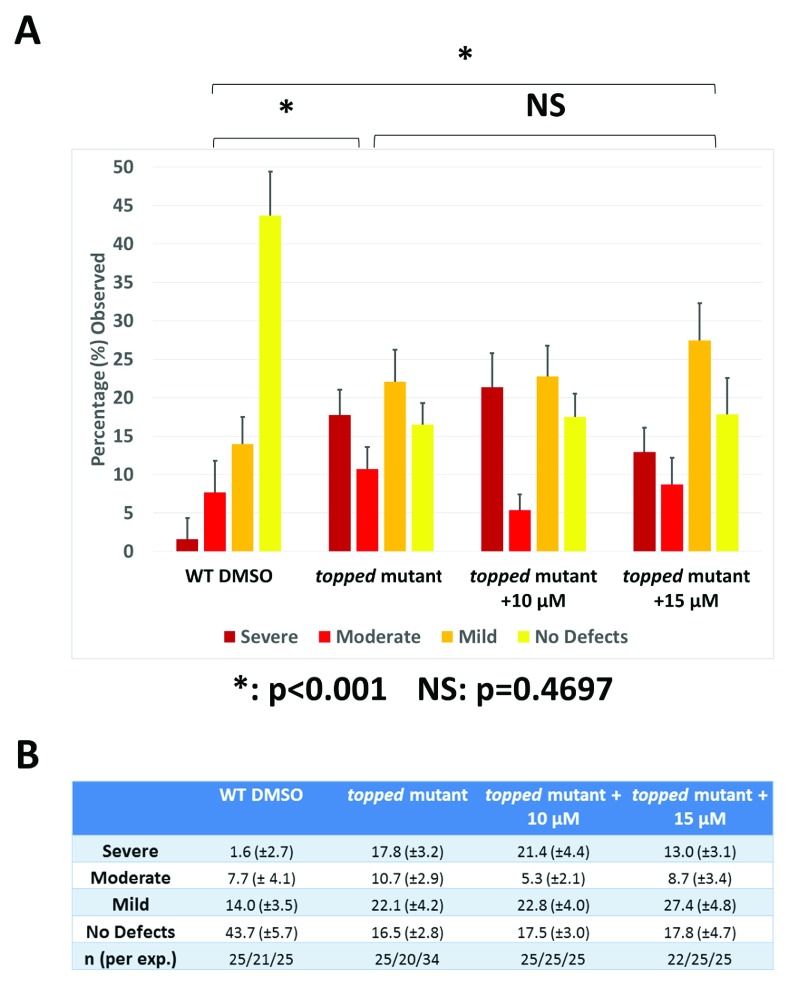
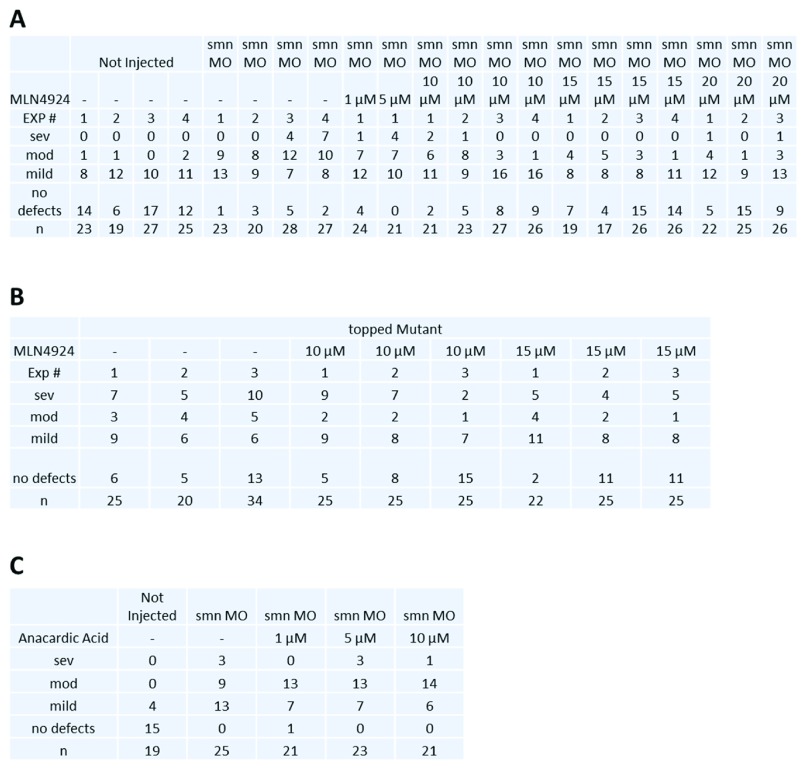
Together, these data suggest a prominent role for E3 ubiquitin ligases in modulating UBA1 and potentially SMN1, making Cul3 the primary target for further analysis. The E3 ubiquitin ligase might inhibit SMN function, as ubiquitination often leads to protein degradation. If so, we reasoned that inhibition of E3 ubiquitin ligase might enhance SMN activity and thus suppress loss of function mutations in SMN1. To directly test the hypothesis that inhibition of E3 ubiquitin ligases can suppress a SMN1-spinal muscular atrophy phenotype, we turned to a vertebrate model of SMN deficiency previously reported in zebrafish 33. Knockdown of Smn in zebrafish embryos causes developmental defects in motor neuron axonal outgrowth that include truncations and abnormal branching of neurons 24. Motor neuron axon defects can be corrected by injection of mRNAs encoding wildtype human SMN 25. We first confirmed that injection of smn morpholino (MO) into wildtype zebrafish causes severe motor axon abnormalities as compared to control uninjected embryos ( Figure 5A and 5B). We then tested whether an inhibitor of E3 ubiquitin ligases (MLN4294) would suppress the motor axon abnormalities. Addition of the Nedd8-E1 activating enzyme inhibitor MLN4294 (that blocks cullin-RING E3 ligases), at concentrations ranging from 10 µM to 15 µM, caused a concentration-dependent reduction in the degree of abnormal motor axon branching ( Figure 5A and 5B). At 15 µM inhibitor we found motor axon abnormalities that were completely suppressed: defects were not significantly different to those observed in uninjected embryos (P=0.379). At higher concentrations of drug (20 µM), the rescue was less pronounced ( Table 2) probably because higher levels of drug led to defects in development. Thus, E3 ligase inhibition can rescue neuronal defects caused by Smn protein depletion in zebrafish. In control experiments, MLN4294 failed to rescue the zebrafish mutant topped ( Figure 6), a mutant defective in neuronal axon guidance 34. We also tested a drug that inhibits sumolyation corresponding to an unrelated target (SUMO) identified in our human primary network clusters ( Figure 3); addition of this compound had no effect on the spinal muscular atrophy model ( Figure S6) necessarily surprising since pmt3, which encodes the yeast ortholog of SUMO1, has the opposite effect of cul3 when deleted. Having been identified as a synthetic suppressor rather than a synthetic lethal, perhaps compounds that activate rather than inhibit sumolyation would be beneficial as a therapeutic.
Figure 5. MLN4294 rescues the abnormal neuron outgrowth in Smn-depleted zebrafish.
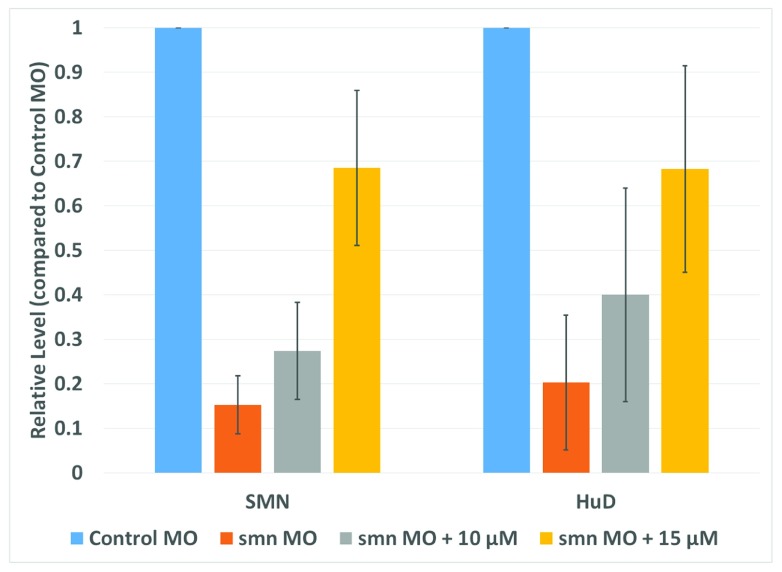
( A) Representative lateral views of motor axons in Tg( mnx1:GFP) zebrafish embryos expressing GFP in motor neurons and injected with control MO and then grown in 10 or 15 µM MLN4294. ( B) Quantification of the effects of MLN4294 on motor axon development in zebrafish. Motor axons were scored in Tg( mnx1:GFP) embryos injected with control MO, and subsequently (10 hrs post-injection) incubated in 10 or 15 µM MLN4294. Embryos were classified as severe, moderate, mild, or no defects based on the severity of motor axon defects, and the percentage of each group is shown. Data in all graphs are represented as mean and SEM. ( C) Western blot analysis of Smn and HuD protein following treatment with MLN4294. Quantification of the results is shown in Figure S5.
Figure 6. Treatment of zebrafish with MLN4294 fails to rescue defects in ventral motor axon guidance in the topped mutant.
( A) Quantification of the effects of MLN4294 on motor axon guidance in the zebrafish topped mutant. Motor axons were scored in embryos injected with DMSO, 10 or 15 µM MLN4294. Embryos were classified as severe, moderate, mild, or no defects based on the severity of motor axon defects, and the percentage of each group is shown. Data in all graphs are represented as mean and SEM. ( B) Experimental data.
Table 2. Complete dataset for zebrafish experiments.
| Control MO | smn MO | smn MO + 10 µM | smn MO + 15 µM | smn MO + 20 µM | |
|---|---|---|---|---|---|
| Severe | 0 (± 0) | 10.1 (± 6.3) | 3.5 (± 2.3) | 0 (± 0) | 2.8 (± 2.4) |
| Moderate | 4.4 (± 1.7) | 39.7 (± 1.2) | 19.6 (± 7.2) | 16.4 (± 5.6) | 11.3 (± 7.1) |
| Mild | 44.7 (± 6.4) | 39 (± 7.2) | 53.1 (± 5) | 40.6 (± 3.4) | 46.8 (± 9.6) |
| No Defects | 50.9 (± 7.2) | 11.2 (± 3.2) | 23.9 (± 5.5) | 43 (± 7.9) | 39.1 (± 19) |
| n (per exp) | 23/19/27/25 | 23/20/28/27 | 21/23/27/26 | 19/17/26/26 | 22/25/26 |
To determine how E3 ubiquitin ligases might influence Smn1 function, we examined the protein levels for both Smn and HuD. HuD is a known SMN interacting protein that binds RNAs controlling their translation and stability and functions in neural development and plasticity 34– 36. We observed greater than a 2-fold increase in both Smn and Hud protein levels following treatment with MLN4294, a NEDD8 activating enzyme (NAE) inhibitor that prevents activation of E3 ligases ( Figure 5C and Figure S5). It is therefore possible that rescue of the neuronal defects in our zebrafish model might involve stabilization of Smn as well as of additional proteins within the Smn network.
UBA1 was expressed in S. pombe under inducing (- thiamine) and non-inducing conditions (+ thiamine) in wildtype strains (wtUBA1) and the disease-causing variant wildtype 1617UBA1 (mutUBA1), under the control of a regulatable nmt1 promoter. Growth rate data of expression of UBA1 under inducing (- thiamine) and non-inducing conditions (+ thiamine) in wtUBA1 and mutUBA1 are shown. For each condition there are six replicates.
Discussion
In this paper we introduce YANA, a fission yeast genetic assay that that when applied to a specific human disease gene can leverage protein-protein interaction data to characterize human disease networks. From these networks, we can identify and prioritize genetic pathways likely to modify the disease-associated gene activity, and predict those genes that can be exploited as therapeutic targets. Using UBA1, a gene associated with X-linked spinal muscular atrophy (XL-SMA), we found a high degree of homology between our yeast modifiers and their corresponding human genes (>80%), underscoring the extensibility of the assay. Specifically, we identified several network clusters and high priority targets for therapeutic intervention, including GSK3 and HDAC both of which are potential therapeutic targets for SMA. In addition, we found two novel related targets Cul3 (a cullin required for E3 ubiquitin ligase activity) and NEDD4, an E3 ubiquitin ligase.
Our yeast system, with its small but complex eukaryotic genome, and complete deletion library, is unique in allowing unbiased genome-wide screening of deletions that alter human disease gene activity. Moreover, YANA can be applied to any human gene, regardless of the phenotype or availability of endogenous mutations. The number of candidate genes identified by YANA for UBA1 represents a fraction of the approximately 30,000 genes in the human genome, providing a significant enrichment of potential modifiers. Therefore, YANA offers a simple, cost-effective, and relatively rapid technology that could be applied to all human genetic diseases.
Data availability
F1000Research: Dataset 1. Growth rate data of expression of UBA1 in S. pombe, 10.5256/f1000research.4188.d28505 37.
Acknowledgements
We thank Christian Romero for his expert technical assistance. Special thanks to W. Burhans, C. Boone, B. Andrews, M. Constanzo, C. Myers, C. Nislow, L. Hartwell, J. Dallman, and P. Goldschmidt for their encouragement and discussions during the early phase of these studies.
Funding Statement
This work was supported by a grant from the Muscular Dystrophy Association (MDA186435). (Christine Beattie grant support RO1NS050414 (C.E.B.) with additional support from P30NS045758).
The funders had no role in study design, data collection and analysis, decision to publish, or preparation of the manuscript.
v1; ref status: indexed
Supplementary materials
Figure S1. S. pombe extended UBA1 interaction network (complete).
The full protein-protein interaction network including first-degree neighbors for all fission yeast gene modifiers identified from our two independent SGA screens.
Figure S2. S. pombe UBA1 primary gene interaction network.
Fission yeast epistatic modifiers from all four SGA datasets were combined and used to map a protein-protein interaction network using the highest confidence protein interaction data (STRING-db).
Figure S3. Complete human UBA1 primary gene interaction network representing 22 clusters.
Human orthologs of yeast genes identified from four independent SGA screens were used to map the corresponding protein-protein interaction network.
Figure S4. Validation of SGA data for cul3, pub1 and gsk3.
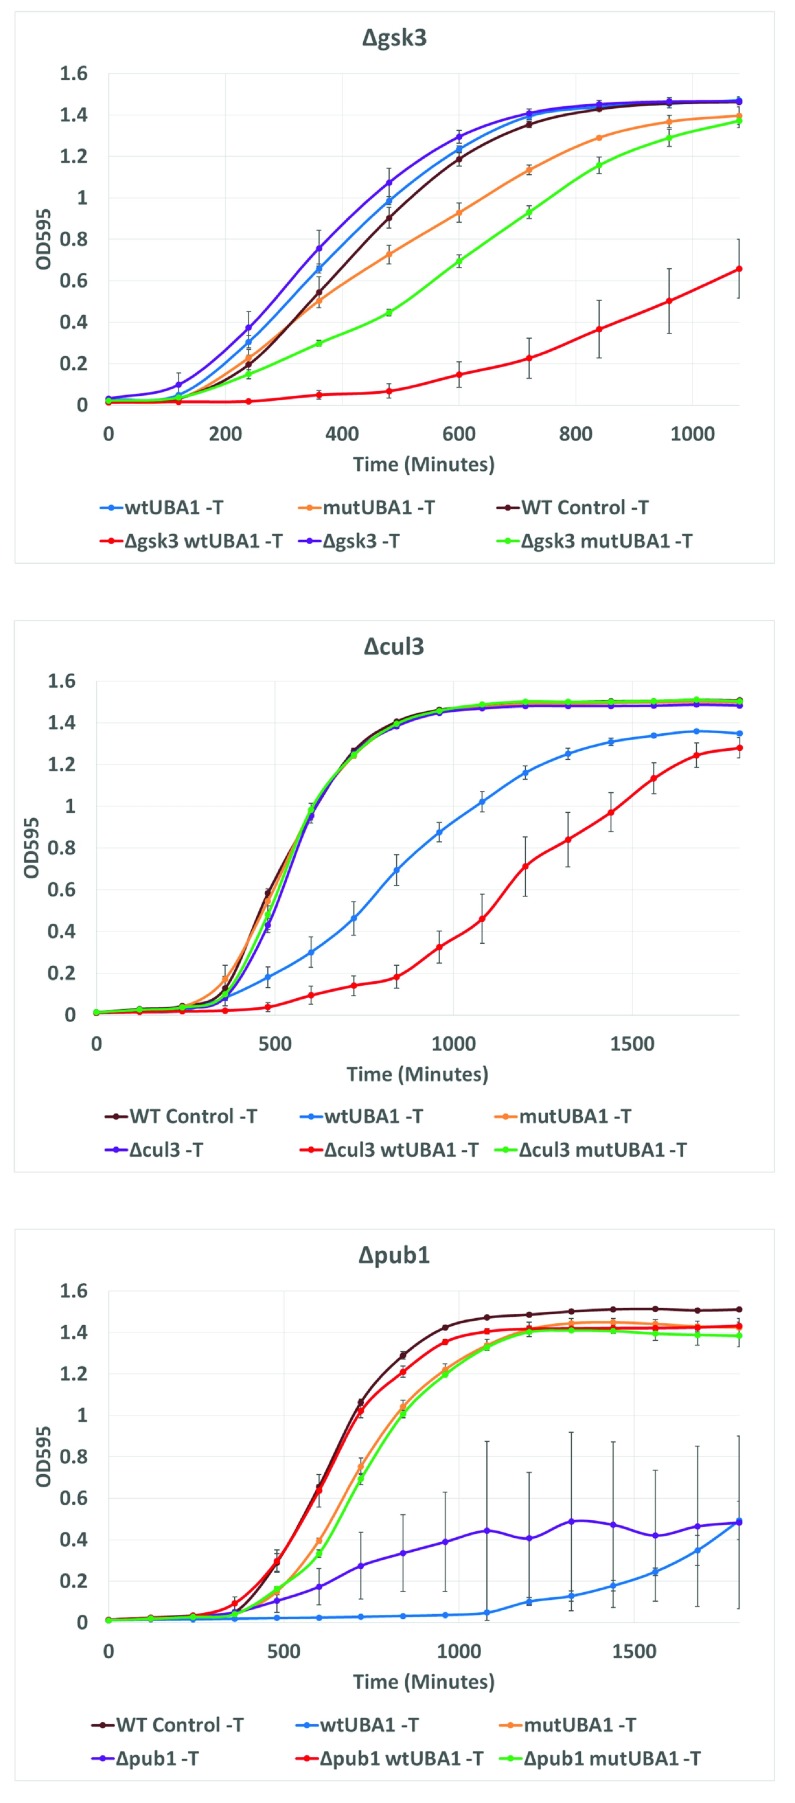
Growth curves of the 3 double mutants confirmed our original SGA data showing that the deletions of cul3 and gsk3 are synthetically lethal with OE of UBA1, and the deletion of pub1 ( NEDD4) suppresses the toxicity associated with OE of wildtype UBA1. For gsk3 and cul3, the cells were washed to remove thiamine and immediately placed in the plate reader whilst for pub1, cells were first pre-induced for 22 hrs. Deletions of cul3, pub1, and gsk3 were confirmed by PCR.
Figure S5. Expression of Smn and HuD in zebrafish embryos.
Quantification of western blot results shown in Figure 5C. Treatment of zebrafish embryos with MLN4294 results in approximately a 3-fold increase in both Smn and HuD levels 18 hrs following treatment.
Figure S6. Zebrafish raw data.
A) MLN4924 treatment in smn MO zebrafish. B) MLN4924 treatment in topped mutant zebrafish. C) Anacardic acid treatment in smn MO zebrafish.
References
- 1.Barabasi AL, Gulbahce N, Loscalzo J: Network medicine: a network-based approach to human disease. Nat Rev Genet. 2011;12(1):56–68 10.1038/nrg2918 [DOI] [PMC free article] [PubMed] [Google Scholar]
- 2.Maxwell CA, Benítez J, Gómez-Baldó L, et al. : Interplay between BRCA1 and RHAMM regulates epithelial apicobasal polarization and may influence risk of breast cancer. PLoS Biol. 2011;9(11):e1001199 10.1371/journal.pbio.1001199 [DOI] [PMC free article] [PubMed] [Google Scholar]
- 3.Pujana MA, Han JD, Starita LM, et al. : Network modeling links breast cancer susceptibility and centrosome dysfunction. Nat Genet. 2007;39(11):1338–1349 10.1038/ng.2007.2 [DOI] [PubMed] [Google Scholar]
- 4.Masoudi-Nejad A, Mousavian Z, Bozorgmehr JH: Drug-Target and disease networks: polypharmacology in the post-genomic era. In Silico Pharmacology. 2013;1:17 10.1186/2193-9616-1-17 [DOI] [PMC free article] [PubMed] [Google Scholar]
- 5.Zheng H, Fridkin M, Youdim M: From single target to multitarget/network therapeutics in Alzheimer’s therapy. Pharmaceuticals (Basel). 2014;7(2):113–135 10.3390/ph7020113 [DOI] [PMC free article] [PubMed] [Google Scholar]
- 6.Vitali F, Mulas F, Marini P, et al. : Network-based target ranking for polypharmacological therapies. AMIA Jt Summits Transl Sci Proc. 2013;2013:168 10.1016/j.jbi.2013.06.015 [DOI] [PubMed] [Google Scholar]
- 7.McGary KL, Park TJ, Woods JO, et al. : Systematic discovery of nonobvious human disease models through orthologous phenotypes. Proc Natl Acad Sci U S A. 2010;107(14):6544–6549 10.1073/pnas.0910200107 [DOI] [PMC free article] [PubMed] [Google Scholar]
- 8.Shubin N, Tabin C, Carroll S: Deep homology and the origins of evolutionary novelty. Nature. 2009;457(7231):818–823 10.1038/nature07891 [DOI] [PubMed] [Google Scholar]
- 9.Shubin N, Tabin C, Carroll S: Fossils, genes and the evolution of animal limbs. Nature. 1997;388(6643):639–648 10.1038/41710 [DOI] [PubMed] [Google Scholar]
- 10.Costanzo M, Baryshnikova A, Bellay J, et al. : The genetic landscape of a cell. Science. 2010;327(5964):425–431 10.1126/science.1180823 [DOI] [PMC free article] [PubMed] [Google Scholar]
- 11.Tardiff DF, Jui NT, Khurana V, et al. : Yeast reveal a “druggable” Rsp5/Nedd4 network that ameliorates alpha-synuclein toxicity in neurons. Science. 2013;342(6161):979–983 10.1126/science.1245321 [DOI] [PMC free article] [PubMed] [Google Scholar]
- 12.Zanetta C, Riboldi G, Nizzardo M, et al. : Molecular, genetic and stem cell-mediated therapeutic strategies for spinal muscular atrophy (SMA). J Cell Mol Med. 2014;18(2):187–196 10.1111/jcmm.12224 [DOI] [PMC free article] [PubMed] [Google Scholar]
- 13.Battle DJ, Kasim M, Yong J, et al. : The SMN complex: an assembly machine for RNPs. Cold Spring Harb Symp Quant Biol. 2006;71:313–320 10.1101/sqb.2006.71.001 [DOI] [PubMed] [Google Scholar]
- 14.Dlamini N, Josifova DJ, Paine SM, et al. : Clinical and neuropathological features of X-linked spinal muscular atrophy (SMAX2) associated with a novel mutation in the UBA1 gene. Neuromuscul Disord. 2013;23(5):391–398 10.1016/j.nmd.2013.02.001 [DOI] [PubMed] [Google Scholar]
- 15.Ramser J, Ahearn ME, Lenski C, et al. : Rare missense and synonymous variants in UBE1 are associated with X-linked infantile spinal muscular atrophy. Am J Hum Genet. 2008;82(1):188–193 10.1016/j.ajhg.2007.09.009 [DOI] [PMC free article] [PubMed] [Google Scholar]
- 16.Chang HC, Hung WC, Chuang YJ, et al. : Degradation of survival motor neuron (SMN) protein is mediated via the ubiquitin/proteasome pathway. Neurochem Int. 2004;45(7):1107–1112 10.1016/j.neuint.2004.04.005 [DOI] [PubMed] [Google Scholar]
- 17.Burnett BG, Muñoz E, Tandon A, et al. : Regulation of SMN protein stability. Mol Cell Biol. 2009;29(5):1107–1115 10.1128/MCB.01262-08 [DOI] [PMC free article] [PubMed] [Google Scholar]
- 18.Moreno S, Klar A, Nurse P: Molecular genetic analysis of fission yeast Schizosaccharomyces pombe. Method Enzymol. 1991;194:795–723 10.1016/0076-6879(91)94059-L [DOI] [PubMed] [Google Scholar]
- 19.Laemmli UK: Cleavage of structural proteins during the assembly of the head of bacteriophage T4. Nature. 1970;227(5259):680–5 10.1038/227680a0 [DOI] [PubMed] [Google Scholar]
- 20.Kim DU, Hayles J, Kim D, et al. : Analysis of a genome-wide set of gene deletions in the fission yeast Schizosaccharomyces pombe. Nat Biotechnol. 2010;28(6):617–23 10.1038/nbt.1628 [DOI] [PMC free article] [PubMed] [Google Scholar]
- 21.Dixon SJ, Fedyshyn Y, Koh JL, et al. : Significant conservation of synthetic lethal genetic interaction networks between distantly related eukaryotes. Proc Natl Acad Sci U S A. 2008;105(43):16653–8 10.1073/pnas.0806261105 [DOI] [PMC free article] [PubMed] [Google Scholar]
- 22.Dittmar JC, Reid RJ, Rothstein R: ScreenMill: a freely available software suite for growth measurement, analysis and visualization of high-throughput screen data. BMC Bioinformatics. 2010;11:353 10.1186/1471-2105-11-353 [DOI] [PMC free article] [PubMed] [Google Scholar]
- 23.Fritz A, Rozowski M, Walker C, et al. : Identification of selected gamma-ray induced deficiencies in zebrafish using multiplex polymerase chain reaction. Genetics. 1996;144(4):1735–45 [DOI] [PMC free article] [PubMed] [Google Scholar]
- 24.McWhorter ML, Monani UR, Burghes AH, et al. : Knockdown of the survival motor neuron (Smn) protein in zebrafish causes defects in motor axon outgrowth and pathfinding. J Cell Biol. 2003;162(5):919–931 10.1083/jcb.200303168 [DOI] [PMC free article] [PubMed] [Google Scholar]
- 25.Carrel TL, McWhorter ML, Workman E, et al. : Survival motor neuron function in motor axons is independent of functions required for small nuclear ribonucleoprotein biogenesis. J Neurosci. 2006;26(43):11014–11022 10.1523/JNEUROSCI.1637-06.2006 [DOI] [PMC free article] [PubMed] [Google Scholar]
- 26.Hao le T, Duy PQ, Jontes JD, et al. : Temporal requirement for SMN in motoneuron development. Hum Mol Genet. 2013;22(13):2612–2625 10.1093/hmg/ddt110 [DOI] [PMC free article] [PubMed] [Google Scholar]
- 27.Maundrell K: nmt1 of fission yeast. A highly transcribed gene completely repressed by thiamine. J Biol Chem. 1990;265(19):10857–64 [PubMed] [Google Scholar]
- 28.Makhortova NR, Hayhurst M, Cerqueira A, et al. : A screen for regulators of survival of motor neuron protein levels. Nat Chem Biol. 2011;7(8):544–552 10.1038/nchembio.595 [DOI] [PMC free article] [PubMed] [Google Scholar]
- 29.Avila AM, Burnett BG, Taye AA, et al. : Trichostatin A increases SMN expression and survival in a mouse model of spinal muscular atrophy. J Clin Invest. 2007;117(3):659–671 10.1172/JCI29562 [DOI] [PMC free article] [PubMed] [Google Scholar]
- 30.Ackermann B, Kröber S, Torres-Benito L, et al. : Plastin 3 ameliorates spinal muscular atrophy via delayed axon pruning and improves neuromuscular junction functionality. Hum Mol Genet. 2013;22(7):1328–1347 10.1093/hmg/dds540 [DOI] [PubMed] [Google Scholar]
- 31.Oprea GE, Kröber S, McWhorter ML, et al. : Plastin 3 is a protective modifier of autosomal recessive spinal muscular atrophy. Science. 2008;320(5875):524–527 10.1126/science.1155085 [DOI] [PMC free article] [PubMed] [Google Scholar]
- 32.Hao le T, Wolman M, Granato M, et al. : Survival motor neuron affects plastin 3 protein levels leading to motor defects. J Neurosci. 2012;32(15):5074–5084 10.1523/JNEUROSCI.5808-11.2012 [DOI] [PMC free article] [PubMed] [Google Scholar]
- 33.Beattie CE, Carrel TL, McWhorter ML: Fishing for a mechanism: using zebrafish to understand spinal muscular atrophy. J Child Neurol. 2007;22(8):995–1003 10.1177/0883073807305671 [DOI] [PubMed] [Google Scholar]
- 34.Rodino-Klapac LR, Beattie CE: Zebrafish topped is required for ventral motor axon guidance. Dev Biol. 2004;273(2):308–320 10.1016/j.ydbio.2004.06.007 [DOI] [PubMed] [Google Scholar]
- 35.Fallini C, Bassell GJ, Rossoll W: Spinal muscular atrophy: the role of SMN in axonal mRNA regulation. Brain Res. 2012;1462:81–92 10.1016/j.brainres.2012.01.044 [DOI] [PMC free article] [PubMed] [Google Scholar]
- 36.Hubers L, Valderrama-Carvajal H, Laframboise J, et al. : HuD interacts with survival motor neuron protein and can rescue spinal muscular atrophy-like neuronal defects. Hum Mol Genet. 2011;20(3):553–579 10.1093/hmg/ddq500 [DOI] [PubMed] [Google Scholar]
- 37.Wiley DJ, Ilona J, Hao LT, et al. : Growth rate data of expression of UBA1 in S. pombe. F1000Research. Data Source [Google Scholar]


