

Abstract
Clostridium difficile infection is the most common cause of severe cases of antibiotic-associated diarrhea (AAD) and is a significant health burden. Recent increases in the rate of C. difficile infection have paralleled the emergence of a specific phylogenetic clade of C. difficile strains (ribotype 027; North American pulsed-field electrophoresis 1 [NAP1]; restriction endonuclease analysis [REA] group BI). Initial reports indicated that ribotype 027 strains were associated with increased morbidity and mortality and might be hypervirulent. Although subsequent work has raised some doubt as to whether ribotype 027 strains are hypervirulent, the strains are considered epidemic isolates that have caused severe outbreaks across the globe. We hypothesized that one factor that could lead to the increased prevalence of ribotype 027 strains would be if these strains had increased competitive fitness compared to strains of other ribotypes. We developed a moderate-throughput in vitro model of C. difficile infection and used it to test competition between four ribotype 027 clinical isolates and clinical isolates of four other ribotypes (001, 002, 014, and 053). We found that ribotype 027 strains outcompeted the strains of other ribotypes. A similar competitive advantage was observed when two ribotype pairs were competed in a mouse model of C. difficile infection. Based upon these results, we conclude that one possible mechanism through which ribotype 027 strains have caused outbreaks worldwide is their increased ability to compete in the presence of a complex microbiota.
INTRODUCTION
Diarrhea and colitis are two of the most common side effects of antibiotic treatment (1).The generally accepted paradigm of antibiotic-associated diarrhea (AAD) is that antibiotics cause a perturbation of the intestinal microbiota, presenting conditions that allow the growth of toxigenic bacteria and viruses. It was not until the late 1970s that toxigenic Clostridium difficile was identified as a common causative agent of AAD and colitis (2). It is now estimated that 30% of antibiotic-associated diarrhea cases are attributable to C. difficile (3) and that healthy gastrointestinal (GI) microbial communities play an essential role in providing colonization resistance to C. difficile infection (1, 4, 5).
The incidence of C. difficile infection has been steadily rising over the past decade, and it has recently become the most common nosocomial infection in the United States (2, 6). This rise in the rate of C. difficile infection has cooccurred with an increased prevalence of infection caused by a specific phylogenetic clade of strains characterized as ribotype 027 (3, 7). Initial clinical and epidemiological studies reported that ribotype 027 strains were associated with increased rates of morbidity and mortality, leading to the hypothesis that these strains are hypervirulent (7–13). However, subsequent analyses comparing the outcomes of endemic C. difficile infection caused by ribotype 027 strains to C. difficile infection caused by strains of other C. difficile ribotypes have yielded conflicting results. Several studies have found that infection with ribotype 027 strains did not result in more severe clinical outcomes across a number of institutions (14–17), whereas other studies have seen higher mortality caused by ribotype 027 strains than by strains from some of the other C. difficile ribotypes (18, 19). What is clear, however, is that ribotype 027 strains have been associated with several large outbreaks; have undergone rapid, global spread since their emergence; and have become a prevalent ribotype in many hospitals and regions (references 20 and 21 and references therein). Therefore, rather than ribotype 027 strains being hypervirulent (capable of causing more severe C. difficile disease), we hypothesized that ribotype 027 strains may instead have increased ecological fitness over strains of other C. difficile ribotypes.
In order to test this hypothesis, we examined competition between several ribotype 027 and non-027 strains in human fecal bioreactors. Fecal bioreactors have previously been used to study C. difficile invasion of complex microbial communities in vitro, as well as the effects of potential antibiotic and probiotic treatments (4, 22–24). When developing our fecal bioreactors, we modified the parameters of design and operation used in other established models to allow simpler, higher-throughput fecal minibioreactor arrays (MBRAs). Using these fecal MBRAs, we examined competition between four different pairs of ribotype 027 and non-027 clinical isolates. We found that in all competitions studied, ribotype 027 strains demonstrated a clear competitive advantage over non-027 strains, often increasing in abundance more than 2 to 3 orders of magnitude by the end of the experiment. We then performed similar competitions between ribotype 027 and non-027 strains in a mouse model of C. difficile infection and saw similar increased competitive advantage of the ribotype 027 strains. These results support our hypothesis that ribotype 027 strains have become more prevalent due to increased ecological fitness compared to strains of other C. difficile ribotypes.
MATERIALS AND METHODS
MBRA design and operation.
MBRAs were designed using computer-assisted design (CAD) software (Argon; Asheller-Vellum) and fabricated with DSM Somos Watershed XC 11122 resin via stereolithography (FineLine prototyping) (Fig. 1). Each MBRA consisted of six reactors, with an internal volume of 25 ml and a working volume of 15 ml. The MBRAs were operated under an atmosphere of 5% CO2-5% H2-90% N2 at 37°C in a heated anaerobic chamber. The media were continuously replenished, and waste was removed at a flow rate of 1.875 ml/h. Prior to use, the MBRAs and media were sterilized by autoclaving and allowed to equilibrate to the anaerobic environment for ≥72 h. The reactor contents were continuously stirred. Additional details regarding MBRA design and operation are available in the supplemental material.
FIG 1.

MBRA design and experimental overview. (A) Example of an MBRA used for cultivation of fecal microbial communities. The placement of the influent, effluent, and sample port for one of the six bioreactor chambers is indicated, as are some of the key dimensions. (B) Flowchart describing the timeline of the bioreactor experiments. PBS, phosphate-buffered saline. Additional details can be found in Materials and Methods.
Strains, media, and growth conditions.
All the C. difficile strains used in this study are clinical isolates obtained from the Michigan Department of Community Health (MDCH) (Table 1). They were collected from Michigan hospitals between December 2007 and May 2008. The MDCH determined the strain toxinotype and North American pulsed-field electrophoresis (NAP) status. Ribotyping was determined by Seth Walk (University of Michigan). All growth studies were carried out in a 37°C anaerobic chamber (Coy, Grass Lake, MI) under a 5% CO2-5% H2-90% N2 atmosphere using preequilibrated media.
TABLE 1.
Characterization of strains used in this study
| Strain | Toxinotype | PFGEa type (NAP status) | Ribotype |
|---|---|---|---|
| CD1014 | 0 | MI-NAP4 | 014 |
| CD2015 | III | MI-NAP1 | 027 |
| CD2048 | 0 | MI-NAP3 | 053 |
| CD3014 | 0 | MI-NAP2 | 001 |
| CD3017 | III | MI-NAP1 | 027 |
| CD4004 | 0 | MI-NAP6 | 002 |
| CD4010 | III | MI-UN13 | 027 |
| CD4015 | III | MI-NAP1 | 027 |
PFGE, pulsed-field gel electrophoresis.
BHIS and TCCFA were made as previously described (25), except that cysteine was excluded from both media. One liter of bioreactor medium (BRM) contained 1 g tryptone, 2 g proteose peptone number 3, 2 g yeast extract, 0.1 g arabinogalactan, 0.15 g maltose, 0.15 g d-cellobiose, 0.4 g sodium chloride, 5 mg hemin, 0.01 g magnesium sulfate, 0.01 g calcium chloride, 0.04 g potassium phosphate monobasic, 0.04 g potassium phosphate dibasic, and 2 ml Tween 80, which were adjusted to pH 6.8 and autoclaved at 121°C for 30 min. Following autoclaving, a filter-sterilized mixture of 1 g taurocholic acid (sodium salt), 40 mg d-glucose, 0.2 g inulin, 2 g sodium bicarbonate, and 1 mg vitamin K3 was added. When needed to solidify media, Bacto agar was added to a final concentration of 1.5% (wt/vol).
Collection and preparation of fecal samples for fecal MBRA experiments.
Fecal samples were donated by 12 healthy, anonymous donors who were between the ages of 25 and 64, had not taken antibiotics for at least 2 months, and had not consumed probiotic products for at least 2 days prior to donation. Fresh samples were collected in sterile containers, which were then packed in wet ice in a sealed (8.1-quart; Sterilite Ultraseal) container with two anaerobic GasPaks (BD Biosciences) and transported to the laboratory within 24 h. Samples were then transferred to an anaerobic chamber and manually mixed with sterile equipment. Aliquots were transferred to sterile cryogenic vials and stored at −80°C until use. Prior to inoculation, aliquots were pooled in equal masses and resuspended in sterile, anaerobic phosphate-buffered saline at a concentration of 25% (wt/vol). Pooled samples (pooled at equal volumes) were vortexed vigorously for 5 min, large particulates were removed by centrifugation at 201 × g for 5 min, and the supernatants were used for inoculation of the MBRA.
C. difficile invasion and competition growth studies in fecal community MBRAs.
BRM was preincubated in the 37°C anaerobic chamber for at least 48 h. Prefilled reactors were then left undisturbed for at least 16 h prior to inoculation; this step was used to validate the sterility of each reactor within the MBRA prior to inoculation with fecal slurry. Four milliliters of 25% fecal slurry inoculum, prepared as described above, was inoculated into each reactor with a sterile needle and syringe, giving a final concentration of fecal suspension of ∼5% (wt/vol). Freshly inoculated fecal suspensions were allowed to grow in each reactor within the MBRA for 16 to 18 h prior to the initiation of a flow of fresh medium. After 16 to 18 h, a fresh medium flow and waste removal were initiated; 36 h later, we began dosing clindamycin (final concentration, 500 μg/ml) or an equivalent volume of water (solvent for clindamycin) (both stored aerobically at 4°C until use) twice daily for 4 days. Samples (1 ml) were removed from the excess fecal slurry and from the reactors prior to the initiation of dosing and daily thereafter throughout the experiment. The samples were centrifuged at 21,000 × g for 1 min, the supernatants were discarded, and the cell pellets were stored at −80°C until they were subjected to further analysis.
For invasion studies with CD2015, CD2015 was grown in BRM broth batch culture overnight, and the reactors were inoculated either with a 1:100 dilution of the overnight culture (Fig. 2) or from dilutions of the exponentially growing subculture in BRM broth (Fig. 3) (CD2015 concentrations are specified in the figures) on day 7 of operation. Prior to inoculation, the reactors were tested for C. difficile contamination by selective plating of an aliquot of each reactor's contents on TCCFA supplemented with rifampin (Rif) (50 μg/ml) and erythromycin (Erm) (20 μg/ml) and by quantitative PCR (qPCR) with C. difficile-specific primers (see below). Additional 200-μl samples were removed from each reactor either 15 min (Fig. 3) or 3 h (Fig. 2) postinoculation, and CD2015 levels were determined by selective plating on TCCFA with Rif and Erm. On subsequent days of MBRA operation, C. difficile levels were determined via selective plating of an appropriately diluted 100-μl aliquot from the 1-ml daily sample, as well as by C. difficile-specific qPCR at the times indicated.
FIG 2.

Fecal bioreactor communities prevent invasion by C. difficile unless disrupted by treatment with clindamycin. We monitored C. difficile proliferation in three independent fecal bioreactors that were either clindamycin treated (reactors 1 to 3; solid squares, circles, and diamonds, respectively) or mock treated (reactors 4 to 6; open squares, circles, and diamonds, respectively) through selective plating (A) or quantitative PCR (B). The gray dashed line in panel A represents the theoretical washout rate of nonproliferating C. difficile cells. The dotted line represents the limit of detection for selective plating (A) or qPCR (B) in our experiments.
FIG 3.

C. difficile proliferation was assayed in fecal bioreactors with different levels of inoculum and in pure culture under the continuous-culture conditions used for bioreactors. (A) We monitored C. difficile proliferation in four independent fecal bioreactors that were clindamycin treated and inoculated at the indicated densities. (B) We measured C. difficile proliferation in pure culture in three replicate continuous-culture bioreactors operated under the flow conditions used for fecal bioreactors.
For competition studies, bioreactors were set up following the C. difficile in vitro invasion model described above with the following modifications. The strains were inoculated into 5 ml BRM overnight and were subcultured into 10 to 30 ml BRM medium and allowed to grow at 37°C for 4 h before inoculation into the reactors to ensure active growth at the time of inoculation. The subcultures were mixed at various ratios (1:1, 1:2, or 1:5 [027/non-027] as indicated) and inoculated into the reactors. For the replicates indicated in Table S1 in the supplemental material (three replicates of two competition pairs, CD3017-CD3014 and CD4010-CD4004), C. difficile was inoculated into the reactors on day 8 of operation instead of day 7. Samples (0.5 ml) were removed from the reactors immediately prior to C. difficile inoculation and 2 h after inoculation and processed as described above, and 0.25 ml of the aliquots collected prior to C. difficile inoculation was used in qPCRs (described below) to detect possible C. difficile contamination. The MBRAs were run for an additional 10 to 12 days and sampled daily as described above.
Quantitative PCR of the tcdA gene to quantify C. difficile invasion.
Frozen culture cell pellets were resuspended in 0.5 ml sterile water and transferred to 2-ml screw-top tubes containing ∼200 μl 0.1-mm silica beads (Biospec Products). The samples were homogenized by bead beating (BioSpec Products) on the homogenize setting for 1.5 min and centrifuged for 1 min at 21,000 × g, and the supernatant was transferred to a new tube. When not in use, the processed supernatants were stored at −20°C. C. difficile levels were determined by qPCR with primers specific to the C. difficile toxin A gene (tcdA) (see Table S2 in the supplemental material).
We calibrated the tcdA signal observed in our reactors to a known concentration of C. difficile cells grown under fecal bioreactor conditions in the MBRA and enumerated by plate counting. We processed the samples as described above and spiked them into pooled supernatant samples prepared from bioreactors prior to C. difficile inoculation. We generated 10-fold dilutions of C. difficile in this background community DNA and used them to generate a standard curve for determining the absolute amounts of C. difficile in our bioreactor samples. We also used 10-fold dilutions of community DNA alone to generate a standard curve for assessing the total bacterial signal from our reactors using universal 16S primers (see Table S2 in the supplemental material).
Real-time PCRs were performed in triplicate and contained the following components: 4 μl supernatant (undiluted [tcdA] or a 1:500 dilution in sterile water [universal 16S rRNA]), 12.5 μl Power SYBR green PCR master mix (ABI, Carlsbad, CA), 0.25 μl each primer (5 μM) (see Table S2 in the supplemental material), and 8 μl Milli-Q water. Real-time PCR was performed using an Eppendorf Mastercycler PCR machine under the following conditions: 95°C for 10 min and 40 cycles of 95°C for 15 s followed by 60°C for 1 min. A 20-min melting curve was also performed from 60°C to 95°C. We calculated the tcdA copies per milliliter from our experimental samples using the threshold cycle (CT) values and concentrations from our standard curve described above. If a sample's CT value fell below the lowest concentration from our standard curve, it was designated below the limit of detection, which was 1,000 tcdA copies/ml. We also determined the total bacterial load per sample based upon the CT value with broad-host-range 16S rRNA primers (see Table S2 in the supplemental material). We used these CT values, which varied by less than 3 cycles across all samples (CT = 18.75 to 21.97) (see Fig. S1 in the supplemental material), to normalize the tcdA copy numbers that are reported in Fig. 2.
Preparation of 16S rRNA amplicon sequencing.
We extracted DNA from samples using bead beating followed by modified cleanup with a Qiagen DNeasy Tissue Kit as described previously (26). DNA concentrations were determined by spectrophotometry at 260 and 280 nm (Nanodrop). We used 40 ng of each DNA as the template in PCR with the following final concentrations of reagents: 200 nM 357F primer, 200 nM 926R primer, 1× AccuPrime PCR Buffer II (Invitrogen), and 0.75 U of AccuPrime Taq DNA High Fidelity (Invitrogen). Primers 357F/962R were designed by the Human Microbiome Project, amplify the V3-V5 variable regions of the 16S rRNA gene, and contain unique barcodes that can be used to multiplex sequencing reactions (27). Each reaction was set up in triplicate and amplified using the following cycle: 95°C for 2 min, followed by 30 cycles of 95°C for 20 s, 50°C for 30 s, and 72°C for 5 min, with a final extension at 72°C for 5 min. Successful PCR amplification products from triplicate reactions were pooled and cleaned with Agencourt AMPure XP (Beckman-Coulter). The products were resuspended with a 0.7× volume of beads, washed twice with 70% ethanol, and eluted with 25 μl of low-EDTA TE buffer (10 mM Tris, 0.1 mM EDTA). Concentrations of purified DNA were determined using Quant-It (Invitrogen) according to the manufacturer's protocol and were pooled in equimolar amounts. Nucleotide sequencing was performed on a 454 GS Junior (Roche Diagnostics) at Michigan State University (MSU) according to the manufacturer's protocols.
Processing and analysis of sequencing data.
All sequence data were processed using mothur (28) version 1.29.1 (January 2013). Sequences were initially quality filtered using the mothur implementation of PyroNoise to remove low-quality sequences, as well as trimmed and filtered to remove those sequences that had any ambiguous bases, mismatches to the reverse primer or barcode, or homopolymeric stretches longer than 8 nucleotides (nt) and were shorter than 200 nt (29). Sequences from independent sequencing runs were then compiled into a single fasta file and aligned to the SILVA reference alignment (http://www.arb-silva.de/) using the Nearest Alignment Space Termination (NAST)-based aligner in mothur, trimmed to ensure that sequences overlapped, and preclustered, allowing a difference between sequences of 2 bp or less (29). Potentially chimeric sequences were removed using the mothur implementation of UChime (30); the remaining sequences were classified using the Ribosomal Database Project (RDP) training set version 9 (March 2012) and mothur's implementation of the kmer-based Bayesian classifier. Sequences were binned into operational taxonomic units (OTUs) with ≤3% sequence dissimilarity using the average neighbor algorithm of mothur. Taxonomy was assigned to each OTU based upon the majority sequence consensus within that OTU (31). The number of OTUs, evenness (Simpson evenness), and diversity (inverse Simpson) were calculated using mothur. Differences in OTU abundances between treated and untreated bioreactors were determined using the mothur implementation of metastats (32). Bray-Curtis dissimilarities were calculated from the OTU distributions of each sample, which were log10 transformed and normalized by dividing the abundance of each OTU in a sample by the maximum abundance observed for that OTU, followed by normalizing the total abundance of OTUs across each sample to the same number using the vegan package in R (33). The metaMDS function of vegan was used to determine the optimal ordination distances for the Bray-Curtis dissimilarities, which were also plotted in R. The significance of community differences was determined by analysis of similarities (ANOSIM), which was calculated in R.
Quantitative-PCR analysis of competition cultures and calculations of the competitive index.
The strain-specific genes thyA (027) and thyX (non-027) were used to differentiate strains in competitions. We first identified the strain specificity of these thymidylate synthase genes while doing in silico genomic comparisons of C. difficile genomes. We then screened a collection of 88 strains belonging to several NAP groups, including all of the strains used in this study, for the presence of thyA or thyX (see Fig. S3 in the supplemental material) and verified that thyA was unique to NAP1 (ribotype 027) strains by screening. This correlation of thyA with ribotype 027 strains was noted previously (34).
Frozen culture cell pellets (from 0.5 or 1 ml cells) were washed in the same volume of sterile water, resuspended in the same volume of sterile water, and transferred to 2-ml screw-top tubes containing ∼200 μl 0.1-mm silica beads. The samples were then placed in a BeadBeater cell disruptor (BioSpec Products, Bartlesville, OK) on the homogenize setting for 1 min, centrifuged at 21,000 × g for 1 min, and diluted 1:10 in sterile water. Real-time PCRs were set up by combining the following components: 12.5 μl Power SYBR green PCR master mix (ABI, Carlsbad, CA), 0.25 μl each primer (100 μM), 11 μl Milli-Q water, and 1 μl diluted culture supernatant. The primers used are described in Table S2 in the supplemental material. PCR was performed using the conditions described above. All PCRs were performed in technical triplicate, and the CT values are an average of the triplicate data points. The amplification efficiency (E) of each primer set was determined by plotting the CT values of a standard curve generated by serial 4-log-unit dilutions of C. difficile template; the sample with the highest signal was diluted in sample with no C. difficile inoculated (community background DNA). Primer efficiencies were calculated using the method described by Pfaffl: E = 10(−1/slope) (35). Competitive indices (CI) were calculated by dividing the endpoint ribotype 027/non-027 ratio by the ratio at time zero (T0) [ratio = 2CT(non-027) − CT(027)]. Primer efficiencies were not factored into the CI calculations; however, they differ by <5% (EthyA = 2.04; EthyX = 1.95) when calculated from reactions using samples containing C. difficile diluted in fecal community background DNA.
C. difficile competition experiments in hmmice.
Germ-free C57/B6 mice were gavaged with fecal slurry pooled from the 12 human fecal donors described above. Following initial establishment, a stable humanized microbiota was passed from humanized microbiota mice (hmmice) to their progeny. Descendants of these original hmmice were maintained under specific-pathogen-free conditions and used for all experiments. To induce susceptibility to C. difficile infection (36), an antibiotic mixture of kanamycin (0.4 mg/ml), gentamicin (0.035 mg/ml), colistin (850 U/ml), metronidazole (0.215 mg/ml), and vancomycin (0.045 mg/ml) was administered in drinking water ad libitum for 3 days and then replaced with fresh drinking water. After 24 h of plain drinking water, the mice were treated intraperitoneally with clindamycin (10 mg/kg of body weight) and challenged 24 h postinjection with 104 pure or mixed 027/non-027 C. difficile spores. The spores were cultivated by spread plating overnight BHIS cultures of C. difficile on BHIS medium and incubating them anaerobically at 37°C for 5 days. The cells were scraped from the plates, resuspended in sterile water, and heat treated at 60°C for 30 min to kill vegetative cells, and the viable spores were enumerated by plating appropriate serial dilutions on BHIS supplemented with 0.1% taurocholic acid. Spore preparations were diluted in sterile water to yield the desired concentrations (∼104 or ∼105 spores/ml) and then mixed, when appropriate, prior to gavaging a total of ∼104 spores/mouse. For competition experiments, mice were gavaged with the following ratios of ribotype 027/non-027 spores: 1:14 for CD3017 plus CD1014 and 1:50 for CD4015 plus CD2048. The mice were observed daily for disease symptoms and morbidity. Fecal samples were collected daily and frozen until analyzed.
C. difficile levels were quantified in fecal samples by plating. The fecal samples were weighed, diluted in 500 μl sterile water, and heat treated at 65°C for 30 min to reduce background growth of mouse fecal microbiota. The total number of heat-resistant CFU per gram of feces was determined by spotting appropriate serial dilutions on BHIS plates supplemented with 0.1% taurocholic acid. Ribotype 027-specific heat-resistant CFU per gram of feces were determined by spotting appropriate serial dilutions on BHIS plates supplemented with 0.1% taurocholic acid and either 50 μg/ml rifampin and 10 μg/ml erythromycin (CD4015 plus CD2048 competition samples) or 10 μg/ml erythromycin only (CD3017 plus CD1014 competition samples). The plates were incubated anaerobically for 24 to 48 h. Colonies formed on antibiotic-supplemented medium represented levels of ribotype 027 strains (CD3017 and CD4015). Non-027 ribotype strain levels were determined by subtracting the number of colonies formed on selective plates from the number on nonselective plates (total C. difficile). The fecal sample weights were then used to determine the CFU per gram of feces. While TCCFA medium is typically required to adequately reduce background growth and allow accurate enumeration of C. difficile in conventional mouse models of infection, we have found by plating the same fecal samples from our humanized microbiota mice on both TCCFA and BHIS that heat treatment is sufficient to eliminate background growth of the microbiota on BHIS. CI were calculated by dividing the ribotype 027/non-027 strain ratios at day 4 by the ratios in the gavaged spore mixtures. In cases where the number of colonies on selective plates were the same as the number on nonselective plates, the ribotype 027/non-027 ratio was set to 10. This was determined to be a reasonable level for the non-027 limit of detection based on this type of subtractive analysis, taking into account the plating error, and would most likely result in an underestimate of the 027 CI.
Because we used subtractive plating to measure the levels of ribotype 027/non-027 spores and our detection limit set the maximum observable ribotype 027/non-ribotype 027 strain ratio at 10:1, we found that starting with the ribotype 027 strain in the minority provided a larger dynamic range that allowed us to more readily detect an increase in the ribotype 027 strain levels compared to non-027 levels. Although the ratios of ribotype 027/nonribotype 027 spores gavaged were lower than originally intended, placing the ribotype 027 strains in the minority ensures that the 027 strains do not have an advantage by being at even a slightly higher proportion in the mixed spore preparations, since there is always a low level of error in diluting and plating.
RESULTS
Fecal MBRAs provide an in vitro model to study C. difficile invasion in complex microbial communities.
Our objective was to design human fecal bioreactors that recapitulated antibiotic-induced C. difficile invasion of a resistant community that also allowed testing of multiple experimental parameters in replicate reactors simultaneously. Therefore, we pursued a relatively simple bioreactor design, an array of six single vessel chambers (MBRA) with modest operating volume (15 ml) that would allow us to operate up to 24 continuous-flow fecal bioreactors simultaneously in the same anaerobic chamber (Fig. 1). The reactors were fabricated with DSM Somos Watershed XC 11122 resin, which allowed direct observation of the reactor contents and the ability to autoclave and reuse the reactors.
Continuous-flow MBRAs were inoculated with fecal samples pooled from 12 healthy, C. difficile-negative donors, and bacterial communities were allowed to adapt to growth in culture before challenging the communities with clindamycin, an antibiotic known to support C. difficile invasion (37). Initial studies compared the abilities of three clindamycin-treated and three mock-treated communities to resist invasion by C. difficile. We found that in mock-treated communities challenged with 106 vegetative cells of C. difficile, C. difficile levels were reduced to below the level of detection in replicate reactors within 1 to 4 days following inoculation (Fig. 2, open symbols). In contrast, when MBRAs were treated twice daily with clindamycin for 4 days prior to C. difficile inoculation, C. difficile levels were maintained at the same high levels at which they were inoculated for 8 days following inoculation (Fig. 2, solid symbols).
Because we used such a high inoculum in this initial experiment, we were interested in establishing the minimum number of C. difficile cells required for invasion. We found that inoculation with 104 or 150 cells was sufficient to allow clindamycin-induced invasion by C. difficile and that the final number of CFU per ml reached 105 to 106 (Fig. 3A). These levels are only ∼10- to 100-fold lower than the 107 CFU/ml that pure C. difficile reaches in reactors operating under these continuous-culture conditions (Fig. 3B).
In addition to the invasion that we observed for the single ribotype 027 strain (CD2015) shown in Fig. 2, we found similar invasion dynamics for other ribotype 027 strains (CD3017, CD4010, and CD4015), as well as strains from other ribotypes (CD1014, CD3014, and CD4004) (data not shown). Based upon these results, we concluded that the communities established in our fecal MBRAs demonstrated the key attribute of an in vitro C. difficile invasion model that we intended to achieve—the ability to resist invasion by C. difficile until disrupted by antibiotic treatment.
MBRAs support complex fecal microbial communities.
In order to investigate whether the resistance to invasion that we observed in our unperturbed MBRA communities was due to the presence of complex microbial communities or simple communities composed of a few strains that were inhibitory to C. difficile growth, we sequenced the V3-V5 hypervariable region of the 16S rRNA gene from samples collected from the triplicate clindamycin- and mock-treated reactors through pyrosequencing. Samples were collected prior to antibiotic treatment (day 2) and every 2 days after the initiation of treatment (days 4, 6, 8, 10, and 12; C. difficile was added to all reactors on day 7), and sequencing data from these samples were compared to data from duplicate samples from the initial fecal inoculum.
In order to characterize the community composition of our samples, we partitioned our sequences into OTUs. These OTUs are groups of sequences that share ≥97% sequence identity among their 16S rRNA genes and are separated from sequences in other OTUs by ≥3% sequence dissimilarity. We chose this level of sequence identity as the basis of our OTUs because it is often used as a proxy for species level relationships (38), although it has been acknowledged that this level of sequence similarity does not always correlate with species level relationships (39). At the sequence depth examined (1,053 sequences/sample), we detected a mean of 69 OTUs in the untreated (day 2; all reactors) and mock-treated (days 4, 6, 8, 10, and 12) bioreactor communities (Fig. 4A). The number of OTUs observed in untreated or mock-treated reactors was ∼2.4-fold lower than that observed in the original fecal inoculum (mean, 168 OTUs) (Fig. 4A).
FIG 4.
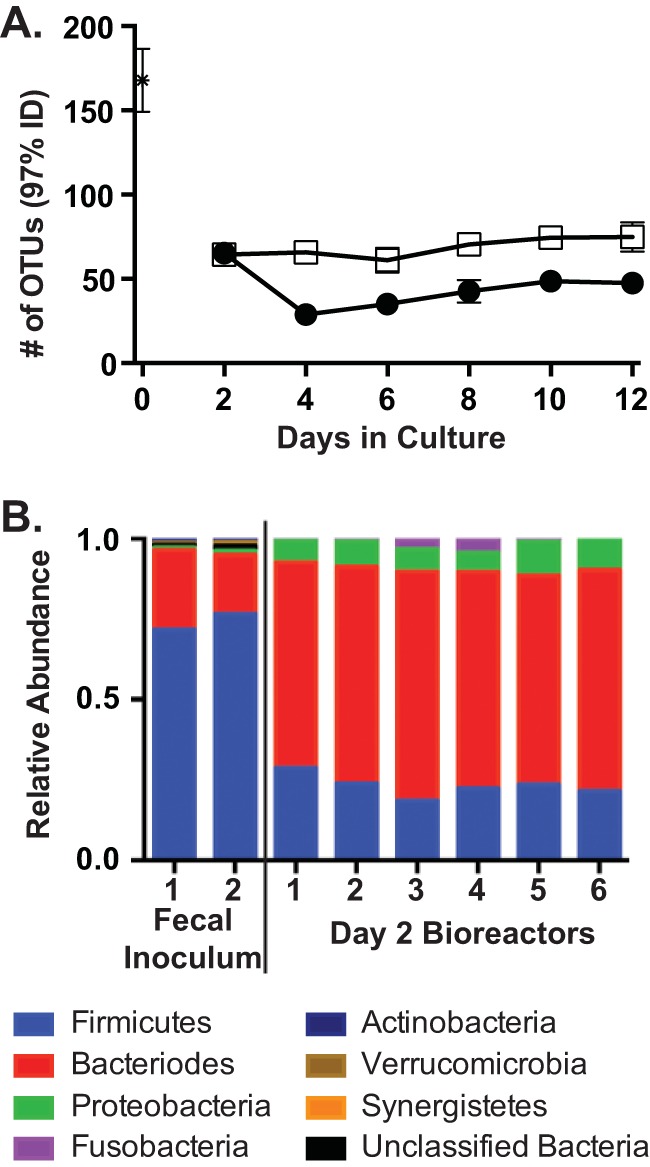
Comparison of community structure between fecal samples and mock-treated and clindamycin-treated reactors. We analyzed the 16S rRNA gene abundances from the three mock-treated and clindamycin-treated communities described in the legend to Fig. 2 on days 2, 4, 6, 8, 10, and 12 in MBRAs, as well as duplicate samples from the initial fecal inoculum. (A) We plotted the mean number of OTUs in the fecal inoculum (asterisk), and clindamycin-treated (circles) and mock-treated (squares) communities ± standard deviations. (B) We classified each sequence to the phylum level with at least 80% confidence (sequences at <80% were designated unclassified bacteria). We then plotted the relative abundance of each phylum in the duplicate samples of the initial fecal inoculum and the six replicate bioreactor samples from day 2 prior to the initiation of treatment. The reactors are numbered as in Fig. 2. (Figure S2 in the supplemental material presents the relative abundance of each phylum in the six replicate bioreactor samples on days 4 to 12.)
When we compared the composition of the original fecal inoculum community to that of the bioreactor communities, we found a significant shift in composition upon culturing in the bioreactors, even by day 2 (Fig. 4B). The fecal inoculum was dominated by members of the phylum Firmicutes, which comprised 74% ± 3% of the sequences. In contrast, members of the phylum Bacteroides were dominant members of the bioreactor communities on day 2 in culture (Fig. 4B), comprising 67% ± 3% of the sequences in all six replicate reactors studied.
Bioreactor community composition changes in response to clindamycin treatment.
Because clindamycin-treated bioreactor communities become susceptible to C. difficile invasion (Fig. 2), we anticipated that we would observe changes in the microbial compositions of these communities compared to the mock-treated communities and that these changes would be consistent with previously published models of C. difficile invasion. One significant change we observed in our clindamycin-treated communities was a significant reduction in the number of OTUs compared to mock-treated reactors (Fig. 4A) (P < 0.01 for days 4 to 12 with two-tailed Student's t test). The ability of antibiotic treatment to significantly reduce species complexity has been previously reported (26, 40). Although the species richness declined, quantitative PCR with broad-range 16S rRNA gene primers showed the total amount of bacteria in the reactors was equivalent to that in untreated reactors after clindamycin treatment (see Fig. S1 in the supplemental material), indicating that C. difficile invasion was not dependent upon a decreased bacterial load in the bioreactors.
This change in microbial composition was also evident when comparing the compositions of the communities using the Bray-Curtis dissimilarity measure, which compares the relative abundances of shared OTUs between communities. When we plotted these data using nonmetric multidimensional scaling (NMDS) (Fig. 5), we found that all six bioreactor communities were highly similar prior to treatment on day 2 and that bioreactor communities diverged in response to clindamycin treatment, as well as time in culture. ANOSIM (41) found strong statistical support (P < 0.001) for the distinct partitioning of the communities into pretreatment, mock treatment, and clindamycin treatment groups, with clindamycin treatment causing a more significant shift in community structure than time in culture. Using metastats (32), we identified several specific OTUs that were significantly different between treated and untreated communities. We observed decreases in specific members of the families Ruminococcaceae, Lachnospiraceae, and Clostridiaceae that were consistent with changes observed in previous animal and human studies (42, 43), providing further support for the relevance of this model for studying aspects of C. difficile invasion in vitro.
FIG 5.

Community structure changes in response to clindamycin (Clinda.) treatment. We compared community composition between the three replicate clindamycin-treated reactors and three replicate mock-treated reactors described in the legends to Fig. 2 and 4 on days 2, 4, 6, 8, 10, and 12 in culture. Day 2 samples were collected prior to initiation of treatment; samples from days 4 and 6 were collected while clindamycin or mock treatment was ongoing; and samples from days 8, 10, and 12 were collected following the cessation of treatment. C. difficile was added to all six reactors on day 7. We used the Bray-Curtis dissimilarity measure to examine differences in both the presence/absence and abundance of each OTU across all the samples and plotted these pairwise comparisons using NMDS. Each point on the plot represents a single reactor (clindamycin-treated replicates 1, 2, and 3, solid circles, solid squares, and solid triangles, respectively; mock-treated replicates 1, 2, and 3, open circles, open squares, and open triangles, respectively) at a single point in time. Individual time points for each reactor are connected by lines between the points, beginning on day 2 (pretreatment) and continuing through day 12. From the NMDS, we observed potential partitioning of the samples into three groups (pretreated, mock treated, and clindamycin treated). These distinct distributions were supported by ANOSIM, with P values of <0.001. The ellipses indicate the 95% confidence intervals for the means of the distribution of communities for the indicated groups (pretreatment, mock treatment, and clindamycin treatment). Distinct distributions between clindamycin and early/mock-treated samples were also supported by ANOSIM, with P values of <0.001. The plot stress for the NMDS was 0.171.
Ribotype 027 strains exhibit a competitive advantage over non-027 strains in the presence of a complex microbiota.
Having developed the MBRA C. difficile invasion model, we investigated if ribotype 027 strains were able to better compete than non-027 ribotype strains for their available niche after antibiotic treatment in the presence of the complex MBRA communities. We chose to study recent clinical isolates of ribotype 027 and non-027 C. difficile strains collected by the Michigan Department of Community Health in order to avoid confounding effects of strain adaptation to laboratory conditions. Eighty-eight isolates were characterized by NAP fingerprint, toxinotype, and ribotype; we selected eight strains for further study (Table 1). Four different ribotype 027 strains were competed against four different non-027 ribotype strains in order to avoid selecting strains with unrepresentatively high or low competitive fitness for either ribotype group. For the non-027 ribotypes, we selected strains that were different ribotypes and had different NAP designations to broaden the phylogenetic breadth of strains tested.
Exponentially growing pure cultures of ribotype 027 and non-027 C. difficile strains were mixed together and inoculated into clindamycin-treated MBRAs. At days 3, 7, and 11 postinoculation, samples were taken and quantitative PCR was conducted to determine the relative ratios of the competing strains. Plotted in Fig. 6 are the CI of ribotype 027 strains at day 7 for all of the replicates in each competition pair, calculated as the 027/non-027 ratio at day 7 divided by the ratio at day 0. The mean competitive indices (range) for these competitions are 3.8 (0.75 to 22.4) for CD2015, 91.5 (21.9 to 3,993.2) for CD3017, 19.8 (1.4 to 593.4) for CD4015, and 152.9 (30.3 to 764.9) for CD4010. Figure S3 in the supplemental material shows the 027/non-027 ratios of all competition pairs plotted across time for each individual reactor. The competition dynamics vary between replicates both within and across competition pairs. However, there is a strong trend of increasing ratios over time for the ribotype 027 strains, even when started at different initial input ratios, further supporting their competitive advantage. The competitive indices calculated from these ratios across all time points (days 3, 7, and 11; some days vary [see the figure legend]) are reported in Table S1 in the supplemental material. Across all 22 competition replicates, only two CI were <1.0 at day 7; they account for two of the six replicates of the CD2015 (ribotype 027) plus CD3014 (ribotype 001) competition pair. This competition pair was particularly interesting in that the ribotype 027 strain (CD2015) displayed an initial drop in the strain ratio in the majority of the competition replicates, sometimes emerging as low as 2% of the total C. difficile population at day 3 (see Fig. S4 in the supplemental material). Nevertheless, CD2015 was able to recover and eventually outcompete the non-027 ribotype strain by the end of the competitions. At the day 11 time point of these replicates, the ratios continued to increase, resulting in CI close to or >1 (see Table S1 in the supplemental material).
FIG 6.

Competitive indices of ribotype 027 strains relative to non-027 strains in the presence of MBRA fecal communities. Clindamycin-treated bioreactors were inoculated with the indicated mixtures of strains at various ratios, and the abundance of each strain was monitored over time by qPCR to measure ribotype 027/non-027 ratios. Plotted here is the competitive index of the ribotype 027 strains for each replicate competition, calculated as the 027/non-027 ratio at day 7 or 8 (see Table S1 in the supplemental material) divided by the ratio at day 0. Each circle represents an individual replicate competition. Where the non-027 strain was below the limit of detection, the ratio was determined by substituting the highest CT value in the linear range (detection limit) for the non-027 value. The horizontal bars represent the geometric means of replicates for each competition.
One possible mechanism for ribotype 027 strains to outcompete the non-027 strains would be if the latter were inherently unable to invade the complex MBRA communities. We tested this hypothesis by inoculating fecal bioreactors with individual non-027 strains and saw that the strains were as able to invade the microbiota as ribotype 027 strains (data not shown). In addition, the MICs of clindamycin for all of the strains used in the study ranged from 50 μg/ml to >100 mg/ml (data not shown), concentrations severalfold higher than the calculated residual clindamycin in the reactors at the time of C. difficile inoculation based on theoretical washout (<9 μg/ml). Therefore, the competition outcome was not reflective of differences in clindamycin sensitivity.
Because we performed our competition experiments in fecal bioreactors that had been treated with clindamycin and did not include untreated control reactors, we wanted to verify that the communities present in our clindamycin-treated competition reactors were similar to those previously established and characterized in our in vitro invasion model. Therefore, we sequenced the V3-V5 hypervariable region of the 16S rRNA gene from our competition bioreactor samples at day 7, just prior to C. difficile inoculation, by pyrosequencing and compared these sequences to the previous data we had collected from our in vitro invasion model (Fig. 4 and 5). We found that the richness, diversity, and evenness of the competition communities were similar to those of the other clindamycin-treated communities on day 6 (see Fig. S5 in the supplemental material). When we compared the microbial community structures of the competition bioreactor samples using the Bray-Curtis dissimilarity measure and plotted them with the previous clindamycin-treated and mock-treated samples with NMDS, we found that they grouped together with the clindamycin-treated communities (see Fig. S6 in the supplemental material). These community comparisons show that the strains were competed in the presence of complex, diverse fecal communities and not community anomalies of unexpectedly low richness or diversity.
Ribotype 027 strains display a competitive advantage in vivo.
In order to address if ribotype 027 strains are capable of outcompeting non-027 ribotype strains in the intestinal tract, we competed two ribotype 027 and non-027 strains in a humanized microbiota mouse model of C. difficile infection. Mice were treated with an antibiotic cocktail (36) for 3 days, followed by a single dose of clindamycin. Twenty-four hours later, the mice were gavaged with C. difficile spores. Under these conditions, strains CD3017 and CD4015 (ribotype 027) and strains CD1014 and CD2048 (ribotypes 014 and 053, respectively) were able to transiently colonize the intestinal tracts of the mice when infected individually without causing severe disease (see Fig. S7 in the supplemental material).
To compare the relative fitness of ribotype 027 and non-027 strains, antibiotic-treated animals were treated with a mixture of 104 spores from strains CD3017 (027) and CD1014 (014) (ratio, 1:14) or CD4015 (027) and CD2048 (053) (ratio, 1:50). The abundance of each strain was monitored daily by selective plating of mouse feces. The 027 strain competitive indices in replicate mice for both competition groups are plotted in Fig. 7. Competitive indices were calculated by dividing the 027/non-027 ratios at day 4 by the ratios present in the gavaged spore mixtures.
FIG 7.

Competitive indices of ribotype 027 strains relative to non-027 strains in a mouse model of C. difficile infection. After antibiotic treatment, mice were gavaged with mixtures of 027 and non-027 ribotype strain spores. C. difficile abundances for the indicated strains were determined by selective plating of the fecal samples. Plotted here is the competitive index of the 027 strains for each replicate mouse competition as the 027/non-027 ratio at day 4 divided by the ratio at day 0 (ratio in spore mixes). The horizontal bars represent the geometric means of replicates for each competition. The dotted line on the y axis represents the upper CI limit for the CD3017-CD1014 competition based on the plating limit of detection.
In both competitions, we noted that the ribotype 027 strains had a competitive advantage when directly competing in the mouse intestinal tract (Fig. 7). CD3017 displayed a dramatic expansion over days 2 to 4 when competed against CD1014; at day 4, the mean CI for 3017 was 65.8 (range, 18.8 to 140.9). CD4015 also displayed a competitive index that showed it had a competitive advantage over CD2048, and although the CI was not as robust as observed with CD3017, it had a competitive advantage, with a CI of 10.9 (range, 7.9 to 25.0). These data demonstrate that ribotype 027 strains have a competitive advantage over non-027 strains in vivo.
DISCUSSION
Ribotype 027 strains have been frequently shown to be overrepresented in hospital outbreaks and have been linked to increased morbidity and mortality. Although this association with a hypervirulent state is controversial, the fact that ribotype 027 strains have swept across the globe implies they have acquired an increased ability to cause disease. We hypothesized that differences in strain physiology could give ribotype 027 strains a competitive advantage over strains of other ribotypes, thereby leading to the increased prevalence of ribotype 027 strains. We used the MBRA C. difficile invasion model to demonstrate that ribotype 027 strains were able to outcompete strains of other ribotypes in the presence of complex fecal bacterial communities. We then demonstrated competitive advantages of ribotype 027 strains similar to those of strains of other ribotypes in a mouse model of C. difficile infection.
Our work demonstrates that ribotype 027 strains can directly outcompete strains of other ribotypes. Because we used four independent ribotype 027 strains competed against four independent strains of various ribotypes, we do not expect that the observed increase in competitive fitness of the ribotype 027 strains was due to strain selection. In the majority of competition pairs we studied, the ribotype 027 strains became the dominant C. difficile strains in the community, sometimes leading to the complete loss of the non-027 strains. This dominance was observed in all bioreactor communities studied, as well as in the mouse competition between the ribotype 027 strain CD3017 and the ribotype 014 strain CD1014. However, in the second mouse competition between ribotype 027 strain CD4015 and ribotype 053 strain CD2048, the ratio of CD4015 to CD2048 increased over time, from a 1:50 ratio at the beginning of the experiment to a mean 1:4 ratio (range, 1:10 to 1:2) at the end of the experiment, but CD4015 did not become the dominant C. difficile strain in the community. Although we interpret these results to indicate that CD4015 was outcompeting CD2048 for available niche space and would likely have led to its loss from the community if the experiment had been continued further, we cannot exclude the hypothesis that both strains would have reached a steady level of coexistence. When comparing CI of competition pairs in the MBRA or mice, similar trends were observed, with the CD3017 CI higher than the CD4015 CI in each model, supporting the idea that the MBRA model can recapitulate the C. difficile dynamics that occur in vivo and further demonstrating the increased fitness of these strains and the validity of the MBRA model as a precursor for in vivo experiments (see Fig. S8 in the supplemental material).
However, it is currently unclear what physiological differences present in ribotype 027 strains allow these strains to outcompete strains of other ribotypes. It is unlikely the competitive advantage of ribotype 027 strains is due to a simple growth rate advantage. We have performed in vitro batch culture studies in a variety of different media in our laboratory and found that there were no significant differences in growth rates of our ribotype 027 strains compared to strains of other ribotypes (unpublished results). Further, recently published data demonstrate that some ribotype 027 strains grow more slowly than strains of other ribotypes (44). Although it is possible that ribotype 027 strains are capable of directly antagonizing strains of other ribotypes, we favor the model in which ribotype 027 strains have increased cellular fitness that allows them to better compete for available limiting nutrients, thereby excluding competing ribotypes and indirectly leading to their elimination.
One aspect of physiology that could potentially impact competition outcome is interstrain variability in rates of sporulation. If one strain had a higher proportion of the cells in its population enter sporulation during the course of competition, that strain would have fewer cells in vegetative growth, effectively reducing its competitive fitness. Although there have been some reports that ribotype 027 strains sporulate more efficiently than other strains (45, 46), larger studies comparing multiple isolates of different ribotypes have found that there is no significant correlation between sporulation efficiency and ribotype (44, 47). Because sporulation dynamics of individual strains cocultured within the MBRA are difficult to measure, we do not currently have data to determine whether the non-027 strains used in our study sporulate to higher levels than the 027 strains. However, when we assayed sporulation in pure culture under both batch and continuous-culture conditions, we did not observe higher rates of sporulation of these non-027 strains (data not shown). The dynamics of C. difficile sporulation in the context of growth in the presence of a complex fecal community is an area of current and future investigation. While it is important to consider the impact of sporulation dynamics on competition outcome, we do not believe this is the factor responsible for ribotype 027 strains outcompeting other ribotypes in our experiments.
A second aspect of physiology that could play a role in competitive fitness is differences in germination. Differential germination does not play a role in the competitive advantage of ribotype 027 strains in the MBRA, since competitions were initiated with vegetative cells. In contrast, competition in the mouse model was initiated by gavaging a mixture of spores. Recent work published by Francis et al. demonstrates that murine bile acids (muricholic acids) inhibit C. difficile spore germination and that there is strain variability in this inhibition (48). In addition, published data show there is significant variability in rates of germination and the compounds that serve as germinants among large sets of C. difficile strains of varying ribotyes, at least in vitro (49). However, when we compared the day 1 levels of C. difficile in the mice gavaged with individual strains of different ribotypes to the levels of spores present in the initial inoculum, we found similar increases in the abundances of C. difficile cells across the different strains by day 1 (see Fig. S7 in the supplemental material). Based upon these results, we conclude that differences in germination rates are unlikely to play a role in the ribotype 027 competitive advantage.
Comparative genomic studies have identified potential candidate genes that could provide ribotype 027 strains an increased competitive advantage over strains of other ribotypes. One such genomic difference is the presence of the thymidylate synthase gene, thyA, in ribotype 027 strains, which has effectively replaced the native, alternative thymidylate synthase gene, thyX, in the form of a four-gene insertion (34). Escartin et al. showed that ThyA enzymes have, on average, 10-fold-higher catalytic rates than ThyX enzymes in vitro and are able to confer higher genome replication rates in vivo (50). Based upon this work, we hypothesize that the presence of thyA in ribotype 027 strains may confer a growth advantage and therefore play a role in competitive fitness. We have also begun assessing whether differences in carbohydrate metabolism between ribotype 027 strains and strains of other ribotypes could provide a competitive advantage. Preliminary studies using phenotypic arrays (Biolog) and follow-up growth studies have revealed differences in metabolism of some carbohydrates by ribotype 027 strains (C. D. Robinson and R. Britton, unpublished results).
In preliminary studies using continuous culture to monitor competition between pure cultures of ribotype 027 strains and other ribotypes, we found that ribotype 027 strains also had a competitive advantage (see Fig. S9 in the supplemental material). It is difficult to make direct comparisons of the competitive indices obtained from these pure-culture competitions and the competition experiments in the presence of the complex microbiota due to differences in flow rates and medium compositions and the presence of other cells. However, it is clear that the magnitude of the competitive advantage observed can be variable between the pure culture and complex-community competitions. Specifically, the ribotype 027 competition pair with a large competitive index in both the complex-community bioreactors and mouse experiments (CD3017-CD1014 [014]; mean competitive indices, 91.4 in community bioreactors and 65.8 in humanized microbiota mice) showed mixed results (mean competitive index, 0.7) in pure-culture competitions. In contrast, the competitive indices among the other ribotype 027 competition pairs tested (CD2015-CD3014 [001] and CD4015-CD2048 [014]) were more similar across the different types of experiments.
These data suggest that multiple mechanisms likely provide a competitive advantage to ribotype 027 strains and that competition in the presence of a complex microbial community may increase the competitive advantage of some ribotype 027 strains.
Colonization resistance by the host microbiota is important in preventing C. difficile infection and must be overcome in order for C. diffcile to proliferate in the colon (4). Factors mediating colonization resistance include competition for nutrients, antagonism by production of inhibitory compounds (such as bacteriocins or short-chain fatty acids), and microbiota-dependent modulation of host immune functions (reviewed in reference 5). Based upon the data that we have presented here, we favor the model in which competition for nutrients plays an important role in the competitive advantage demonstrated by ribotype 027 strains. However, we are also investigating whether any of the other factors mediating colonization resistance could be driving the competition outcome we observe in our models. One hypothesis that we are actively investigating is whether ribotype 027 strains might require less disruption of the microbiota to invade, for example, after shorter antibiotic regimens or after lower doses of antibiotics, which might provide a mechanism by which these strains outcompete strains of other ribotypes in order to become so prevalent in many clinical locations.
Fecal MBRAs as a model for C. difficile invasion.
Our goal was to cultivate complex fecal microbial communities within the MBRAs that could resist invasion by C. difficile, recognizing that these communities would not be 1:1 translations of the starting fecal inoculum. Relative to our initial fecal inoculum, we observed a significant shift in the ratio of members of the phylum Bacteroides to Firmicutes members (Fig. 4B). Bacteroides-dominated communities have been observed in several different in vitro bioreactor models (22, 51–53), which often use media of similar compositions for cultivation. Several parameters can affect the compositions of the microbial communities that are established in fecal bioreactors, including the source of fecal material and how it is processed, the medium composition and turnover time used for cultivation, and the availability of surfaces for biofilm formation (reviewed in reference 54). For example, we chose to pool fecal samples from 12 donors, reasoning that this might lead to an in vitro community that was more representative of the microbial diversity present among different individuals than could be achieved with a single donor. However, by choosing this pooling strategy, we may have selected for communities that would not normally coexist. We have examined the differences between MBRA communities formed from single and pooled fecal samples and found that they exhibit similar C. difficile invasion dynamics (unpublished data). Although modifying different aspects of the operating parameters could lead to communities with higher similarities to the starting fecal inoculum, our results demonstrate that our current model yields complex fecal MBRA communities that resist invasion by C. difficile when unperturbed and that are susceptible when disturbed by antibiotics.
Our MBRA model does not promote invasion of antibiotic-treated communities by C. difficile spores, and thus, we cannot monitor spore germination dynamics in the presence of a fecal microbiota. We are currently attempting to modify the model to enable spore germination within the MBRAs. Determining those aspects of the current model inhibitory to spore germination and outgrowth may also provide new insights into the dynamics between C. difficile and the microbiota.
In spite of the limitations discussed above, the in vitro model that we developed allows robust, higher-throughput studies of C. difficile invasion on shorter time scales than can be accommodated in animal models and other more complex bioreactor models. Therefore, this model can serve as a complement to animal studies by providing a platform for conducting initial, hypothesis-generating experiments, including experiments regarding potential therapeutic treatment of C. difficile infection.
Conclusions.
The data from the present study suggest that ribotype 027 strains have an ecological advantage over other C. difficile ribotypes in the context of the intestinal microbiota. Mixed-species C. difficile infections have been found to occur in 7 to 13% of patients infected with disease (references 55 and 56 and references therein). However, it has been difficult to explore the impact of mixed infection on disease progression due to limitations in the ability to accurately quantify the rate at which mixed infections occur or the dynamics of the mixed strains over time within individual patients (55, 56). Therefore, it is unclear whether direct competition between strains may be occurring during coinfection in patients. We suspect that ribotype 027 strains are able to outcompete strains of other ribotypes in our models of C. difficile infection due to their ability to better exploit the limited resources available within the intestinal communities, demonstrating a fitness advantage that may translate into the human intestinal environment. Finally, this work further demonstrates that, aside from virulence factors such as toxin production and antibiotic resistance, the physiology of C. difficile should be considered an important contributor to its success as a pathogen.
Supplementary Material
ACKNOWLEDGMENTS
We acknowledge Sara McNamara (MDCH) for providing C. difficile strains, Seth Walk (University of Michigan) for ribotyping strains, Robert Stedtfeld (MSU) for designing the minibioreactor arrays, Sara Poe and Kathryn Eaton for collaboration in developing the humanized microbiota mice, and Vince Young (University of Michigan) and Richard Lenski (MSU) for helpful comments regarding the manuscript.
This work was supported by award 5U19AI090872-02 from the National Institutes of Allergy and Infectious Diseases to R.A.B.
Footnotes
Published ahead of print 14 April 2014
Supplemental material for this article may be found at http://dx.doi.org/10.1128/IAI.01524-14.
REFERENCES
- 1.Yassin SF, Young-Fadok TM, Zein NN, Pardi DS. 2001. Clostridium difficile-associated diarrhea and colitis. Mayo Clin. Proc. 76:725–730. 10.4065/76.7.725 [DOI] [PubMed] [Google Scholar]
- 2.Bartlett JG. 1992. Antibiotic-associated diarrhea. Clin. Infect. Dis. 15:573–581. 10.1093/clind/15.4.573 [DOI] [PubMed] [Google Scholar]
- 3.Wiström J, Norrby SR, Myhre EB, Eriksson S, Granström G, Lagergren L, Englund G, Nord CE, Svenungsson B. 2001. Frequency of antibiotic-associated diarrhoea in 2462 antibiotic-treated hospitalized patients: a prospective study. J. Antimicrob. Chemother. 47:43–50. 10.1093/jac/47.1.43 [DOI] [PubMed] [Google Scholar]
- 4.Wilson KH, Freter R. 1986. Interaction of Clostridium difficile and Escherichia coli with microfloras in continuous-flow cultures and gnotobiotic mice. Infect. Immun. 54:354–358 [DOI] [PMC free article] [PubMed] [Google Scholar]
- 5.Britton RA, Young VB. 2012. Interaction between the intestinal microbiota and host in Clostridium difficile colonization resistance. Trends Microbiol. 20:313–319. 10.1016/j.tim.2012.04.001 [DOI] [PMC free article] [PubMed] [Google Scholar]
- 6.Miller BA, Chen LF, Sexton DJ, Anderson DJ. 2011. Comparison of the burdens of hospital-onset, healthcare facility-associated Clostridium difficile infection and of healthcare-associated infection due to methicillin-resistant Staphylococcus aureus in community hospitals. Infect. Control Hosp. Epidemiol. 32:387–390. 10.1086/659156 [DOI] [PubMed] [Google Scholar]
- 7.Loo VG, Poirier L, Miller MA, Oughton M, Libman MD, Michaud S, Bourgault A-M, Nguyen T, Frenette C, Kelly M, Vibien A, Brassard P, Fenn S, Dewar K, Hudson TJ, Horn R, René P, Monczak Y, Dascal A. 2005. A predominantly clonal multi-institutional outbreak of Clostridium difficile-associated diarrhea with high morbidity and mortality. N. Engl. J. Med. 353:2442–2449. 10.1056/NEJMoa051639 [DOI] [PubMed] [Google Scholar]
- 8.Miller M, Gravel D, Mulvey M, Taylor G, Boyd D, Simor A, Gardam M, McGeer A, Hutchinson J, Moore D, Kelly S. 2010. Health care-associated Clostridium difficile infection in Canada: patient age and infecting strain type are highly predictive of severe outcome and mortality. Clin. Infect. Dis. 50:194–201. 10.1086/649213 [DOI] [PubMed] [Google Scholar]
- 9.Pepin J. 2005. Mortality attributable to nosocomial Clostridium difficile-associated disease during an epidemic caused by a hypervirulent strain in Quebec. Can. Med. Assoc. J. 173:1037–1042. 10.1503/cmaj.050978 [DOI] [PMC free article] [PubMed] [Google Scholar]
- 10.Hubert B, Loo VG, Bourgault A-M, Poirier L, Dascal A, Fortin E, Dionne M, Lorange M. 2007. A portrait of the geographic dissemination of the Clostridium difficile North American pulsed-field type 1 strain and the epidemiology of C. difficile-associated disease in Québec. Clin. Infect. Dis. 44:238–244. 10.1086/510391 [DOI] [PubMed] [Google Scholar]
- 11.Bartlett JG. 2006. Narrative review: the new epidemic of Clostridium difficile-associated enteric disease. Ann. Intern. Med. 145:758–764. 10.7326/0003-4819-145-10-200611210-00008 [DOI] [PubMed] [Google Scholar]
- 12.Kuijper EJ, van Dissel JT. 2008. Spectrum of Clostridium difficile infections outside health care facilities. Can. Med. Assoc. J. 179:747–748. 10.1503/cmaj.081211 [DOI] [PMC free article] [PubMed] [Google Scholar]
- 13.McDonald LC, Killgore GE, Thompson A, Owens RC, Kazakova SV, Sambol SP, Johnson S, Gerding DN. 2005. An epidemic, toxin gene-variant strain of Clostridium difficile. N. Engl. J. Med. 353:2433–2441. 10.1056/NEJMoa051590 [DOI] [PubMed] [Google Scholar]
- 14.Morgan OW, Rodrigues B, Elston T, Verlander NQ, Brown DFJ, Brazier J, Reacher M. 2008. Clinical severity of Clostridium difficile PCR ribotype 027: a case-case study. PLoS One 3:e1812. 10.1371/journal.pone.0001812 [DOI] [PMC free article] [PubMed] [Google Scholar]
- 15.Sirard S, Valiquette L, Fortier LC. 2011. Lack of association between clinical outcome of Clostridium difficile infections, strain type, and virulence-associated phenotypes. J. Clin. Microbiol. 49:4040–4046. 10.1128/JCM.05053-11 [DOI] [PMC free article] [PubMed] [Google Scholar]
- 16.Cloud J, Noddin L, Pressman A, Hu M, Kelly C. 2009. Clostridium difficile strain NAP-1 is not associated with severe disease in a nonepidemic setting. Clin. Gastroenterol. Hepatol. 7:868–873.e2. 10.1016/j.cgh.2009.05.018 [DOI] [PubMed] [Google Scholar]
- 17.Walk ST, Micic D, Jain R, Lo ES, Trivedi I, Liu EW, Almassalha LM, Ewing SA, Ring C, Galecki AT. 2012. Clostridium difficile ribotype does not predict severe infection. Clin. Infect. Dis. 55:1661–1668. 10.1093/cid/cis786 [DOI] [PMC free article] [PubMed] [Google Scholar]
- 18.Walker AS, Eyre DW, Wyllie DH, Dingle KE, Griffiths D, Shine B, Oakley S, O'Connor L, Finney J, Vaughan A, Crook DW, Wilcox MH, Peto TEA. 2013. Relationship between bacterial strain type, host biomarkers, and mortality in Clostridium difficile infection. Clin. Infect. Dis. 56:1589–1600. 10.1093/cid/cit127 [DOI] [PMC free article] [PubMed] [Google Scholar]
- 19.Hensgens MPM, Goorhuis A, Dekkers OM, van Benthem BHB, Kuijper EJ. 2013. All-cause and disease-specific mortality in hospitalized patients with Clostridium difficile infection: a multicenter cohort study. Clin. Infect. Dis. 56:1108–1116. 10.1093/cid/cis1209 [DOI] [PubMed] [Google Scholar]
- 20.He M, Miyajima F, Roberts P, Ellison L, Pickard DJ, Martin MJ, Connor TR, Harris SR, Fairley D, Bamford KB, D'Arc S, Brazier J, Brown D, Coia JE, Douce G, Gerding D, Kim HJ, Koh TH, Kato H, Senoh M, Louie T, Michell S, Butt E, Peacock SJ, Brown NM, Riley T, Songer G, Wilcox M, Pirmohamed M, Kuijper E, Hawkey P, Wren BW, Dougan G, Parkhill J, Lawley TD. 2013. Emergence and global spread of epidemic healthcare-associated Clostridium difficile. Nat. Genet. 45:109–113. 10.1038/ng.2478 [DOI] [PMC free article] [PubMed] [Google Scholar]
- 21.Waslawski S, Lo ES, Ewing SA, Young VB, Aronoff DM, Sharp SE, Novak-Weekley SM, Crist AE, Dunne WM, Hoppe-Bauer J, Johnson M, Brecher SM, Newton DW, Walk ST. 2013. Clostridium difficile ribotype diversity at six healthcare institutions in the United States. J. Clin. Microbiol. 51:1938–1941. 10.1128/JCM.00056-13 [DOI] [PMC free article] [PubMed] [Google Scholar]
- 22.Freeman J. 2003. Effects of cefotaxime and desacetylcefotaxime upon Clostridium difficile proliferation and toxin production in a triple-stage chemostat model of the human gut. J. Antimicrob. Chemother. 52:96–102. 10.1093/jac/dkg267 [DOI] [PubMed] [Google Scholar]
- 23.Honda H, Hoyles L, Gibson G. 2011. Impact of GanedenBC30 (Bacillus coagulans GBI-30, 6086) on population dynamics of the human gut microbiota in a continuous culture fermentation system. Int. J. Probiotics Prebiotics 6:65–72 [Google Scholar]
- 24.Baines SD, Crowther GS, Todhunter SL, Freeman J, Chilton CH, Fawley WN, Wilcox MH. 2013. Mixed infection by Clostridium difficile in an in vitro model of the human gut. J. Antimicrob. Chemother. 68:1139–1143. 10.1093/jac/dks529 [DOI] [PubMed] [Google Scholar]
- 25.Sorg JA, Dineen SS. 2005. Laboratory maintenance of Clostridium difficile. John Wiley & Sons, Inc., Hoboken, NJ: [DOI] [PubMed] [Google Scholar]
- 26.Antonopoulos DA, Huse SM, Morrison HG, Schmidt TM, Sogin ML, Young VB. 2009. Reproducible community dynamics of the gastrointestinal microbiota following antibiotic perturbation. Infect. Immun. 77:2367–2375. 10.1128/IAI.01520-08 [DOI] [PMC free article] [PubMed] [Google Scholar]
- 27.Human Microbiome Project Consortium. 2012. Structure, function and diversity of the healthy human microbiome. Nature 486:207–214. 10.1038/nature11234 [DOI] [PMC free article] [PubMed] [Google Scholar]
- 28.Schloss PD. 2009. A high-throughput DNA sequence aligner for microbial ecological studies. PLoS One 4:e8230. 10.1371/journal.pone.0008230 [DOI] [PMC free article] [PubMed] [Google Scholar]
- 29.Schloss PD, Gevers D, Westcott SL. 2011. Reducing the effects of PCR amplification and sequencing artifacts on 16S rRNA-based studies. PLoS One 6:e27310. 10.1371/journal.pone.0027310 [DOI] [PMC free article] [PubMed] [Google Scholar]
- 30.Edgar RC, Haas BJ, Clemente JC, Quince C, Knight R. 2011. UCHIME improves sensitivity and speed of chimera detection. Bioinformatics 27:2194–2200. 10.1093/bioinformatics/btr381 [DOI] [PMC free article] [PubMed] [Google Scholar]
- 31.Schloss PD, Westcott SL. 2011. Assessing and improving methods used in operational taxonomic unit-based approaches for 16S rRNA gene sequence analysis. Appl. Environ. Microbiol. 77:3219–3226. 10.1128/AEM.02810-10 [DOI] [PMC free article] [PubMed] [Google Scholar]
- 32.White JR, Nagarajan N, Pop M. 2009. Statistical methods for detecting differentially abundant features in clinical metagenomic samples. PLoS Comput. Biol. 5:e1000352. 10.1371/journal.pcbi.1000352 [DOI] [PMC free article] [PubMed] [Google Scholar]
- 33.Oksanen J, Blanchet FG, Kindt R, Legendre P, Minchin PR, O'Hara RB, Simpson GL, Solymos P, Stevens MHH, Wagner H. 2013. vegan: Community Ecology Package. R package version 2.0-9. http://CRAN.R-project.org/package=vegan [Google Scholar]
- 34.Knetsch CW, Hensgens MPM, Harmanus C, van der Bijl MW, Savelkoul PHM, Kuijper EJ, Corver J, van Leeuwen HC. 2011. Genetic markers for Clostridium difficile lineages linked to hypervirulence. Microbiology 157:3113–3123. 10.1099/mic.0.051953-0 [DOI] [PubMed] [Google Scholar]
- 35.Pfaffl MW. 2001. A new mathematical model for relative quantification in real-time RT-PCR. Nucleic Acids Res. 29:e45. 10.1093/nar/29.9.e45 [DOI] [PMC free article] [PubMed] [Google Scholar]
- 36.Chen X, Katchar K, Goldsmith JD, Nanthakumar N, Cheknis A, Gerding DN, Kelly CP. 2008. A mouse model of Clostridium difficile-associated disease. Gastroenterology 135:1984–1992. 10.1053/j.gastro.2008.09.002 [DOI] [PubMed] [Google Scholar]
- 37.Bartlett JG. 1981. Antimicrobial agents implicated in Clostridium difficile toxin-associated diarrhea of colitis. Johns Hopkins Med. J. 149:6–9 [PubMed] [Google Scholar]
- 38.Stackebrandt E, Goebel BM. 1994. Taxonomic note: a place for DNA-DNA reassociation and 16S rRNA sequence analysis in the present species definition in bacteriology. Int. J. Syst. Bacteriol. 44:846–849. 10.1099/00207713-44-4-846 [DOI] [Google Scholar]
- 39.Koeppel AF, Wu M. 2013. Surprisingly extensive mixed phylogenetic and ecological signals among bacterial operational taxonomic units. Nucleic Acids Res. 41:5175–5188. 10.1093/nar/gkt241 [DOI] [PMC free article] [PubMed] [Google Scholar]
- 40.Jernberg C, Löfmark S, Edlund C, Jansson JK. 2010. Long-term impacts of antibiotic exposure on the human intestinal microbiota. Microbiology 156:3216–3223. 10.1099/mic.0.040618-0 [DOI] [PubMed] [Google Scholar]
- 41.Clarke KR. 1993. Non-parametric multivariate analyses of changes in community structure. Aust. J. Ecol. 18:117–143. 10.1111/j.1442-9993.1993.tb00438.x [DOI] [Google Scholar]
- 42.Reeves AE, Theriot CM, Bergin IL, Huffnagle GB, Schloss PD, Young VB. 2011. The interplay between microbiome dynamics and pathogen dynamics in a murine model of Clostridium difficile Infection. Gut Microbes 2:145–158. 10.4161/gmic.2.3.16333 [DOI] [PMC free article] [PubMed] [Google Scholar]
- 43.Antharam VC, Li EC, Ishmael A, Sharma A, Mai V, Rand KH, Wang GP. 2013. Intestinal dysbiosis and depletion of butyrogenic bacteria in Clostridium difficile infection and nosocomial diarrhea. J. Clin. Microbiol. 51:2884–2892. 10.1128/JCM.00845-13 [DOI] [PMC free article] [PubMed] [Google Scholar]
- 44.Carlson PE, Walk ST, Bourgis AET, Liu MW, Kopliku F, Lo E, Young VB, Aronoff DM, Hanna PC. 2013. The relationship between phenotype, ribotype, and clinical disease in human Clostridium difficile isolates. Anaerobe 24:109–116. 10.1016/j.anaerobe.2013.04.003 [DOI] [PMC free article] [PubMed] [Google Scholar]
- 45.Merrigan M, Venugopal A, Mallozzi M, Roxas B, Viswanathan VK, Johnson S, Gerding DN, Vedantam G. 2010. Human hypervirulent Clostridium difficile strains exhibit increased sporulation as well as robust toxin production. J. Bacteriol. 192:4904–4911. 10.1128/JB.00445-10 [DOI] [PMC free article] [PubMed] [Google Scholar]
- 46.Akerlund T, Persson I, Unemo M, Noren T, Svenungsson B, Wullt M, Burman LG. 2008. Increased sporulation rate of epidemic Clostridium difficile type 027/NAP1. J. Clin. Microbiol. 46:1530–1533. 10.1128/JCM.01964-07 [DOI] [PMC free article] [PubMed] [Google Scholar]
- 47.Burns DA, Heeg D, Cartman ST, Minton NP. 2011. Reconsidering the sporulation characteristics of hypervirulent Clostridium difficile BI/NAP1/027. PLoS One 6:e24894. 10.1371/journal.pone.0024894 [DOI] [PMC free article] [PubMed] [Google Scholar]
- 48.Francis MB, Allen CA, Sorg JA. 2013. Muricholic acids inhibit Clostridium difficile spore germination and growth. PLoS One 8:e73653. 10.1371/journal.pone.0073653 [DOI] [PMC free article] [PubMed] [Google Scholar]
- 49.Heeg D, Burns DA, Cartman ST, Minton NP. 2012. Spores of Clostridium difficile clinical isolates display a diverse germination response to bile salts. PLoS One 7:e32381. 10.1371/journal.pone.0032381 [DOI] [PMC free article] [PubMed] [Google Scholar]
- 50.Escartin F, Skouloubris S, Liebl U, Myllykallio H. 2008. Flavin-dependent thymidylate synthase X limits chromosomal DNA replication. Proc. Natl. Acad. Sci. U. S. A. 105:9948–9952. 10.1073/pnas.0801356105 [DOI] [PMC free article] [PubMed] [Google Scholar]
- 51.Van den Abbeele P, Grootaert C, Marzorati M, Possemiers S, Verstraete W, Gérard P, Rabot S, Bruneau A, Aidy El S, Derrien M, Zoetendal E, Kleerebezem M, Smidt H, Van de Wiele T. 2010. Microbial community development in a dynamic gut model is reproducible, colon region specific, and selective for Bacteroidetes and Clostridium cluster IX. Appl. Environ. Microbiol. 76:5237–5246. 10.1128/AEM.00759-10 [DOI] [PMC free article] [PubMed] [Google Scholar]
- 52.Macfarlane GEA. 1998. Validation of a three-stage compound continuous culture system for investigating the effect of retention time on the ecology and metabolism of bacteria in the human colon. Microb. Ecol. 35:180–187. 10.1007/s002489900072 [DOI] [PubMed] [Google Scholar]
- 53.Rajilic-Stojanovic M, Maathuis A, Heilig HGHJ, Venema K, de Vos WM, Smidt H. 2010. Evaluating the microbial diversity of an in vitro model of the human large intestine by phylogenetic microarray analysis. Microbiology 156:3270–3281. 10.1099/mic.0.042044-0 [DOI] [PubMed] [Google Scholar]
- 54.Payne AN, Zihler A, Chassard C, Lacroix C. 2012. Advances and perspectives in in vitro human gut fermentation modeling. Trends Biotechnol. 30:17–25. 10.1016/j.tibtech.2011.06.011 [DOI] [PubMed] [Google Scholar]
- 55.Eyre DW, Cule ML, Griffiths D, Crook DW, Peto TEA, Walker AS, Wilson DJ. 2013. Detection of mixed infection from bacterial whole genome sequence data allows assessment of its role in Clostridium difficile transmission. PLoS Comput. Biol. 9:e1003059. 10.1371/journal.pcbi.1003059 [DOI] [PMC free article] [PubMed] [Google Scholar]
- 56.Behroozian AA, Chludzinski JP, Lo ES, Ewing SA, Waslawski S, Newton DW, Young VB, Aronoff DM, Walk ST. 2013. Detection of mixed populations of Clostridium difficile from symptomatic patients using capillary-based polymerase chain reaction ribotyping. Infect. Control Hosp. Epidemiol. 34:961–966. 10.1086/671728 [DOI] [PMC free article] [PubMed] [Google Scholar]
Associated Data
This section collects any data citations, data availability statements, or supplementary materials included in this article.