

Abstract
Microvilli are membrane extensions on the apical surface of polarized epithelia, such as intestinal enterocytes and tubule and duct epithelia. One notable exception in mucosal epithelia is M cells, which are specialized for capturing luminal microbial particles; M cells display a unique apical membrane lacking microvilli. Based on studies of M cell uptake under different ionic conditions, we hypothesized that microvilli may augment the mucosal barrier by providing an increased surface charge density from the increased membrane surface and associated glycoproteins. Thus, electrostatic charges may repel microbes from epithelial cells bearing microvilli, while M cells are more susceptible to microbial adhesion. To test the role of microvilli in bacterial adhesion and uptake, we developed polarized intestinal epithelial cells with reduced microvilli (“microvillus-minus,” or MVM) but retaining normal tight junctions. When tested for interactions with microbial particles in suspension, MVM cells showed greatly enhanced adhesion and uptake of particles compared to microvillus-positive cells. This preference showed a linear relationship to bacterial surface charge, suggesting that microvilli resist binding of microbes by using electrostatic repulsion. Moreover, this predicts that pathogen modification of electrostatic forces may contribute directly to virulence. Accordingly, the effacement effector protein Tir from enterohemorrhagic Escherichia coli O157:H7 expressed in epithelial cells induced a loss of microvilli with consequent enhanced microbial binding. These results provide a new context for microvillus function in the host-pathogen relationship, based on electrostatic interactions.
INTRODUCTION
Polarized epithelial cells such as intestinal and kidney tubule epithelial cells are exposed to a wide range of aqueous environments with rapidly changing ionic and osmotic conditions (1–4). Despite these dynamic conditions, these epithelia must retain their barrier function and provide resistance to microbial adhesion and invasion. In the mucosal and airway epithelia, a layer of mucus also augments the barrier, although mucus is not an intrinsic component of the epithelium and is not present at all epithelial surfaces. A common feature of polarized epithelial cells is the development of apical brush border microvilli, which display various transporter proteins and ion channels to facilitate small-molecule and ion movement across the cell membrane (5, 6). While the apical brush border increases the surface area for these functions, it may also risk the increased availability of attachment sites for microbial invasion. An apparent paradoxical situation is presented by intestinal epithelium M (microfold) cells, which are commonly found overlying mucosal organized lymphoid tissues (7, 8); these cells are specialized for the capture and uptake of luminal microbes, yet they are morphologically distinctive by their absence of apical microvilli.
We recently observed that M cell uptake of nanoparticles in aqueous suspensions in mouse nasal passages in vivo could be enhanced by the use of small targeting ligands, but the influence of ionic conditions could be far more potent (9). Interestingly, in lower-ionic-strength buffers, M cell particle uptake was enhanced, yet under these conditions, the negative charge of both the particles and mucosal epithelium should have resulted in substantial electrostatic repulsion occurring between them. Historically, using DLVO (Derjaguin, Landu, Verwey, and Overbeek)-based approaches, it has been well documented that most if not all bacterial species are negatively charged, although they are still capable of making their way across the mucosal barrier (10–12). Since brush border microvilli present a variety of charged molecular species, including polar carbohydrates and charged amino acid side chains, it was possible that the negative charge of the microvilli generates a high-density electrostatic charge at the enterocytes' apical surface, driving particles toward the more neutral M cell surface. In line with this notion, a previous study by Mutsaers et al. (13) demonstrated that the proportion of microvilli on healing mesothelium alters the level of glycocalyx and relative membrane surface charge, and while intestinal epithelial cells have a glycocalyx layer that protrudes 400 to 500 nm past the tip of their microvilli, M cells lack this layer (13–15). However, it has not been determined whether changes in global electrostatic charge due to apical cell surface morphology play a role in dictating bacterial binding; thus, we sought to test the hypotheses that brush border microvilli contribute to the mucosal epithelium barrier using electrostatic repulsion and, conversely, that the ability of M cells to capture microbial particles is related in part to lower electrostatic repulsion.
To develop an in vitro test for the potential contribution of surface charge as an effective electrostatic barrier, we compared a cell model of brush border epithelium with modified cell lines designed to specifically impair microvillus formation. Using a series of assays for the adhesion or uptake of microbes or synthetic particles by these epithelial cells, including both static and laminar flow conditions, we found that bacterial adhesion to epithelial cells was markedly affected by the presence of microvilli. Quantification of this effect showed an apparent relationship to the surface charge of the microbial particles. Our results support the notion that microvilli provide a barrier to microbial invasion through electrostatic repulsion, and in turn, microbial virulence can in some cases be related to the ability to manipulate this barrier effect.
MATERIALS AND METHODS
Bacterial strains.
Cloning of genes was performed with Escherichia coli strain DH5α. Strains of E. coli were grown in Luria-Bertani (LB) broth, and growth medium was supplemented with antibiotics, based on plasmid resistance. For functional assays, the following bacterial strains were used: Staphylococcus aureus strain RN4220 transformed with a green fluorescent protein (GFP) reporter plasmid (kindly provided by A. R. Horswill); Yersinia enterocolitica strain SL1344 (kindly provided by J. Mecsas); a clinical isolate of Enterococcus faecalis (kindly provided by N. Schiller); E. coli O157:H7; and Salmonella enterica serovar Typhimurium IR715 wild-type (WT), ΔinvA IR715, and ΔsipA ΔsopE2 ΔsopB ΔsopA ΔsopD ZA21 strains (kindly provided by M. Raffatellu). All Salmonella strains were transformed with a vector containing enhanced GFP (EGFP) (kindly provided by C. R. Nagler) by using the Amaxa Nucleofector system. For all assays performed in this study, bacteria were grown in normal LB broth at 37°C and agitated at 300 rpm overnight. In the case of adherence assays, bacterial cultures were pelleted at 2,000 × g for 20 min, resuspended in 150 mM phosphate-buffered saline (PBS), and fixed with a 1% paraformaldehyde–PBS solution for 10 min at room temperature. For uptake assays, cultures grown overnight were diluted 1:10 and then grown to mid-log phase (optical density at 600 nm [OD600] of 0.6).
Cloning of genes for transfection.
Cloning of the EPI64LA gene was accomplished by using PCR amplification from cDNA isolated from the Caco2BBe cell line, using a reverse primer encoding an alanine residue downstream of the C-terminal leucine residue and upstream of the KpnI restriction site and a forward primer containing a HindIII site upstream of the transcriptional start site of the EPI64 (EBP50 and PDZK interactor of 64 kDa) gene (NCBI GenBank accession number AF331038.1). Overlap PCR was performed to fuse EPI64LA to DsRed, which was cloned from the PCMV-dsRed-Express2 vector (Clontech). Finally, EPI64LA-DsRed was ligated into the pcDNA vector (pcDNA-EPI64LA-DsRed). Tir was cloned from genomic DNA from E. coli O157:H7 by using a forward primer containing an upstream KpnI site and a reverse primer containing a downstream XhoI site (GenBank accession number NZ_AERR01000033.1; GI:485657470). Tir was then cloned into the pcDNA plasmid (pcDNA-Tir). All genes were sequenced to verify the correct DNA sequence.
Development of stably transfected lines.
Caco2BBe cells (ATCC CRL-2102) were obtained from the American Type Culture Collection. Caco2BBe cells were cultured in medium comprised of advanced Dulbecco's modified Eagle medium (ADMEM; Gibco) plus 10% fetal bovine serum (FBS; Biowest), 1% penicillin-streptomycin-glutamine (Cellgro), and 1% HEPES buffer (Cellgro) and grown at 37°C in 5% CO2. An Amaxa Nucleofection T kit (Lonza) was used to transfect Caco2BBe cells with either pcDNA-EPI64LA-DsRed or pcDNA-Tir. One day after transfection, transfected cells were placed under selection with 1,500 ng/μl of Geneticin (Corning) for cells transfected with pcDNA-EPI64LA-DsRed and 50 ng/μl of hygromycin (Life Technologies) for cells transfected with pcDNA-Tir. Limiting dilution was used to generate clonal cell populations, which were subjected to multiple rounds of screening to identify cells with the expected phenotype.
Immunohistochemistry and confocal microscopy.
In order to visualize cells by using confocal microscopy, cell cultures were fixed with 1% paraformaldehyde–PBS and then permeabilized first with cytoskeleton buffer followed by 0.5% Tween 20–PBS. Cultures were then blocked in 0.1% Tween 20 in casein solution (Thermo Scientific). Monolayers were stained with phalloidin (647 nm) (Life Technologies) to visualize apical microvilli, fixed with 4% paraformaldehyde–PBS, and mounted with Prolong Gold antifade reagent (Life Technologies). DAPI (4′,6-diamidino-2-phenylindole) was used as a nuclear counterstain. Images were obtained by using a BD CarvII spinning-disk confocal imager (BD Biosystems) attached to a Zeiss Axio Observer inverted microscope. Hardware, including the confocal microscope and digital camera (Diagnostic Instrument Xplorer-XS and Qimaging Rolera EMC2), was controlled by using both BD IPlabs and Metamorph imaging software. Images were further optimized by using Volocity deconvolution software. Phalloidin quantification was carried out by using Volocity software, where nuclei were first identified and a diameter was set to 10 μm from each nuclei. The intensity of phalloidin over the nuclei and 10 μm away from the nuclei was determined.
Flow cytometry.
Cells were grown in 96-well cluster plates in selective medium. On the day of the experiment, cells were detached from plates by using a trypsin-EDTA solution (Gibco) and moved into 2-ml round-bottom tubes. Cells were washed three times in PBS, and data were collected by using a FACSCalibur instrument (Becton, Dickinson) equipped with CellQuest Pro software (BD Biosciences). Data analysis was performed by using FlowJo software (Tree Star).
Quantitative and semiquantitative PCRs.
Cell monolayers were cultured in 6-well cluster plates, and RNA was extracted by using an RNeasy Plus minikit (Qiagen). Using the Superscript III first-strand synthesis system (Life Technologies), 1 or 3 μg of total RNA from each sample was used to generate cDNA. The SYBR green assay (Bio-Rad) and the Bio-Rad CFX96 detection system (Bio-Rad) were used to detect real-time PCR products from 10 μl of the reverse-transcribed RNA (1:10 dilution) samples (from a 20-μl total volume). Human glyceraldehyde-3-phosphate dehydrogenase (GAPDH) was used as a reference gene for all quantitative PCRs (qPCRs). Primers used in qPCR assays were described previously (16). The comparative ΔΔCT method was used to determine the relative amount of gene expression. In semiquantitative PCRs, a reaction mixture volume of 20 μl was used. For PCR, a total of 4 μl of template cDNA was added, and 2× Taq master mix (NEB) was used to carry out the PCR. Human GAPDH was used as the reference gene. For Tir, a cycle number of 35 was used, and for GAPDH, a cycle number of 30 was used.
Zeta potential measurements.
The zeta potentials of all bacteria were measured by using laser Doppler electrophoresis (Zetasizer Nano ZS90; Malvern Instruments), based on methods described previously by Rajapaksa et al. (9). Briefly, bacteria were diluted to a concentration of 8 × 10⁷ bacteria per 1.5 ml. Diluted samples were moved to folded capillary cells (Malvern), and zeta potentials were quantified based on the Smoluchowski-Helmholtz relationship equation, where UE is the electrophoretic mobility, ε is the dielectric constant; f(Ka) is the Henry function, set to 1.5 (Smoluchowski approximation); η is the viscosity of the buffer; and ζ is the zeta potential. For measurements of synthetic particles, 1 mg of lyophilized particle pellet was suspended in 150 mM PBS. All measurements were run in triplicate in each individual experiment; experiments were repeated 3 times.
| (1) |
Microbial adhesion to hydrocarbons (MATH).
Based on a method previously described by Rosenberg et al. (17, 18), to determine bacterial particle hydrophobicity, bacterial culture ODs were normalized to 1.0 at a wavelength of 400 nm. Four milliliters of culture was added to various volumes of n-dodecane (Sigma-Aldrich). The tubes were vigorously vortexed for 2 min and left to stand for 15 min at room temperature to allow the organic and aqueous phases to separate. The aqueous phase was carefully removed, and the OD was measured at 400 nm by using a SoftMaxPro SpectraMax M2 spectrometer. The percentage of bacteria bound to hydrocarbon was determined by subtracting the absorbance reading from 1. Hydrophobicity plots represent three individual experiments.
Scanning electron microscopy.
Cell monolayers were grown on glass-bottom petri dishes. Cell monolayers were fixed by first adding a 2.5% glutaraldehyde (Ted Pella) solution for 30 min. Samples were then washed in double-distilled water (ddH2O), and 4% osmium tetroxide (Ted Pella) was added for 30 min. Samples were then dehydrated by using 25%, 50%, 75%, 90%, and 100% ethanol for 5, 5, 5, 5, and 10 min, respectively. Dehydrated samples remained immersed in 100% ethanol until critical-point drying was performed. Critical-point drying was performed by using a Balzar critical-point dryer (CPD). Samples immersed in 100% ethanol (transferring liquid) were quickly moved to transfer baskets, and the chamber of the CPD was filled with enough ethanol to cover the basket; the transferring liquid was slowly swapped with CO2 (drying gas). Once all traces of transferring liquid were removed from the chamber, the CO2 within the chamber was slowly heated to 42°C, and pressure was brought to 1,230 lb/in2 (actual critical temperature of 31°C and pressure of 1,072 lb/in2). Pressure was slowly released within the chamber, and samples were then mounted onto scanning electron microscopy (SEM) pin stub mounts (Ted Pella) with carbon-coated conductive tape and finally sputter coated with platinum/palladium for 60 s (Cressington 108 Auto sputter coater). The apical surface of cells was then viewed by using an XL-30 FEG scanning electron microscope at 10 kV.
Glycoprotein staining and quantification.
Cell monolayers were grown in 6-well cluster plates, and cells were lysed with a 1% Triton X-100 solution. The cell lysate was shredded and agitated for 30 min at 4°C. The protein concentration of the cell lysate was determined by using a Bradford assay (19). All protein concentrations were normalized based on the lowest protein concentration. Samples were run on 4 to 12% Bis-Tris gels (Life Technologies) and transferred onto nitrocellulose. The nitrocellulose membrane was then stained for glycoprotein content by using a Pierce glycoprotein staining kit (Thermo Scientific). Briefly, the membrane was first washed with 3% acetic acid for 10 min, transferred into an oxidizing solution for 15 min, and again washed in acetic acid. The membrane was then placed into the glycoprotein staining solution for 15 min and then placed into the reducing solution. The membrane was washed with 3% acetic acid and ddH2O and then scanned along the length of each sample lane (rather than any individual band), and the signal integrated for each lane was quantified by using ImageJ software (NIH). Staining was performed on four individual cell monolayers.
TEER measurements.
Transepithelial electrical resistance (TEER) was measured by using an Evomx Epithelial Voltohmmeter (World Precision Instruments). Monolayers were cultured on 5.0-μm-pore-size polycarbonate membrane transwells with a 1.12-cm2 area (Costar); selective medium was added to both the top and bottom of the transwell insert. Before TEER measurements were performed, the microelectrodes of the Evomx Voltohmmeter were washed in 70% ethanol for 15 min and equilibrated in culture medium. Microelectrodes were placed straddling the transwell insert, resistance was determined for blank transwells (RB) and transwells containing cell monolayers (Rtotal), and electrical resistance of the cell monolayer alone was determined as Rc = Rtotal − RB. All measurements were run in triplicate in each individual experiment; experiments were repeated 3 times.
Synthetic microparticle formulations.
Poly(lactic-coglycolic acid) (PLGA) particles were prepared by using solvent evaporation/double (water-in-oil-in-water) emulsion based on a method described previously by Rajapaksa et al. (9). Nanoparticles were then produced with a calibrated surface charge, confirmed by using a Zetasizer; for preparation of cationic particles (positively charged), 2% CTAB (cetyl trimethylammonium bromide) was added to the PLGA solution, and for preparation of anionic particles (negatively charged), 2% DSS (dioctyl sodium sulfosuccinate) was added to the PLGA solution. Particle morphology was determined by using SEM, and the particle diameter was measured by using ImageJ.
Epithelial cell uptake assays.
For bacterial uptake assays (modified from methods described in reference 20), cells were grown in 12-well cluster plates in selective medium. New medium lacking antibiotics was added on the day that assays were performed. Bacteria were grown in antibiotic-selective LB medium overnight. Cultures grown overnight were diluted (1:10) and grown to an OD600 of 0.6. Bacteria were counted and added to monolayers at a 50:1 infection ratio. Plates were centrifuged for 5 min at 500 × g and then incubated for 2 h. Cell cultures were then washed 3 times with PBS, and medium containing 100 μg/ml gentamicin was added. Cells were again incubated at 37°C for 2 h to kill off any extracellular bacteria. Cell monolayers were washed, and trypsin and 0.02% Triton X-100 were added to detach and lyse cells. Cells were then plated onto LB agar plates, incubated at 37°C, and counted after 18 h. Assays were duplicated with two biological replicates. Finally, ratios between MVM cells and WT cells were determined and plotted against the bacterial surface charge.
Epithelial cell adherence assay.
Assays were performed on monolayers grown on collagen-coated chamber slides in selective medium (BD Biosciences). Bacteria were added at a 200:1 infection ratio and were allowed to attach for 1 h at room temperature (to limit effects of endocytosis). Slides were then imaged with a spinning-disk confocal microscope (BD CarvII system). Bacteria were counted by using Volocity software, where intensity and size parameters were set to help distinguish bacteria from the background. For particle adherence, the same procedure was followed, but 1 mg lyophilized particles was diluted in 2 ml of PBS. Ratios were determined and plotted against fixed bacterial zeta potentials. Experiments were repeated 3 times.
Dynamic adherence assay using a parallel flow chamber.
Assays of bacterial deposition under flow conditions were performed by using a parallel-plate flow chamber comprised of a Plexiglas block, a flexible silicon elastomer gasket, and a microscope slide. Monolayers of cells were grown directly on microscope slides (SuperFrost; Fischer Scientific). On the day of the experiment, cells were stained with Hoechst dye (Life Technologies) for easy viewing of the cells. Chambers were sealed with a thin film of vacuum grease on the gasket. The parallel flow chamber was installed on a BD CarvII confocal imager (BD Biosystems). Fluorescent bacteria were diluted in 150 mM PBS to an approximate concentration of 107 bacteria/ml and were added to a 30-ml syringe attached to a syringe pump (KD Scientific). Bacteria were injected at a constant flow rate (q) of 1.5 ml/min (or a mean velocity of 11.25 m/h), estimated to be the physiological flow rate of the small intestine in the fed state. Bacterial accumulation was documented for 10 min, with pictures being taken every 60 s. Flow in the chamber was kept in the laminar regime (based on the Reynolds number) to reduce the effects of shear forces. The deposition rate (k) of bacteria was determined by first linear regressing on the raw bacterial counts over time to obtain the slope J (deposition flux) and then dividing the slope by the initial concentration of bacteria:
| (2) |
| (3) |
| (4) |
Statistical tests and analysis.
All data were expressed as means ± standard errors of the means. Normality was checked, and either the unpaired Student t test was used to make comparisons between two groups or one-way analysis of variance (ANOVA) was used to make comparisons between three or more groups with one variable in common, as indicated in the figure legends. All statistical calculations were performed by using GraphPad Prism version 5.0. Graphs were made by using GraphPad Prism version 5.04. A P value of <0.05 was considered statistically significant.
RESULTS
Establishment of microvillus-minus cells.
Our working hypothesis is that the increased apical membranes associated with microvilli provide increased numbers of charged molecular species at the apical surface, resulting in an increased local electrostatic charge. Therefore, to directly alter the apical surface of polarized epithelial cells, we generated “microvillus-minus” (MVM) cells on the principle that reducing the numbers of apical microvilli without altering other features of the epithelium (e.g., tight junctions) would affect mainly the apical electrostatic charge. Although the intestinal epithelium is also covered by mucus, this in vitro model does not incorporate mucus-producing cells; however, since many wetted epithelia (e.g., duct and tubular epithelia) do not produce mucus, our system tests only the effect of apical microvilli on particle adhesion. In addition, all of our studies were performed by using epithelial monolayers on solid surfaces such as plastic dishes or glass; while growth of epithelial cells might be different from growth on transwell filters, where nutrients can reach the basolateral side of cells, these culture effects should affect all cell lines equally.
To modify the polarized epithelial cells by targeting only the microvilli, MVM cells were generated by stably transfecting Caco2BBe cells (21) with a mutant form of EPI64 (EBP50 and PDZK interactor of 64 kDa [22–25]) fused to DsRed (EPI64LA-DsRed), providing a dominant negative disruptor of microvillus actin filament formation (Fig. 1A). The resulting MVM cells exhibited lower apical F-actin levels than did WT Caco2BBe cells (Fig. 1B) and reduced levels of apical microvilli by high-resolution scanning electron microscopy (SEM) (Fig. 1C). Despite the loss of microvilli, the apical dimensions were similar to those of WT Caco2BBe cells, and tight junction formation was not impaired, as assessed by tight junction protein localization and transepithelial electrical resistance (TEER) (see Fig. S1A in the supplemental material). Certain genes (CD137, GP2, and β1 integrin) have been identified as being important for M cells in the binding and capture of pathogenic microbes (“capture receptor hypothesis”) (16, 26–28); however, MVM cells showed no induction of these genes compared to a cytokine-treated cell model (known to induce these genes) (see Fig. S1B in the supplemental material). Other proteins with a potential effect on cell charge, such as positively charged antimicrobial peptides, might also be induced; in the case of antimicrobial peptides, however, we would expect that because these short peptides are secreted, they would have minimal direct effects on the apical membrane surface charge.
FIG 1.

Development of microvillus-minus (MVM) cell lines by using Caco2BBe. (A) Flow cytometry histograms showing that WT Caco2BBe cells transfected with EPI64LA-DsRed have stable expression of DsRed protein (solid lines) compared to the WT unmanipulated control (dotted lines). (B) Confocal micrographs showing DsRed (red) expression and decreased phalloidin/F-actin staining (green) compared to WT cells. Phalloidin intensity was quantified, and significance was determined by unpaired Student's t test. ***, P < 0.0005. (C) Scanning electron micrographs confirm that MVM cells have few apical microvilli compared to WT cells.
Would manipulation of apical microvilli be sufficient to alter apical surface charge? Direct measurements of apical electrostatic charge are unfortunately particularly challenging for live cells. Methods for analysis of the apical glycocalyx are limited largely to morphological analyses, and it is not clear which glycoproteins (including glycosylphosphatidylinositol-anchored glycoproteins) make the most important contributions to microvillus surface electrostatic charge. Surface charge can be measured for particles or cells in suspension (see below), but this cannot indicate local electrostatic charge on the apical surface of polarized epithelia. An indirect indication of the contribution of microvilli to the cell's apical surface charge might be derived by measuring the cell's glycoprotein content; this is based on the assumption that glycoproteins are associated mainly with the plasma membrane and that they most directly contribute to the cell surface charge. Accordingly, a stain for glycoprotein from cell extracts was used to measure glycoprotein content, normalized for total protein. This method is based on the periodic acid-Schiff (PAS) method, which detects proteins bearing sialic acid or other oxidizable carbohydrate groups. Integrating the stain signal along the whole gel lane of each cell type showed an approximately 40% reduction of glycoprotein in MVM cells compared to WT Caco2BBe cells (Fig. 2), consistent with the notion that the membrane extensions associated with microvilli are a major contributor to apical cell surface charge.
FIG 2.
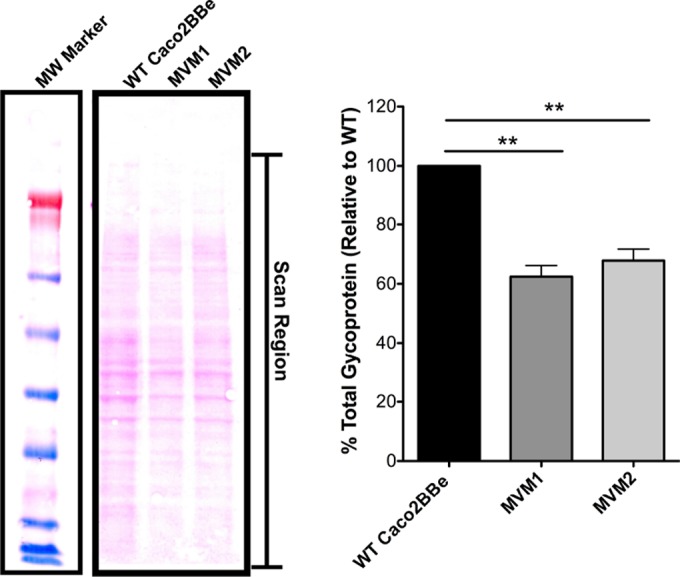
Quantification of cell glycoprotein content in cells with or without microvilli. Cell lysate total glycoprotein levels were quantified by integrating the full scanned density of each lane, as indicated in the figure. MVM cells showed glycoprotein levels that were approximately 40% lower than those of WT cells. Error bars represent standard errors of the means (n = 4); significance was determined by using paired Student's t test (relative values were taken). MW, molecular weight marker. **, P < 0.005.
To assess the effects of impaired microvillus formation on bacterial adhesion and uptake, we used a series of different assays, described below, intended to assess the ability of suspended particles to adhere to the surface of epithelial cell monolayers. First, we used an indirect measure of adhesion relying on the consequent endocytosis of live bacteria by epithelial cells. Second, we performed a direct assay of adhesion of fluorescent particles using confocal microscopy image analysis. Finally, we used a flow chamber to test the adhesion of particles under dynamic flow conditions that resemble the physiological conditions of epithelial cells in mucosal tissues as well as in ducts and tubules.
Bacterial adhesion and uptake by MVM cells.
Since bacterial adhesion to epithelial cells can be a preliminary step in colonization or invasion, we tested a variety of known mucosal bacterial inhabitant species (S. Typhimurium, S. aureus, E. faecalis, and Y. enterocolitica) for their binding and endocytosis by established epithelial cell monolayers. In this assay, direct adhesion to the apical surface of epithelial cells leads to endocytosis and resistance to a subsequent washing step with an antibiotic solution.
Suspensions of bacteria were incubated with established epithelial cell monolayers, allowing time for bacteria to adhere to and undergo endocytosis by epithelial cells. After the epithelium was washed with an antibiotic medium to eliminate free bacteria, cells were homogenized and plated to count colonies formed from bacteria that were endocytosed by the epithelial cells (Fig. 3A to D). The bacteria showed consistent preferences for binding and uptake by MVM versus WT Caco2BBe cells but to differing degrees, depending on the bacterial species.
FIG 3.

Epithelial cell uptake of live bacteria. Two-week monolayers of WT or MVM cells were assayed for endocytosis of bacteria (with measured zeta potentials indicated for each microbe). (A to D) Uptake of S. aureus (A), E. faecalis (B), Y. enterocolitica (C), and S. Typhimurium (D). Error bars represent data from two individual experiments run in triplicate; significance was determined by using unpaired Student's t test. *, P < 0.05; **, P < 0.005; NS, not significant. (E) Relationship between bacterial zeta potential and uptake. Ratios between the numbers of bacteria bound to MVM and WT cells were calculated and plotted against the bacterial zeta potential (values used were the means of three individual experiments run in triplicate). Bacterial uptake exhibits a linear relationship with bacterial zeta potential (R2 = 0.86). Error bars represent the standard errors of the means of duplicate experiments with two biological replicates (n = 4).
The characteristics of the bacterial particles affecting their adhesion and uptake by epithelial cells could involve several factors, including surface charge, hydrophobicity, bacterial or cell adhesion molecules, or other, as-yet-unidentified factors. The charge of the bacteria can be assessed by measuring electrophoretic mobility (from which zeta potential is calculated [29]); interestingly, the degree of preference of bacteria for MVM cells was proportional to their measured zeta potentials and could be expressed as a linear function of the particle zeta potential (Fig. 3E). To assess potential effects of hydrophobic interactions between the bacteria and epithelial cells, we also compared hydrophobicities of the particles but found that most microbes were hydrophilic, with the exception of S. aureus (see Fig. S2 in the supplemental material), so no correlation between hydrophobicity and bacterial uptake was evident.
Particle adhesion by MVM cells.
As noted above, bacterial adhesion to epithelial cells may be influenced by bacterial or epithelial adhesion protein interactions and other effectors, such as type III secretion systems (TTSSs) (see Fig. S3 in the supplemental material) (30–32). To minimize these effects, we used a second assay in which bacteria expressing fluorescent proteins were chemically fixed to disrupt the function of any adhesion proteins or other virulence factors, and the surface charge of these inert particles was again measured by using electrophoretic mobility. (E. faecalis was not included in this assay because its calculated zeta potential was similar to that of S. aureus when chemically fixed [see Fig. S4 in the supplemental material].) These fixed particles were then added to cells, followed by microscopy image analysis of bound or endocytosed bacterial particles (Fig. 4A to C). Here too, a clear linear relationship between cell adhesion preference and surface charge was noted (Fig. 4D).
FIG 4.

Adherence of fixed bacteria to epithelial cell monolayers. (A) S. aureus shows a preference for MVM cell compared to WT cells. Confocal images to the right show fluorescent bacteria (green) on monolayers, which were also stained for F-actin (phalloidin) (red). (B and C) Similar analyses of Y. enterocolitica (B) and S. Typhimurium (C). Error bars represent the standard errors of the means of three independent experiments with at least 10 images taken under each condition; significance was determined by using unpaired Student's t test. (D) Adherence ratios between the numbers of bacteria bound to MVM cells and those bound to WT cells plotted against bacterial zeta potential (values used were the means of three individual measurements). Bacterial adherence exhibits a linear relationship with bacterial zeta potential (R2 = 0.81). Error bars represent the sums of data from three individual experiments with two biological replicates each (n = 6). ***, P < 0.0005.
This relationship between the charge and the extent of particle-epithelial cell binding was further corroborated by using synthetic poly(lactic-coglycolic acid) (PLGA) nanoparticles designed to display calibrated surface charges: positively and negatively charged particles were made by using the surfactants cetyl trimethylammonium bromide (CTAB) and dioctyl sulfosuccinate sodium (DSS), respectively (Fig. 5A). The binding preferences of negatively charged particles resembled the behavior of bacteria; moreover, positively charged particles showed the reverse preference for WT Caco2BBe cells (Fig. 5B). Thus, the binding preferences of epithelial cells displaying different degrees of apical microvilli appear to be a direct linear function of the charge exhibited by both fixed bacterial particles and synthetic nanoparticles. In effect, the strength of the electrostatic barrier effect can be quantified, dependent on the presence of microvilli and the particle surface charge.
FIG 5.

Epithelial cell adherence of synthetic nanoparticles. (A) SEM images of synthetic nanoparticles (left, negatively charged PLGA particles loaded with 5% DSS; right, particles loaded with 5% CTAB) showing uniformity of particle shape and size. Histograms show the size distribution, with medians calculated to be 0.74 μm for negatively charged particles and 0.81 μm for positively charged particles. Zeta potentials of synthetic nanoparticles (far right) were measured in triplicate. FITC, fluorescein isothiocyanate. (B and C) Nanoparticle adherence was assayed with fixed bacteria. Positively charged nanoparticles showed a higher preference for WT cells, while negatively charge nanoparticles showed a preference for MVM cells. ***, P < 0.0005. (D) Adhesion of fixed bacteria (from Fig. 4) and synthetic microparticles shown on same plot, showing a similar relationship between adhesion and charge. Error bars represent the standard errors of the means of three individual experiments with two biological replicates (n = 6); significance was determined by using unpaired Student's t tests.
Bacterial adhesion under laminar flow conditions.
In the intestinal lumen, as well as in ducts and tubules, suspended particles move dynamically across the epithelial apical surface under laminar flow conditions. Therefore, to model the in vivo passage of luminal contents in the intestine, we adapted a flow chamber system (33) in which a suspension of fluorescent bacteria moves across an epithelial monolayer under low shear stress (1.5 ml/min, corresponding to an average linear velocity of 11.25 m/h). Accumulation of adhering particles was documented by video, and deposition kinetics were calculated (see Fig. S5 in the supplemental material). Bacteria with a high surface charge (i.e., S. aureus) showed substantial deposition onto MVM cells, with almost no detectable accumulation on WT Caco2BBe cells (Fig. 6A). Bacteria with lower charges (Y. enterocolitica) also showed preferential adhesion to MVM cells (Fig. 6B) albeit at a lower rate, consistent with the differences noted in the static binding assay. It is notable that under these dynamic conditions, deposition of any of the negatively charged particles onto WT Caco2BBe cells was essentially undetectable.
FIG 6.
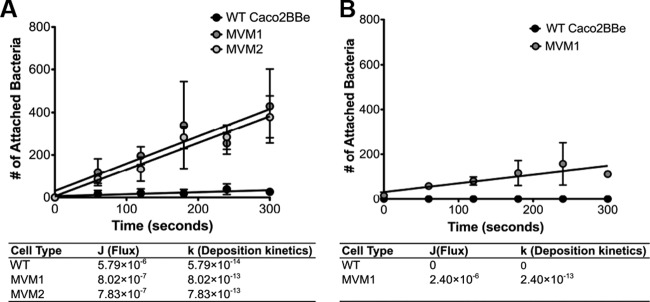
Bacterial binding to epithelial cells under flow conditions. (A) Deposition kinetics for S. aureus. Each MVM clone had two replicates each (n = 2) compared to WT cells (n = 3). (B) Kinetics for Y. enterocolitica, with two replicates for MVM cells (n = 2) and two replicates for WT cells (n = 2).
Bacterial effacement effector reduces numbers of microvilli and enhances microbial adhesion.
Our results from three different assays of particle adhesion to epithelial cells suggest that epithelial resistance to microbial adhesion and invasion may rely in part on the presence of the dense layer of apical brush border microvilli. To counter epithelial barrier mechanisms, some invasive bacteria have developed virulence mechanisms, such as TTSSs, that actively inject effector proteins into epithelial cells, causing effacement, or loss, of microvilli (34). Adhesion of the bacteria to the cell plasma membrane is also associated with actin pedestal formation (35, 36), but it is possible that electrostatic effects also play a major role in this mechanism of bacterial virulence.
One known bacterial effacement effector protein is the translocated intimin receptor (Tir) protein used by both enteropathogenic and enterohemorrhagic E. coli strains (37, 38), so we transfected Caco2BBe cells with Tir (“TirBBe” cells) to test its effect on electrostatic mechanisms. Although previous studies suggested that the effacement function of Tir is dependent on interactions with additional bacterial effectors (38), we found that stable transfection of Tir alone was sufficient to induce a striking loss of apical microvilli while retaining tight junction integrity, similar to the morphology seen with MVM cells (Fig. 7A and B). Here, Tir is expected to induce a loss of microvilli by a mechanism distinct from that of the MVM model. TirBBe cells showed no induction of M cell genes, again paralleling the MVM cell model; however, TirBBe cells showed induction of RelB, suggesting noncanonical NF-κB activation (Fig. 7C).
FIG 7.

Loss of microvilli in cells expressing the bacterial effacement effector Tir. (A) Caco2BBe cells were transfected with the E. coli O157:H7 effector Tir (TirBBe). F-actin (phalloidin) (red) staining (top row) suggests a loss of microvilli; SEM images (bottom row) confirm the absence of microvilli. (B) TirBBe cells show electrical resistances (TEER) similar to those of WT cells, indicating that tight junction formation is retained. Error bars represents the standard errors of the means of three individual experiments (n = 3). (C) qPCR showing that TirBBe cells had no induction of the M cell-related 41BB and gp2 genes but did show induction of RelB.
Importantly, bacteria showed preferential binding to TirBBe cells, again showing a linear relationship with surface charge similar to that seen with MVM cells (Fig. 8A to D). These results support the notion that bacteria actively reengineer the epithelium apical architecture to manipulate the surface charge of epithelial cells, ultimately enabling increased binding and colonization of the host. In this context, electrostatic interactions and bacterial charge can be viewed as virulence factors.
FIG 8.

Bacterial adherence to TirBBe cells. (A to C) Adhesion of fixed S. aureus (A), Y. enterocolitica (B), and S. Typhimurium (C) bacteria. All assays were run in duplicate (two individual experiments). *, P < 0.05; **, P < 0.005; ***, P < 0.0005. (D) Adherence ratios plotted against bacterial surface charge, showing a linear relationship similar to that seen with MVM cells. Error bars represent the standard errors of the means of two individual experiments with three biological replicates (n = 6).
DISCUSSION
Microvilli are found in a variety of wet epithelia with diverse functions, such as mucosal barrier function and nutrient uptake, transport of material from secretory glands, transport of fluids in various stages of processing in the kidney, and so on. Our results suggest that despite their diverse locations and functions, microvilli in these tissues may share a broader function in establishing a barrier, via electrostatic forces, to adhesion and invasion by microbes. Thus, while it has long been an accepted notion that microbial adhesion to surfaces is affected in large part by surface charge and electrostatic interactions, the present studies view the problem from the perspective of the mucosal epithelial barrier and its strategies for defending against colonizing or invasive bacteria.
The scale of these electrostatic interactions may be an important aspect of microvillus function. Thus, the effect of TTSS effector proteins on microvilli can be viewed in terms of pathogen-engineered changes in electrostatic resistance of single cells to microbial adhesion; that is, individual enterocytes are “converted” by a pioneer microbe using its TTSS to make way for adhesion of a cohort of colonizing microbes. In contrast, the adhesive pili or fimbriae of pathogenic bacteria may simply evade electrostatic repulsion by taking advantage of the smaller effective surface area to enable their approach and attachment to target cells. More work will be needed to directly measure the magnitude of forces operating at these scales.
This effect may also be relevant at larger scales. For conventional epithelial cells with a full display of microvilli, pathological conditions may disrupt this protective mechanism and permit microbial adhesion/invasion. Thus, in a broader context, inflammatory processes may also disrupt microvillus formation and the maintenance of the electrostatic barrier even in the absence of effacement effectors and TTSSs. For example, inflammatory cytokines such as lymphotoxin and tumor necrosis factor alpha (TNF-α) were found to reduce microvillus formation in Caco2BBe cells in vitro (16); since these cytokines are known effectors in inflammatory bowel disease (39, 40), a similar effect on microvilli in vivo may be relevant to mucosal barrier function.
We note that the natural experiment, M cells in mucosal tissues, also provides the in vivo example of epithelial microvillus-minus cells that inspired this study. Since the generation of this electrostatic effect appears to be a function of the increased area provided by microvillus membrane extensions, it is also possible that other mucosal surfaces, such as ciliated airway epithelium, may also benefit from membrane extensions such as cilia to generate a similar electrostatic force barrier. Thus, here too, the loss of ciliated epithelium might be predicted to increase susceptibility to invasion by luminal microbes, although the impacts of cilia on surface charge and microbial adhesion have not yet been directly measured.
This view of the mucosal barrier does not ignore the additional contributions of the mucus layer at mucosal surfaces and the accompanying intestinal motility or airway ciliary clearance. Indeed, our demonstration of resistance to adhesion under flow conditions suggests that the electrostatic barrier may actively complement the role of mechanical luminal clearance. With respect to M cell function, the presence of a thinner mucus layer over Peyer's patch epithelium might benefit from both the diminished contribution of mucus to electrostatic repulsion as well as increased access to microbial capture receptors.
Finally, these studies may also have practical implications with respect to drug and vaccine delivery at mucosal surfaces (reviewed in reference 41). While a variety of approaches may target the disruption of the mucosal barrier or adhesion to the mucus layer, a focus on electrostatic interactions may provide a more focused strategy of delivery to M cells, which would then enable exploitation of the M cells' transcytosis function in addition to their electrostatic surveillance mechanism.
Supplementary Material
ACKNOWLEDGMENTS
K.M.B. acknowledges financial support from the National Science Foundation Graduate Research Fellowship Program. Research in this report was supported by the National Institute of Allergy and Infectious Diseases of the National Institutes of Health under award numbers R21AI98973 and R01AI63426.
We have no conflicts of interest to disclose.
We thank Jing Wang, Veronica Gusti, Indranil Chowdury, and Juan Nevarez for technical assistance; Aliana Lopez de Victoria for synthetic nanoparticles; Manuela Raffatellu, Cathryn Nagler, Joan Mecsas, Alexander Horswill, and Neal Schiller for bacterial strains; Monica Carson for help with flow cytometry; Stephen McDaniels and staff at the Central Facility for Advanced Microscopy and Microanalysis for assistance with scanning electron microscopy; and Bahman Anvari for the use of the Malvern Zetasizer.
Footnotes
Published ahead of print 28 April 2014
Supplemental material for this article may be found at http://dx.doi.org/10.1128/IAI.01681-14.
REFERENCES
- 1.Rostgaard J, Thuneberg L. 1972. Electron microscopical observations on the brush border of proximal tubule cells of mammalian kidney. Z. Zellforsch. Mikrosk. Anat. 132:473–496. 10.1007/BF00306637 [DOI] [PubMed] [Google Scholar]
- 2.Perez de la Cruz Moreno M, Oth M, Deferme S, Lammert F, Tack J, Dressman J, Augustijns P. 2006. Characterization of fasted-state human intestinal fluids collected from duodenum and jejunum. J. Pharm. Pharmacol. 58:1079–1089. 10.1211/jpp.58.8.0009 [DOI] [PubMed] [Google Scholar]
- 3.Jantratid E, Janssen N, Reppas C, Dressman JB. 2008. Dissolution media simulating conditions in the proximal human gastrointestinal tract: an update. Pharm. Res. 25:1663–1676. 10.1007/s11095-008-9569-4 [DOI] [PubMed] [Google Scholar]
- 4.Fallingborg J. 1999. Intraluminal pH of the human gastrointestinal tract. Dan. Med. Bull. 46:183–196 [PubMed] [Google Scholar]
- 5.Lange K. 2000. Microvillar ion channels: cytoskeletal modulation of ion fluxes. J. Theor. Biol. 206:561–584. 10.1006/jtbi.2000.2146 [DOI] [PubMed] [Google Scholar]
- 6.Lange K. 2000. Regulation of cell volume via microvillar ion channels. J. Cell. Physiol. 185:21–35. 10.1002/1097-4652(200010)185:1<21::AID-JCP2>3.0.CO;2-D [DOI] [PubMed] [Google Scholar]
- 7.Kraehenbuhl JP, Neutra MR. 1992. Molecular and cellular basis of immune protection of mucosal surfaces. Physiol. Rev. 72:853–879 [DOI] [PubMed] [Google Scholar]
- 8.Neutra MR, Kraehenbuhl JP. 1992. Transepithelial transport and mucosal defence I: the role of M cells. Trends Cell Biol. 2:134–138. 10.1016/0962-8924(92)90099-9 [DOI] [PubMed] [Google Scholar]
- 9.Rajapaksa TE, Bennett KM, Hamer M, Lytle C, Rodgers VG, Lo DD. 2010. Intranasal M cell uptake of nanoparticles is independently influenced by targeting ligands and buffer ionic strength. J. Biol. Chem. 285:23739–23746. 10.1074/jbc.M110.126359 [DOI] [PMC free article] [PubMed] [Google Scholar]
- 10.Jones T, Yeaman MR, Sakoulas G, Yang SJ, Proctor RA, Sahl HG, Schrenzel J, Xiong YQ, Bayer AS. 2008. Failures in clinical treatment of Staphylococcus aureus infection with daptomycin are associated with alterations in surface charge, membrane phospholipid asymmetry, and drug binding. Antimicrob. Agents Chemother. 52:269–278. 10.1128/AAC.00719-07 [DOI] [PMC free article] [PubMed] [Google Scholar]
- 11.Boks NP, Norde W, van der Mei HC, Busscher HJ. 2008. Forces involved in bacterial adhesion to hydrophilic and hydrophobic surfaces. Microbiology 154:3122–3133. 10.1099/mic.0.2008/018622-0 [DOI] [PubMed] [Google Scholar]
- 12.Hermansson M. 1999. The DLVO theory in microbial adhesion. Colloids Surf. B Interfaces 14:105–119 [Google Scholar]
- 13.Mutsaers SE, Whitaker D, Papadimitriou JM. 1996. Changes in the concentration of microvilli on the free surface of healing mesothelium are associated with alterations in surface membrane charge. J. Pathol. 180:333–339 [DOI] [PubMed] [Google Scholar]
- 14.Ito S. 1974. Form and function of the glycocalyx on free cell surface. Philos. Trans. R. Soc. Lond. B Biol. Sci. 891:55–66 [DOI] [PubMed] [Google Scholar]
- 15.des Rieux A, Ragnarsson EG, Gullberg E, Preat V, Schneider YJ, Artursson P. 2005. Transport of nanoparticles across an in vitro model of the human intestinal follicle associated epithelium. Eur. J. Pharm. Sci. 25:455–465. 10.1016/j.ejps.2005.04.015 [DOI] [PubMed] [Google Scholar]
- 16.Wang J, Lopez-Fraga M, Rynko A, Lo DD. 2009. TNFR and LT beta R agonists induce follicle-associated epithelium and M cell specific genes in rat and human intestinal epithelial cells. Cytokine 47:69–76. 10.1016/j.cyto.2009.05.001 [DOI] [PMC free article] [PubMed] [Google Scholar]
- 17.Rosenberg M, Gutnick D, Rosenberg E. 1980. Adherence of bacteria to hydrocarbons simple method for measuring cell-surface hydrophobicity. FEMS Microbiol. Lett. 9:29–33. 10.1111/j.1574-6968.1980.tb05599.x [DOI] [Google Scholar]
- 18.Marcus IM, Herzberg M, Walker SL, Freger V. 2012. Pseudomonas aeruginosa attachment on QCM-D sensors: the role of cell and surface hydrophobicities. Langmuir 28:6396–6402. 10.1021/la300333c [DOI] [PubMed] [Google Scholar]
- 19.Bradford MM. 1976. A rapid and sensitive method for the quantitation of microgram quantities of protein utilizing the principle of protein-dye binding. Anal. Biochem. 72:248–254. 10.1016/0003-2697(76)90527-3 [DOI] [PubMed] [Google Scholar]
- 20.Crotty Alexander LE, Maisey HC, Timmer AM, Rooijakkers SH, Gallo RL, von Kockritz-Blickwede M, Nizet V. 2010. M1T1 group A streptococcal pili promote epithelial colonization but diminish systemic virulence through neutrophil extracellular entrapment. J. Mol. Med. 88:371–381. 10.1007/s00109-009-0566-9 [DOI] [PMC free article] [PubMed] [Google Scholar]
- 21.Mooseker MS, Howe CL. 1982. The brush border of intestinal epithelium: a model system for analysis of cell-surface architecture and motility. Methods Cell Biol. 25(Part B):143–174 [DOI] [PubMed] [Google Scholar]
- 22.Hanono A, Garbett D, Reczek D, Chambers DN, Bretscher A. 2006. EPI64 regulates microvillar subdomains and structure. J. Cell Biol. 175:803–813. 10.1083/jcb.200604046 [DOI] [PMC free article] [PubMed] [Google Scholar]
- 23.Yonemura S, Tsukita S. 1999. Direct involvement of ezrin/radixin/moesin (ERM)-binding membrane proteins in the organization of microvilli in collaboration with activated ERM proteins. J. Cell Biol. 145:1497–1509 [DOI] [PMC free article] [PubMed] [Google Scholar]
- 24.Berryman M, Franck Z, Bretscher A. 1993. Ezrin is concentrated in the apical microvilli of a wide variety of epithelial cells whereas moesin is found primarily in endothelial cells. J. Cell Sci. 105:1025–1043 [DOI] [PubMed] [Google Scholar]
- 25.Garbett D, Bretscher A. 2012. PDZ interactions regulate rapid turnover of the scaffolding protein EBP50 in microvilli. J. Cell Biol. 198:195–203. 10.1083/jcb.201204008 [DOI] [PMC free article] [PubMed] [Google Scholar]
- 26.Hase K, Kawano K, Nochi T, Pontes GS, Fukuda S, Ebisawa M, Kadokura K, Tobe T, Fujimura Y, Kawano S, Yabashi A, Waguri S, Nakato G, Kimura S, Murakami T, Iimura M, Hamura K, Fukuoka SI, Lowe AW, Itoh K, Kiyono H, Ohno H. 2009. Uptake through glycoprotein 2 of FimH(+) bacteria by M cells initiates mucosal immune response. Nature 462:226–230. 10.1038/nature08529 [DOI] [PubMed] [Google Scholar]
- 27.Hsieh EH, Fernandez X, Wang J, Hamer M, Calvillo S, Croft M, Kwon BS, Lo DD. 2010. CD137 is required for M cell functional maturation but not lineage commitment. Am. J. Pathol. 177:666–676. 10.2353/ajpath.2010.090811 [DOI] [PMC free article] [PubMed] [Google Scholar]
- 28.Dersch P, Isberg RR. 1999. A region of the Yersinia pseudotuberculosis invasin protein enhances integrin-mediated uptake into mammalian cells and promotes self-association. EMBO J. 18:1199–1213. 10.1093/emboj/18.5.1199 [DOI] [PMC free article] [PubMed] [Google Scholar]
- 29.Ottewill RH, Shaw JN. 1966. Stability of monodisperse polystyrene latex dispersions of various sizes. Discuss. Faraday Soc. 42:154–163 [Google Scholar]
- 30.Patel JC, Galan JE. 2005. Manipulation of the host actin cytoskeleton by Salmonella—all in the name of entry. Curr. Opin. Microbiol. 8:10–15. 10.1016/j.mib.2004.09.001 [DOI] [PubMed] [Google Scholar]
- 31.Guttman JA, Li YL, Wickham ME, Deng WY, Vogl AW, Finlay B. 2006. Attaching and effacing pathogen-induced tight junction disruption in vivo. Cell. Microbiol. 8:634–645. 10.1111/j.1462-5822.2005.00656.x [DOI] [PubMed] [Google Scholar]
- 32.Tahoun A, Mahajan S, Paxton E, Malterer G, Donaldson DS, Wang D, Tan A, Gillespie TL, O'Shea M, Roe AJ, Shaw DJ, Gally DL, Lengeling A, Mabbott NA, Haas J, Mahajan A. 2012. Salmonella transforms follicle-associated epithelial cells into M cells to promote intestinal invasion. Cell Host Microbe 12:645–656. 10.1016/j.chom.2012.10.009 [DOI] [PubMed] [Google Scholar]
- 33.Chowdhury I, Walker SL. 2012. Deposition mechanisms of TiO2 nanoparticles in a parallel plate system. J. Colloid. Interface Sci. 369:16–22. 10.1016/j.jcis.2011.12.019 [DOI] [PubMed] [Google Scholar]
- 34.Jarvis KG, Giron JA, Jerse AE, McDaniel TK, Donnenberg MS, Kaper JB. 1995. Enteropathogenic Escherichia coli contains a putative type III secretion system necessary for the export of proteins involved in attaching and effacing lesion formation. Proc. Natl. Acad. Sci. U. S. A. 92:7996–8000. 10.1073/pnas.92.17.7996 [DOI] [PMC free article] [PubMed] [Google Scholar]
- 35.Gruenheid S, DeVinney R, Bladt F, Goosney D, Gelkop S, Gish GD, Pawson T, Finlay BB. 2001. Enteropathogenic E. coli Tir binds Nck to initiate actin pedestal formation in host cells. Nat. Cell Biol. 3:856–859. 10.1038/ncb0901-856 [DOI] [PubMed] [Google Scholar]
- 36.Finlay BB, Rosenshine I, Donnenberg MS, Kaper JB. 1992. Cytoskeletal composition of attaching and effacing lesions associated with enteropathogenic Escherichia coli adherence to HeLa cells. Infect. Immun. 60:2541–2543 [DOI] [PMC free article] [PubMed] [Google Scholar]
- 37.Wolff C, Nisan I, Hanski E, Frankel G, Rosenshine I. 1998. Protein translocation into host epithelial cells by infecting enteropathogenic Escherichia coli. Mol. Microbiol. 28:143–155 [DOI] [PubMed] [Google Scholar]
- 38.Croxen MA, Finlay BB. 2010. Molecular mechanisms of Escherichia coli pathogenicity. Nat. Rev. Microbiol. 8:26–38. 10.1038/nrmicro2265 [DOI] [PubMed] [Google Scholar]
- 39.Bouma G, Strober W. 2003. The immunological and genetic basis of inflammatory bowel disease. Nat. Rev. Immunol. 3:521–533. 10.1038/nri1132 [DOI] [PubMed] [Google Scholar]
- 40.Seiderer J, Elben I, Diegelmann J, Glas J, Stallhofer J, Tillack C, Pfennig S, Jurgens M, Schmechel S, Konrad A, Goke B, Ochsenkuhn T, Muller-Myhsok B, Lohse P, Brand S. 2008. Role of the novel th17 cytokine IL-17F in inflammatory bowel disease (IBD): upregulated colonic IL-17F expression in active Crohn's disease and analysis of the IL17F p.Hisl6lArg polymorphism in IBD. Inflamm. Bowel. Dis. 14:437–445. 10.1002/ibd.20339 [DOI] [PubMed] [Google Scholar]
- 41.Woodrow K, Bennett KM, Lo DD. 2012. Mucosal vaccine design and delivery. Annu. Rev. Biomed. Eng. 14:17–46. 10.1146/annurev-bioeng-071811-150054 [DOI] [PubMed] [Google Scholar]
Associated Data
This section collects any data citations, data availability statements, or supplementary materials included in this article.