

Abstract
Next-generation sequencing (NGS) has the potential to provide typing results and detect resistance genes in a single assay, thus guiding timely treatment decisions and allowing rapid tracking of transmission of resistant clones. We evaluated the performance of a new NGS assay (Hospital Acquired Infection BioDetection System; Pathogenica) during an outbreak of sequence type 131 (ST131) Escherichia coli infections in a nursing home in The Netherlands. The assay was performed on 56 extended-spectrum-beta-lactamase (ESBL) E. coli isolates collected during 2 prevalence surveys (March and May 2013). Typing results were compared to those of amplified fragment length polymorphism (AFLP), whereby we visually assessed the agreement of the BioDetection phylogenetic tree with clusters defined by AFLP. A microarray was considered the gold standard for detection of resistance genes. AFLP identified a large cluster of 31 indistinguishable isolates on adjacent departments, indicating clonal spread. The BioDetection phylogenetic tree showed that all isolates of this outbreak cluster were strongly related, while the further arrangement of the tree also largely agreed with other clusters defined by AFLP. The BioDetection assay detected ESBL genes in all but 1 isolate (sensitivity, 98%) but was unable to discriminate between ESBL and non-ESBL TEM and SHV beta-lactamases or to specify CTX-M genes by group. The performance of the hospital-acquired infection (HAI) BioDetection System for typing of E. coli isolates compared well with the results of AFLP. Its performance with larger collections from different locations, and for typing of other species, was not evaluated and needs further study.
INTRODUCTION
Genes encoding extended-spectrum beta-lactamases (ESBL) are rapidly spreading among Gram-negative bacteria. Due to growing reservoirs of resistant Enterobacteriaceae in humans and farm animals and the widespread presence of these bacteria in the food chain, the frequency of outbreaks in hospitals and long-term-care facilities is expected to increase (1–6). Nosocomial spread of resistant bacteria poses a serious threat to patient safety all around the world.
When an outbreak is detected, rapid assessment of its extent and the identification of transmission routes and sources are essential to prevent further transmission among susceptible patients. Several molecular typing methods are available to investigate the degree of relatedness of strains recovered from patients during outbreaks. Due to differences in performance (e.g., discriminatory power and reproducibility), none of these typing methods can be universally applied for all pathogens in all situations. Ideally, typing results should be reproducible so that all data generated by different laboratories can be compared. Costs, time to result, and the required level of technical skills are further determinants of whether a typing method is suitable to be widely implemented in microbiology laboratories (7, 8).
Amplified fragment length polymorphism (AFLP) is often used for typing of Enterobacteriaceae. This technique relies on amplification of genomic fragments generated by one or two restriction enzymes and uses the amplified products to create digitized profiles. It has good discriminatory power but is relatively expensive and time-consuming and is technically demanding. Whole-genome sequencing (WGS) can provide information about bacterial relatedness with across-genome single-nucleotide resolution, but rapid translation of these data into epidemiologically useful information remains difficult. Data derived from whole-genome sequencing have nonetheless facilitated the search for suitable targets that allow bacterial typing based on sequencing only a part of the genome. In addition to providing information on phylogenetic relatedness, sequence data can be used to detect resistance genes, enabling clinicians to rapidly track transmission of resistant clones or mobile genetic elements and to initiate timely appropriate treatment during outbreak situations. Thus, it is likely that sequence-based typing methods will eventually replace fragment-based methods such as AFLP.
Next-generation sequencing (NGS) is a new high-throughput sequencing method that can rapidly generate millions of reads (ranging between 35 and 700 bp in length) at relatively low per-base sequencing costs. The Hospital Acquired Infection BioDetection System (Pathogenica) is a new commercial NGS-based assay that targets a selection of short DNA regions and is able to detect the presence of several different pathogens and resistance genes simultaneously in a single sample while sequencing only a few kilobases of genome. In addition, the kit includes software that can be used to type the strains and provide a phylogenetic tree for sets of isolates.
In June to July 2012, a survey in 9 nursing homes in the southern region of The Netherlands identified several facilities with a high prevalence of fecal ESBL carriage. The results of multilocus sequence typing (MLST) and AFLP analysis of isolates collected in the two facilities with the highest prevalences (19% and 21% rectal carriage, respectively) indicated clonal spread in both facilities. Widespread dissemination of E. coli ST131 (a multiresistant clone that spreads extensively in elderly populations in regions of hyperendemicity all around the world) was found in one of the facilities. In 2013, two follow-up surveys were performed to assess the effect of the implemented interventions. In this paper, we compare the typing performance of the new NGS assay to that of AFLP for the isolates collected during these follow-up surveys.
MATERIALS AND METHODS
Isolate collection and epidemiological setting.
Two consecutive cross-sectional surveys were performed in March and May 2013. During these surveys, feces or rectal swabs (Eswab medium; Copan Diagnostics) were collected from all admitted patients, and hand cultures were taken from health care workers (HCW). Every first ESBL-positive E. coli isolate per patient or health care worker (collected either in March or in May) was included in the isolate collection for the current study. The isolate collection thus included 56 E. coli isolates from 48 patients and 1 HCW. Forty-nine isolates (from 42 patients and 1 HCW) were collected in the first nursing home (NH1), and the remaining isolates were collected from the second location (NH2) located at a 45-km distance from NH1. In NH1, patients were residing in 3 semiseparate buildings (A, B, and C); each of these buildings was divided into 2 or 3 separate departments (A1 to A3, B1 to B3, and C1 to C3). The study included 15, 20, and 14 isolates from buildings A, B, and C, respectively. Staff members were not exchanged between these buildings, and transfer of patients between departments seldom occurred. From NH2, 7 isolates (from 6 patients residing in departments D1 and D2) were included in the collection.
Identification and detection of resistance genes.
Identification of Gram-negative bacteria growing on a selective medium (EbSA; AlphaOmega, The Hague, The Netherlands) was performed using matrix-assisted laser desorption ionization–time of flight (MALDI-TOF) (bioMérieux, Marcy l'Etoile, France). Susceptibility testing was performed by Vitek2 (bioMérieux), and ESBL production was confirmed by the double-disk method. For all phenotypically ESBL-positive isolates, ESBL genes were detected using a commercial microarray (Check-MDR CT103; Checkpoints, Wageningen, The Netherlands) that was used as the gold standard (9, 10) This assay identifies the β-lactamase genes of TEM, SHV, and CTX-M and is able to detect single nucleotide polymorphisms (SNPs) in TEM and SHV genes, thus discriminating between ESBL and non-ESBL TEM and SHV variants. In addition, the assay can detect pAmpC (CMY-2-like, DHA, FOX, ACC-1, ACT/MIR, and CMY-1-like/MOX) and carbapenemases (KPC, OXA-48, VIM, IMP, and NDM). In cases in which resistance genes were detected by microarray but not by the BioDetection system, the microarray was repeated for these isolates. All ESBL-positive isolates were stored at minus 80 degrees for subsequent typing. Typing was performed on all 56 E. coli isolates included in the collection.
Amplified fragment length polymorphism (AFLP).
AFLP was performed as described by Mohammadi et al. (VU Medical Centre, Amsterdam, The Netherlands) (11). Briefly, DNA was isolated using a QIAamp DNA minikit (Qiagen). The restriction-ligation reaction mixtures consisted of approximately 10 ng DNA, 1× T4 DNA ligase buffer, 0.05 M NaCl, 0.5 μg bovine serum albumin (BSA), 1 pmol of the EcoRI adapter, 10 pmol of the MseI adapter (Eurogentec, Maastricht, The Netherlands), 80 U of T4 DNA ligase, 1 U of EcoRI, and 1 U of MseI. All enzymes were purchased from New England BioLabs (Beverly, MA). After incubation at 37°C for 3 h, the mixtures were diluted 1:20 in water. A 5-μl volume of the mixture was added to 5 μl of PCR mixture, which consisted of 1× PCR buffer (Sphaero Q; Gorinchem, The Netherlands), 200 μM deoxynucleoside triphosphates (dNTPs) (Promega), 1 U Super Taq polymerase (Sphaero Q), and 20 ng of Eco-A primer and 60 ng of Mse-C primer. The Eco-A primer was fluorescently labeled with carboxyfluorescein (Eurogentec). Amplification was carried out under the following conditions: 2 min at 72°C, followed by 12 cycles of 30 s at 94°C, 30 s at 65°C, and 1 min at 72°C and then 23 cycles of 30 s at 94°C, 30 s at 56°C, and 1 min at 72°C. Amplification was ended by a single extension at 72°C for 1 min. A 2.5-μl volume of each PCR product was added to 22 μl Hi-Di formamide and 0.5 μl GeneScan-600 LIZ size standard (Applied Biosystems). Fragments were separated on an ABI Prism 3130 sequencer (Applied Biosystems). Data were analyzed with GENESCAN analysis software (Applied Biosystems) and the BioNumerics software package, version 6.6 (Applied Maths, Sint-Martens-Latem, Belgium). Similarity coefficients were calculated with Pearson correlation, and dendrograms were obtained by the unweighted pair group method using arithmetic averages (UPGMA) for clustering. The analysis was performed for fragments with lengths of between 60 and 600 bp. Isolates were considered indistinguishable (representing a cluster) when the band patterns were identical.
Hospital-acquired infection (HAI) BioDetection System.
The pathogens that can be detected by the HAI BioDetection System (Pathogenica, Boston, MA) are Acinetobacter baumannii, Acinetobacter pittii, Acinetobacter calcoaceticus, Clostridium difficile, Escherichia coli, Enterococcus faecalis, Enterococcus faecium, Enterobacter aerogenes, Enterobacter cloacae, Klebsiella oxytoca, Klebsiella pneumoniae, Proteus mirabilis, Pseudomonas aeruginosa, Staphylococcus aureus, Staphylococcus epidermidis, Staphylococcus saprophyticus, and Staphylococcus haemolyticus. The drug resistance genes that can be detected by the HAI BioDetection System are NDM, OXA, KPC, IMP, CARB, CMY, CTX-M, TEM, SHV, PER, VEB, and VIM (beta-lactamases), mecA (methicillin resistance), vanA (glycopeptide resistance), ermA (macrolide/lincosamide resistance), and mexA (multidrug resistance efflux operon). In addition to the genes mentioned here, which are all listed in the product brochure, the assay can also detect several aminoglycoside resistance genes (aac, aad, and ant) and sulfonamide resistance genes (sul1) (Table 1). The probe set may not detect all forms of these genes, however, and the detection of these genes has not yet been validated.
TABLE 1.
Resistance genes detected by microarray (Check-MDR CT103, Checkpoints) and by the HAI BioDetection System
| Detection method | No. of isolates with ESBL genes (n = 54 E. coli isolates)a |
||||
|---|---|---|---|---|---|
| CTX-M-1 (n = 8) | CTX-M-3 (n = 1) | CTX-M-15 (n = 32) | CTX-M-9 (n = 6) | TEM (n = 7) | |
| Microarray | |||||
| Non-ESBL TEM positive | 4 | 1 | 1 | 3 | 0 |
| Non-ESBL TEM negative | 4 | 0 | 31 | 3 | 7 |
| HAI BioDetection system | |||||
| Beta-lactamase genes | |||||
| CTX-M | 7 | 1 | 32 | 6 | 0 |
| TEMb | 4 | 1 | 1 | 2 | 7 |
| Other resistance genesc | |||||
| aac(6′)-Ib | 0 | 0 | 28 | 4 | 0 |
| ant | 0 | 1 | 5 | 5 | 0 |
| ant(3′)-Ia | 1 | 1 | 0 | 3 | 1 |
| sul1 | 0 | 0 | 0 | 2 | 0 |
Results are missing for the HAI BioDetection system for 2 isolates; these were not included in the table.
The assay was unable to discriminate between ESBL and non-ESBL TEM beta-lactamases. ESBL TEM was not present in any of the isolates with CTX-M beta-lactamases: for isolates with CTX-M-1, CTX-M-3, CTX-M-15, and CTX-M-9, microarray analysis detected non-ESBL TEM genes in 4, 1, 1, 3, and 0 isolates, respectively. The HAI BioDetection kit failed to detect 1 CTX-M gene and 1 non-ESBl TEM gene: the microarray analysis was repeated for these isolates.
aac(6′)-Ib encodes aminoglycoside N-acetyltransferase, which modifies aminoglycosides by acetylation. ant and ant(3′)-Ia encode aminoglycoside O-nucleotidylyltransferase. Some probes can distinguish between Ant forms (e.g., Ant3Ia); others only give the family identification (ant). sul1 encodes sulfonamide-resistant dihydropteroate synthase.
The assay is based on approximately 300 probes that capture and amplify short DNA regions of interest that were selected by the manufacturer based on previously performed whole-genome analyses. The kit simultaneously sequences all probe targets from any organism in a sample, minimizing the hands-on time needed to identify and type bacterial species, while detecting resistance genes at the same time. By targeting variable regions, the selected probe set can identify species and distinguish between strains while sequencing only a few kilobases of a genome.
Isolates were thawed, DNA was extracted, and each sample was diluted to a working DNA concentration of 0.5 ng/μl and processed further, according to the instructions of the manufacturer. Individually barcoded isolates were combined into a clean microcentrifuge tube, and this pooled PCR product was purified using 0.8× Agencourt AMPure XP Reagent (Beckman Coulter). An Ion Torrent PGM sequencing platform (Life Technologies) was used to sequence the DNA fragments. Template preparation was carried out with an Ion PGM Template OT2 200 kit (Life Technologies), according to the instructions of the manufacturer. Sequencing data were analyzed using an internal version of Pathogenica's HAI BioDetection software v1.2. This software uses 103 to 106 sequencing reads to determine the genomic sequence of all of the loci targeted by the assay for each organism present in the sample. RAxML was used to generate a phylogenetic tree for the samples (12). A shell-scripting interface to the software (rather than the Torrent Server interface) was used to create the tree, whereby the probe weight and partition values were shown to be identical to those present in software v1.2. After tree construction, each tree's leaves were ordered using an optimal leaf-ordering algorithm (13) to make clusters easier to identify by eye. All analyses were performed without knowledge of the species determination, resistance phenotype, or AFLP results. The time from DNA isolation to results was approximately 12 h.
WGS analysis.
Using the same DNA as was used with the BioDetection kit, we performed whole-genome sequencing using an Illumina MiSeq system. Reads were aligned to the Escherichia coli NA114 genome (GenBank accession number CP002797) using the Bowtie2 aligner (verson 2.1.0) in paired-end mode with parameters “–sensitive –minins 10 –maxins 1400” and a “–rg-id” parameter to store the sample name in the alignment output. We then sorted and merged all of the output files to generate a single BAM file with all aligned reads and used FreeBayes (version 0.9.9.2-14) on that file to generate a VCF file of SNP calls. We filtered the SNP calls to include only those with 10 reads of coverage and at least 5 reads supporting the call. If SNPs could be called in some samples, then the other samples were included as “-” for missing data. We then generated FASTA and PHYLIP files using only genomic loci at which at least one sample showed a SNP. The PHYLIP file was used as the input to RaxML to generate the whole-genome-sequencing (WGS) phylogenetic trees with parameters “-T 16 -p $$ -f a -s ${project}.phylip -n ${project}.raxml-gtrgamma.tree -m GTRGAMMA -x $$ -N autoMRE -k.” We generated trees both for the full set of samples and for a subset of more closely related samples. Due to our input format, which contained only variant genomic loci, the tree distances do not measure a true distance (i.e., SNPs/genome size) but rather a relative value (i.e., SNPs/number of variant loci). Trees were optimized for display using the same optimal leaf ordering as was used for the BioDetection trees.
Phylogrouping and ST131 PCR.
To support the interpretation of the 2 typing methods mentioned above, we also performed PCRs to detect ST131-specific sequences and to assign the isolates to one of the E. coli phylogroups. E. coli consists of 8 genetic subspecies (phylogroups) that differ in their levels of virulence and ecological niches, according to which phylogroups B2 and D are more likely to cause extraintestinal infection than the other phylogroups (14). Phylogroup B2 has been associated with E. coli ST131. We used a real-time PCR to detect single nucleotide polymorphisms specific for the MLST clone ST131 as described by Dhanji et al. (15) This assay amplifies the regions within the pabB gene that contain the ST131-specific SNPs (adenine-450 and thymine-144) by melting curve analysis. Using the isolates that were classified as ST131 on the basis of the PCR results, multilocus sequence typing (MLST) was performed on 1 “representative” isolate, according to methods described previously by Wirth et al. (16). Phylogrouping of all E. coli strains was done by a multiplex PCR that targets 3 phylogenetic group marker genes and one control gene (yjaA, chuA, tspE, and gadA). Polymorphisms in these genes were detected as described by Doumith et al. (17).
Comparison of the typing results.
First, we visually assessed the agreement of the phylogenetic tree generated by the HAI BioDetection kit software with the results generated by AFLP. We also assessed to what extent the arrangement of this tree was concordant with the available epidemiological data.
In addition, whole-genome sequencing was performed for a selected set of isolates (for specification of the isolates; see Results). Samples were selected to reflect the inherent genetic diversity of the sample set and to cover the breadth of AFLP clusters but also to include pairs that were closely related according to the BioDetection data but that seemed unrelated based on AFLP. Genomic DNA for these samples was prepared for sequencing using a Nextera kit (Illumina) and sequenced using a 2 × 150-bp kit on the MiSeq platform (Illumina).
RESULTS
Typing.
Among the 56 E. coli isolates, five clusters of isolates were identified by AFLP, and 12 isolates were considered unique. The largest cluster consisted of 31 indistinguishable isolates (5 representatives in green), whereas the other 4 clusters included only 3 or 4 indistinguishable isolates (yellow, blue, pink, and red; Fig. 1). Isolates from the green cluster were exclusively found in departments in buildings B and C in nursing home 1. Isolates unrelated to this cluster were not found in these departments. The smaller clusters were found in department A1 (red cluster), in department A2 (pink and blue clusters) in nursing home 1, and in department D1 (yellow cluster) in nursing home 2. Results related to the AFLP typing, ST131 PCR, and department of residence at the time of sample collection are indicated in Fig. 1. All isolates from the green cluster belonged to phylogroup B2 and were found to be ST131 by PCR. For one isolate representative of this cluster, sequence type results were confirmed by MLST.
FIG 1.

Results of amplified fragment length polymorphism (AFLP) analysis. The colors indicate the clusters determined by amplified fragment length polymorphism (AFLP) analysis. Isolates without a color are those considered unique isolates. For the largest cluster (green; 31 isolates), only 5 isolates are presented in the figure for practical reasons. The columns on the right side of the figure indicate (per isolate row) the results of the microarray analysis (resistance genes), the location of isolate collection (NH1 or NH2, followed by the department), and the results of the phylogroup and ST131 PCR analyses. The numbers (in gray boxes) on the far right indicate the WGS isolate number and correspond to the WGS numbers presented in Fig. 2 and 3. NT, not determined.
The HAI BioDetection kit correctly identified 54 isolates as E. coli. Due to technical problems with the sample, sequence results could not be generated for 2 isolates. Figure 2 shows the phylogenetic tree produced by the HAI BioDetection v1.2 software. For each isolate, the AFLP cluster is indicated by its designated color in the figure, followed by the department designation. As shown in the figure, the BioDetection phylogenetic tree shows strong relatedness for all isolates belonging to the green AFLP cluster, whereby 5 strains in the cluster, 4 from department B2 and 1 from department C1, appeared in a slightly separate location in the tree. The arrangement of other parts of the phylogenetic tree also largely agreed with the clusters defined by AFLP and with the epidemiological data.
FIG 2.

Phylogenetic tree generated by the HAI BioDetection system in combination with AFLP results. The five AFLP clusters are indicated by colors for each isolate. Isolates considered unique by AFLP are indicated in white. The location of residence (nursing home location NH1 and NH2, building A, B, C, or D, or Department 1, 2, or 3) is indicated in capitals to the right of each circle representing an isolate. Arrows indicate isolates for which whole-genome sequencing was performed. P1, P2, and P3 refer to patients 1, 2, and 3. The scale at the bottom indicates substitutions per site relative to the 10 kb of sequence included in the analysis by the kit.
For several isolates, the results of the two typing methods yielded discordant interpretations. Specifically, there were 2 patients (P1 and P3; see Fig. 2) who carried an ESBL E. coli strain during both consecutive surveys and for whom the isolates collected in March belonged to the green (P1) and the red (P3) cluster, whereas AFLP unexpectedly resulted in unique signatures for the isolates of both patients collected in May. In the BioDetection phylogenetic tree, these isolates showed only minor divergence, and in-depth assessment of the NGS results showed a difference of 34 SNPs for the 2 isolates from patient P3 and a difference of 78 SNPs for the 2 isolates from patient P1. It should be noted that for the isolates from patient P1, inspection of the AFLP patterns revealed only minor differences (Pearson's similarity index of about 90%; see Fig. 1 [the isolates from P1 are indicated by WGS 27 and WGS 52]).
Whole-genome sequencing (WGS) was performed on a subset of 11 isolates, indicated by arrows in Fig. 2. This subset included the 4 isolates collected from the 2 patients (P1 and P3) described in the previous paragraph and 2 isolates from another patient (P2; isolates 27 and 52, both from the yellow cluster, collected in March and May [see Fig. 2]). WGS was also performed on 5 isolates with various positions in the HAI tree to determine the genetic diversity in the isolate collection: 1 isolate from the blue AFLP cluster (isolate 51) and a set of 4 isolates from the green AFLP cluster, of which 2 isolates (12 and 25) appeared in a slightly separate “group” in the HAI tree (see Fig. 2).
WGS results are shown in Fig. 3. As predicted by the placement in the HAI BioDetection tree and AFLP results and shown in panel A of the figure, WGS data from isolates 44 and 46 (P3) and isolate 51 (blue cluster) show substantial divergence from those from the other 8 isolates. To better examine the relationships among those 8 isolates, we generated a new WGS tree with higher resolution using this subset; these results are shown in panel B. In this new tree, the ordering of the 4 isolates from the green cluster (53 plus 55 versus 12 plus 25) was consistent with the HAI phylogenetic tree, and the 2 pairs of samples of patient P1 (41 plus 11) and P2 (52 plus 27) were presented as expected.
FIG 3.
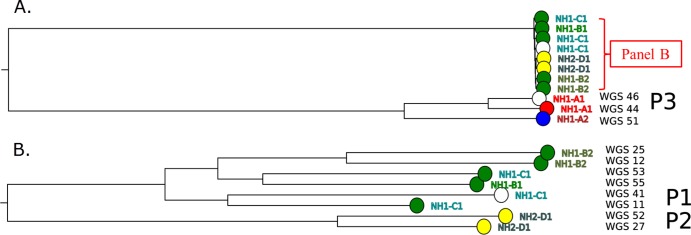
Phylogenetic tree based on whole-genome sequencing data. (A) Phylogenetic tree based on whole-genome sequencing data from the selected set of isolates (see the text). (B) Phylogenetic tree generated with higher bootstrap support values for a subset of isolates (as indicated in panel A). P1, P2, and P3 refer to patients 1, 2, and 3.
Lastly, we examined the association between the number of SNPs observed between sample pairs (55 pairs for 11 samples with WGS data) by the HAI BioDetection data and the (log-transformed) number of SNPs between the same sample pairs in the WGS data. This confirmed the correlation between the number of SNP differences detected by the BioDetection System and the true genomic distance (Pearson's correlation coefficient, 0.69; P < 0.01).
Detection of resistance genes.
An overview of the resistance genes detected by the 2 assays is provided in Table 1. CTX-M and TEM ESBL beta-lactamases were detected by microarray in 47/54 and 7/54 isolates, respectively. SHV genes were not detected. The HAI BioDetection System did not detect the CTX-M beta-lactamase gene for 1 isolate (CTX-M-1; see Table 1 [sensitivity, 98%]) and was not able to discriminate between the genes from the different CTX-M groups. TEM beta-lactamase genes were detected by microarray in 16 isolates (TEM wild type [TEM-WT], 9 isolates; TEM-ESBL, 7 isolates), while the HAI BioDetection kit found TEM beta-lactamase gene in 15 isolates (8 TEM-WT and 7 TEM-ESBL), whereby no discrimination was provided between ESBL and non-ESBL TEM beta-lactamase genes. An overview of other resistance genes that were detected by the kit is provided in Table 1. aac(6′)-Ib (encoding aminoglycoside N-acetyltransferase, which modifies aminoglycosides by acetylation) was found in 32 isolates and was found more frequently among isolates carrying CTX-M-15 (28/32) than among isolates with other CTX-M genes (4/22) (P < 0.01; Fisher's exact text). Of the isolates carrying the aac(6′)-Ib gene, 21 (66%) were resistant to tobramycin, while the 11 remaining isolates (34%) showed intermediate susceptibility.
DISCUSSION
In this collection of 56 E. coli isolates, the BioDetection phylogenetic tree correctly reflected the strong relatedness of all isolates belonging to the large outbreak cluster identified by AFLP, as well as the relatedness of isolates belonging to the smaller AFLP clusters. It should be noted that the discordant results for several isolates may be partly due to the fact that the assays were not performed simultaneously on the same culture. For the isolates that were analyzed by whole-genome sequencing, the results indicate that, although the BioDetection system sequences only a small part of the genome, the number of SNPs reported is predictive of the true genomic divergence as determined by WGS.
A limitation of the version of the HAI BioDetection software that was used is that it did not translate the typing results into a set of distinct clusters. To facilitate the interpretation of the typing results, further work on the definition of species-specific cutoffs is currently under way to improve the software so that clusters can be defined in a standardized way. Finally, although the test collection included a considerable number of E. coli isolates and consisted of several separate AFLP clusters with distinct epidemiological backgrounds, an evaluation of the typing performance with a larger collection (that reflects the diversity present among the members of the species as a whole) is justified.
The BioDetection assay accurately detected resistance genes in all but 1 CTX-M-positive isolate (sensitivity 98%), but it was unable to discriminate between ESBL and non-ESBL TEM and SHV beta-lactamases or to specify CTX-M genes by group. When the assay is used to screen direct patient material for the presence of resistance genes, an additional test is thus required in case of a positive test result. This is particularly true for TEM and SHV genes but may also be useful when CTX-M genes are detected, as discriminating between different groups of resistance genes is important for epidemiological purposes. We have no data about the prevalence of non-ESBL TEM genes in direct fecal material of the patients in this collection, as a selective culture step preceded the DNA isolation. With regard to the failure of the kit to detect an ESBL CTX-M gene for 1 isolate, we cannot exclude the possibility that plasmids carrying the resistance gene were lost during storage, a phenomenon that has been described previously (18). As reported by others (19), the aac(6′)-Ib gene coding for the aminoglycoside-modifying enzyme was found in almost all ST131 isolates.
In conclusion, the performance of the HAI BioDetection System for typing of E. coli isolates compared well with the results of AFLP. Its performance in larger collections from different locations and for typing of other species was not evaluated and needs further study. A recent study showed accurate discrimination of clonal lineages in a collection of 32 carbapenem-resistant Klebsiella pneumoniae isolates (20). Its ease of use, the ability to simultaneously detect resistance genes, and the potential to create an electronic database for surveillance are important advantages. Although the assay has good sensitivity to detect resistance genes and can be used to screen for their presence, TEM and SHV genes would need to be characterized further by an additional test.
ACKNOWLEDGMENTS
We thank the laboratory technicians of the VU University Medical Centre for their work on the AFLP.
A. Adesokan, G. Doran, S. Bruso, and A. Rolfe are members of Pathogenica and were responsible for and/or participated in the development of the HAI BioDetection System.
Footnotes
Published ahead of print 30 April 2014
REFERENCES
- 1.Rossolini GM, D'Andrea MM, Mugnaioli C. 2008. The spread of CTX-M extended-spectrum beta-lactamases. Clin. Microbiol. Infect. 14:33–41. 10.1111/j.1469-0691.2007.01867.x [DOI] [PubMed] [Google Scholar]
- 2.Livermore DM, Canton R, Gniadkowski M, Nordmann P, Rossolini GM, Arlet G, Avala J, Coque TM, Kern-Zdanowicz I, Luzzaro F, Poirel L, Woodford N. 2007. CTX-M: the changing face of ESBLs in Europe. J. Antimicrob. Chemother. 59:165–174. 10.1093/jac/dkl483 [DOI] [PubMed] [Google Scholar]
- 3.Overdevest I, Willemsen I, Rijnsburger M, Eustace A, Xu L, Hawekey P, Heck M, Savelkoul P, Vandenbroucke-Grauls C, van der Zwaluw K, Huijsdens X, Kluytmans J. 2011. Extended-spectrum beta-lactamase genes of Escherichia coli in chicken meat and humans, the Netherlands. Emerg. Infect. Dis. 17:1216–1223. 10.3201/eid1707.110209 [DOI] [PMC free article] [PubMed] [Google Scholar]
- 4.Coque TM, Baquero F, Canton R. 2008. Increasing prevalence of ESBL-producing Enterobacteriaceae in Europe. Euro Surveill. 13:19044 http://www.eurosurveillance.org/ViewArticle.aspx?ArticleId=19044 [PubMed] [Google Scholar]
- 5.Nicolle LE. 2012. Antimicrobial resistance in long-term care facilities. Future Microbiol. 7:171–174. 10.2217/fmb.11.145 [DOI] [PubMed] [Google Scholar]
- 6.Lautenbach E, Han J, Santana E, Tolomeo P, Bilker WB, Maslow J. 2012. Colonization with extended-spectrum B-lactamase-producing Escherichia coli and Klebsiella species in long-term care facility residents. Infect. Control Hosp. Epidemiol. 33:302–304. 10.1086/664055 [DOI] [PMC free article] [PubMed] [Google Scholar]
- 7.van Belkum A, Tassios PT, Dijkshoorn L, Haeggman S, Cookson B, Fry NK, Fussing V, Green J, Feil E, Gerner-Smidt P, Brisse S, Struelens M; European Society of Clinical Microbiology and Infectious Diseases (ESCMID) Study Group on Epidemiological Markers (ESGEM). 2007. Guidelines for the validation and application of typing methods for use in bacterial epidemiology. Clin. Microbiol. Infect. 13(Suppl 3):1–46 [DOI] [PubMed] [Google Scholar]
- 8.Sabat AJ, Budimir A, Nashev D, Sá-Leão R, van Dijl Jm, Laurent F, Grundmann H, Friedrich AW; ESCMID Study Group of Epidemiological Markers (ESGEM). 2013. Overview of molecular typing methods for outbreak detection and epidemiological surveillance. Euro Surveill. 18:20380 http://www.eurosurveillance.org/ViewArticle.aspx?ArticleId=20380 [DOI] [PubMed] [Google Scholar]
- 9.Cohen Stuart J, Dierikx C, Al Naiemi N, Karczmarek A, Van Hoek AH, Vos P, Fluit AC, Scharringa J, Duim B, Mevius D, Leverstein-Van Hall MA. 2010. Rapid detection of TEM, SHV and CTX-M extended-spectrum beta-lactamases in Enterobacteriaceae using ligation-mediated amplification with microarray analysis. J. Antimicrob. Chemother. 65:1377–1381. 10.1093/jac/dkq146 [DOI] [PubMed] [Google Scholar]
- 10.Cuzon G, Bogaerts P, Glupczynski Y, Nordmann P. 2012. Evaluation of a DNA microarray for the rapid detection of extended spectrum b-lactamases (TEM, SHV and CTX-M), plasmid-mediated cephalosporinases (CMY-2-like, DHA, FOX, ACC-1, ACT/MIR and CMY-1-like/MOX) and carbapenemases (KPC, OXA-48, VIM, IMP and NDM). J. Antimicrob. Chemother. 67:1865–1869. 10.1093/jac/dks156 [DOI] [PubMed] [Google Scholar]
- 11.Mohammadi T, Reesink HW, Pietersz RN, Vandenbroucke-Grauls CM, Savelkoul PH. 2005. Amplified-fragment length polymorphism analysis of Propionibacterium isolates implicated in contamination of blood products. Br. J. Haematol. 131:403–409. 10.1111/j.1365-2141.2005.05771.x [DOI] [PubMed] [Google Scholar]
- 12.Stamatakis A. 2006. RAxML-VI-HPC: maximum likelihood-based phylogenetic analyses with thousands of taxa and mixed models. Bioinformatics 22:2688–2690. 10.1093/bioinformatics/btl446 [DOI] [PubMed] [Google Scholar]
- 13.Bar-Joseph Z, Gifford DD, Jaakkola TT. 2001. Fast optimal leaf ordering for hierarchical clustering. Bioinformatics 17(Suppl 1):S22–S29. 10.1093/bioinformatics/17.suppl_1.S22 [DOI] [PubMed] [Google Scholar]
- 14.Clermont O, Christenson JK, Denamur E, Gordon DM. 2013. The Clermont Escherichia coli phylo-typing method revisited: improvement of specificity and detection of new phylo-groups. Environ. Microbiol. Rep. 5:58–65. 10.1111/1758-2229.12019 [DOI] [PubMed] [Google Scholar]
- 15.Dhanji H, Doumith M, Clermont O, Denamur E. 2010. Real-time PCR for detection of the O25b-ST131 clone of Escherichia coli and its CTX-M-15-like extended-spectrum beta-lactamases. Int. J. Antimicrob. Agents 36:355–358. 10.1016/j.ijantimicag.2010.06.007 [DOI] [PubMed] [Google Scholar]
- 16.Wirth T, Falush D, Lan R, Colles F, Mensa P, Wieler LH, Karch H, Reeves PR, Maiden MC, Ochman H, Achtman M. 2006. Sex and virulence in Escherichia coli: an evolutionary perspective. Mol. Microbiol. 60:1136–1151. 10.1111/j.1365-2958.2006.05172.x [DOI] [PMC free article] [PubMed] [Google Scholar]
- 17.Doumith M, Day MJ, Hope R, Waine J, Woodford N. 2012. Improved multiplex PCR strategy for rapid assignment of the four major Escherichia coli phylogenetic groups. J. Clin. Microbiol. 50:3108–3110. 10.1128/JCM.01468-12 [DOI] [PMC free article] [PubMed] [Google Scholar]
- 18.Smith AM, Bidochka AJ. 1998. Bacterial fitness and plasmid loss: the importance of culture conditions and plasmid size. Can. J. Microbiol. 44:351–355. 10.1139/w98-020 [DOI] [PubMed] [Google Scholar]
- 19.Johnson JR, Urban C, Weissman SJ, Jorgensen JH, Lewis JS, II, Hansen G, Edelstein PH, Robicsek A, Cleary T, Adachi J, Paterson D, Quinn J, Hanson ND, Johnston BD, Clabots C, Kuskowski MA, AMERECUS Investigators 2012. Molecular epidemiological analysis of Escherichia coli sequence type ST131 (O25:H4) and blaCTX-M-15 among extended-spectrum-β-lactamase-producing E. coli from the United States, 2000 to 2009. Antimicrob. Agents Chemother. 56:2364–2370. 10.1128/AAC.05824-11 [DOI] [PMC free article] [PubMed] [Google Scholar]
- 20.Arena F, Rolfe A, Doran G, Conte V, Gruszka S, Clarke T, Adesokan A, Giani T, Rossolini GM. 8 January 2014. Rapid resistome fingerprinting and clonal lineage profiling of carbapenem-resistant Klebsiella pneumonia by targeted next-generation sequencing. J. Clin. Microbiol. 10.1128/JCM.03247-13 [DOI] [PMC free article] [PubMed] [Google Scholar]