

Abstract
Metabotropic glutamate receptors (mGluRs) have a ubiquitous distribution in the central nervous system and often serve to regulate the release of neurotransmitters. We have previously shown that activation of both presynaptic and postsynaptic mGluRs can affect the gain of glutamatergic inputs in both thalamus and cortex. In the present study, we sought to determine the effect of mGluR activation on GABAergic inputs in cortex. Using whole cell recordings in a mouse slice preparation of either primary visual or auditory cortex (V1 or A1), we tested the effects on mGluRs by applying various agonists to the slice. Two pathways were tested in each area: the GABAergic inputs in layers 2/3 activated from layer 4 and the GABAergic inputs in layer 4 activated from adjacent layer 4. In both of these pathways, we found that activation of mGluRs significantly reduced the amplitude of the evoked inhibitory postsynaptic currents. Because the effects were not blocked by the addition of GDPβS to the recording electrode, and because mGluR agonists did not affect responses to photostimulation of GABA in a low-Ca2+ and high-Mg2+ bathing solution, we concluded this reduction was due to activation of presynaptic mGluRs. Furthermore, using specific mGluR agonists, we found that group II mGluRs, but not group I mGluRs, were involved in these modulatory effects. Because similar results were found in both pathways in V1 and A1, a possible cortical pattern for these effects is suggested.
Keywords: cortical circuit, GABA, IPSC, mGluR, modulation
metabotropic glutamate receptors (mGluRs) are G protein-coupled receptors found in many areas of the mammalian brain (Hollmann and Heinemann 1994). Previous work from our laboratory has shown that activation of mGluRs either by agonist application or by stimulation of certain glutamatergic inputs reduces the gain of synaptic transmission in other glutamatergic inputs. Both presynaptic and postsynaptic mGluRs have been implicated in this phenomenon in various combinations [reviewed in Sherman (2014)].
Recent studies have indicated the existence of mGluRs on GABAergic terminals, suggesting the possibility that activation of these receptors can modulate GABA release (Cartmell and Schoepp 2000; Pinheiro and Mulle 2008; Schoepp 2001). However, studies that tested this idea have produced a range of results. Activation of group II mGluRs has been shown to suppress GABAergic responses in hippocampus (Jouvenceau et al. 1995; Liu et al. 1993), thalamus (Salt and Eaton 1995; Salt and Turner 1998), olfactory bulb (Hayashi et al. 1993), striatum (Hanania and Johnson 1999), tectum (Farazifard and Wu 2010; Neale and Salt 2006), and parts of brain stem (Chen and Bonham 2005; Jones et al. 1998). However, group I mGluR activation appears to have no significant effect in most brain regions with the exception of striatum (Hanania and Johnson 1999; Wang et al. 1996) and some parts of brain stem (Jones et al. 1998), where it increases GABA release.
Given the importance of GABAergic circuitry in cortex (Anderson et al. 2000; DeFelipe 1993; Ferster and Miller 2000; Haglund et al. 1992; Hamberger and van Gelder 1993; Hirsch and Martinez 2006; Marco et al. 1996; Monier et al. 2003; Sherwin 1999; Wood et al. 1979) and given the widespread presence of mGluRs in cortex, we sought to investigate the effects of mGluR activation on specific GABAergic circuits in cortex. We identified GABAergic inputs from layer 4 to cells in layers 2/3 and from layer 4 to cells in adjacent locations in layer 4 in both the primary visual and primary auditory cortices in mice. We found that the activation of presynaptic group II mGluRs on GABAergic terminals in these pathways acted to reduce the gain of GABAergic processing there.
MATERIALS AND METHODS
We adopted our previously described procedures (De Pasquale and Sherman 2011, 2012, 2013; Lam and Sherman 2005; Lee and Sherman 2008; Reichova and Sherman 2004; Theyel et al. 2010); these are briefly summarized below. All procedures were approved by the Institutional Animal Care and Use Committee of the University of Chicago.
Slice Preparation
Coronal slices were prepared from BALB/c mice (aged 9–31 days; Harlan). Animals were deeply anesthetized by isoflurane inhalation (AErrane; Baxter) and then decapitated. Brains were removed and placed in cold (0–4°C), oxygenated (95% O2-5% CO2) slicing solution containing, in mM, 2.5 KCl, 1.25 NaH2PO4, 10 MgSO4, 0.5 CaCl2, 25 NaHCO3, 11 glucose, and 206 sucrose. Slices (400 μm thick) were prepared as described before (De Pasquale and Sherman 2012) and were kept in artificial cerebrospinal fluid (ACSF) containing, in mM, 125 NaCl, 25 NaHCO3, 3 KCl, 1.25 NaH2PO4, 1 MgCl2, 2 CaCl2, and 25 glucose at room temperature. In some experiments designed to block synaptic transmission, we used ACSF with a low-Ca2+ and high-Mg2+ concentration, containing, in mM, 125 NaCl, 25 NaHCO3, 3 KCl, 1.25 NaH2PO4, 1 CaCl2, 3 MgCl2, and 25 glucose.
Electrophysiology
Whole cell recordings were obtained from layers 2/3 pyramidal cells in V1 and A1 and layer 4 pyramidal cells in V1 and A1. Recording pipettes were filled with intracellular solution containing, in mM, 117 K-gluconate, 13 KCl, 1 MgCl2, 0.07 CaCl2, 10 HEPES, 0.1 EGTA, 2 Na2-ATP, 0.4 Na-GTP, and 0.1–0.5% biocytin, pH 7.3, 290 mOsm. In experiments aimed at interfering with the postsynaptic action of mGluRs, the nonhydrolyzable GTP analog GDPβS (1 mM, Sigma-Aldrich) was added to the intracellular solution to block postsynaptic G protein-coupled activity.
All experiments were performed on a visualized slice setup under a differential interference contrast-equipped Axioskop 2FS microscope (Carl Zeiss Instruments). Current- and voltage-clamp signals were collected and amplified using pCLAMP software and a MultiClamp 700B amplifier (Axon Instruments). Only cells with a stable access resistance between 12 and 20 MΩ were recorded. Hyperpolarizing currents were injected to identify Ih, whereas depolarizing currents were injected to identify regular tonic or bursting spike patterns. We recorded postsynaptic responses mostly in voltage-clamp.
In some experiments, we stimulated inputs to the recorded cells by placing a bipolar concentric electrode (FHC) in a location guided by glutamate photostimulation (i.e., uncaging) maps. We found that when recording cells in layers 2/3, the strongest response would always be recorded when the electrode was placed on layer 4 directly below the recorded cell, and a layer 4 cell would show the strongest response when the electrode was placed lateral to it in layer 4. In all experiments, the stimulating electrodes were placed at least 200 μm away from the recorded cells. Electrical stimulation consisted of four pulses at 25 Hz. The duration of each pulse was 0.1 or 0.2 ms. We used the minimal stimulation intensity that was capable of producing inhibitory postsynaptic currents (IPSCs) reliably. More specifically, for any given recorded cell, we identified the stimulation intensity that produced IPSCs ∼50% of the time. We then increased stimulation by 5-μA increments until we observed IPSCs every time, and we used this as our stimulation intensity.
Laser Photostimulation of GABA
For our GABA photostimulation experiments, we used our previously described methods for glutamate photostimulation but replaced caged glutamate with the caged GABA compound RuBi-GABA (5 μM; R&D Tocris; Verde et al. 2008). Focal photolysis of the caged GABA was accomplished by a pulsed UV laser (355-nm wavelength, frequency-tripled Nd: UVO4, 100-kHz pulse repetition rate; DPSS Lasers). Custom-made software written in MATLAB (MathWorks) was used to control the photostimulation interface (Shepherd et al. 2003).
Pharmacology
In some experiments, we bath-applied various mGluR agonists, in addition to AMPA and NMDA antagonists, as described previously (De Pasquale and Sherman 2011, 2012, 2013). These agents were delivered to the recording chamber by injecting a bolus into the flow line of the recirculating ACSF. A minimum of 5 min had to elapse following the administration of the agonists and antagonists before any stimulation protocols could commence.
AMPA and NMDA antagonists were used at the following concentrations: the AMPA receptor antagonist DNQX (R&D Tocris), 50 μM; the NMDA receptor antagonist MK-801 (Sigma-Aldrich), 40 μM. The concentration of mGluR agonists used was as follows: the general mGluR agonist ACPD (R&D Tocris), 100 μM; the group I mGluR agonist DHPG (R&D Tocris), 100 μM; the group II mGluR agonist APDC (R&D Tocris), 100 μM.
Normalization and Statistical Procedures
In most of our analyses, IPSC values represented the average of 10 trials. For each cell, IPSC values of the repeated stimulation (IPSCx) have been normalized to the value of the 1st IPSC in the control condition (IPSCcontrol-1) according to the procedure IPSCnormalized = (IPSCx/IPSCcontrol-1), expressed as a percentage. The effect of each agonist on each IPSC was evaluated using a Wilcoxon signed-rank test.
RESULTS
We recorded from a total of 142 cells: 102 in V1 and 40 in A1. V1 neurons had an average resting membrane potential of −64.6 ± 6.0 mV (mean ± SD) and an average input resistance of 281.5 ± 129.1 MΩ. The respective values for neurons in A1 were −63.2 ± 6.0 mV and 227.9 ± 129.7 MΩ. None of the recorded cells was fast-spiking. A total of 21 biocytin-filled cells (18 in V1 and 3 in A1) were successfully recovered, all of which were identified as pyramidal. No physiological or morphological differences were observed between V1 and A1 cells.
Effects on GABAergic Inputs in V1
GABAergic inputs in layers 2/3 activated from layer 4 in V1.
Figure 1A schematically illustrates the stimulation and recording arrangement for 12 cells recorded in layers 2/3 with electrical stimulation (4 pulses at 25 Hz) applied in layer 4 below each recorded cell. To help isolate and identify IPSCs, we maintained the membrane potential of each cell at 0 mV and added the AMPA and NMDA antagonists (50 μM DNQX and 40 μM MK-801, respectively) to the bath. Electrical stimulation of layer 4 evoked IPSCs in every recorded cell in layers 2/3. Furthermore, since the recordings were performed in the presence of AMPA and NMDA receptor antagonists, it is unlikely that the GABAergic responses we recorded could reflect anything other than monosynaptic activation (see also materials and methods). Initially, we stimulated at different frequencies (10, 25, and 50 Hz). No significant differences were observed with regard to IPSC amplitudes or the overall patterns of depression or facilitation at different frequencies (data not shown). We thus chose to continue the experiment using 25 Hz as our standard frequency of stimulation.
Fig. 1.

Effects of the metabotropic glutamate receptor (mGluR) agonist ACPD on the inhibitory inputs from subjacent layer 4 to cells in layers 2/3 in V1. Asterisks indicate significance of comparisons: *P < 0.05, **P < 0.01, and ***P < 0.001. A: cartoon showing the placement of a bipolar concentric electrode in layer 4 in V1 (red circle) and the recorded cell in layers 2/3 (yellow star). B: effects of ACPD on inhibitory postsynaptic currents (IPSCs) evoked by 4 pulses delivered at 25 Hz. Bi: traces showing an example experiment. Bii: graph showing the normalized amplitudes (IPSC amp) of the 4 IPSCs before (Control) and after ACPD application (ACPD) as well as those after the recovery by washing out (Wash-out). Each of the 4 IPSCs was decreased significantly by ACPD application and was partly recovered after washing out. Biii: graph showing the effects of ACPD on the ratio of the 4th IPSC to the 1st IPSC of each recorded cell and that the washing out reversed the effect on most of the cells. C: effects of ACPD and washing out on the evoked IPSCs while blocking the postsynaptic G protein-coupled pathway with GDPβS in the intracellular solution. Ci: traces showing an example experiment. Cii: graph showing the normalized amplitudes of 4 IPSCs before (Control) and after the ACPD application (ACPD) and those after washing out (Wash-out). D: effect of ACPD on direct application of GABA to recorded cells achieved by GABA photostimulation in a low-Ca2+, high-Mg2+ ACSF. Di: recording setup and example of direct GABA responses. The photomicrograph shows the recording electrode, and the yellow star shows the location of the recorded cell, with examples of outward currents evoked. Dii: evoked outward currents before (blue) and after the ACPD application (red) evoked by GABA photostimulation; the arrow shows the time of photostimulation, 100 ms after the recording starts. Diii: no significant change of ACPD was seen on outward currents. E and F: effects of the specific mGluR agonists. E: the group I mGluR agonist, DHPG, produced no significant change in evoked IPSCs. F: the group II mGluR agonist, APDC, produced a significant decrease in evoked IPSCs, and the effect could be partly reversed by washing out.
Figure 1B shows the effects of application of ACPD on the IPSCs evoked in layers 2/3. A train of four IPSCs was recorded before and during the application of ACPD. We found that the amplitudes of all four IPSCs were significantly decreased during the application of ACPD and that this decrease was reversed by washing out the ACPD (Fig. 1Bi). This effect was particularly dramatic for the first IPSC (decreased by 56%; P < 0.01) but also very strong for the second (decreased by 53%; P < 0.001), third (decreased by 42%; P < 0.01), and fourth (decreased by 30%; P < 0.01) IPSCs (Fig. 1Bii; Table 1). After the washout, the amplitudes of all 4 IPSCs were mostly recovered (the 1st IPSC back to 92% of the baseline, the 2nd IPSC back to 81% of the baseline, the 3rd IPSC back to 85% of the baseline, and the 4th IPSC back to 95% of the baseline; Table 1). In the control condition (i.e., before ACPD application), the IPSCs in 9 out of 12 cells showed a depressing pattern (i.e., each IPSC had an amplitude that was smaller than the previous), whereas 3 cells responded with facilitation (i.e., each IPSC had greater amplitude than the previous; Fig. 1Biii). Application of ACPD shifted this pattern so that 8 of the 12 cells now showed a more facilitating pattern of responses (Fig. 1Biii; P < 0.01, Wilcoxon signed-rank test). The washout reversed this effect (washout compared with the control: P > 0.05, Wilcoxon signed-rank test). The general effects of ACPD on paired-pulse dynamics suggest a presynaptic site for this change in evoked IPSCs (Dobrunz and Stevens 1997; Frick et al. 2007; Markram et al. 1998; Thomson 2000), and further experiments described below support this conclusion.
Table 1.
Effect of agonists (ACPD, DHPG, and APDC) on the amplitudes of evoked IPSCs (percentage of the 1st IPSC in control group) in V1
| L4-L2/3 | Effect of ACPD, % of the 1st Control IPSC |
GDPβS in the Intracellular Solution, % of the 1st Control IPSC |
Effect of DHPG, % of the 1st Control IPSC |
Effect of APDC, % of the 1st Control IPSC |
|||||||
|---|---|---|---|---|---|---|---|---|---|---|---|
| Average ±SE | Control | ACPD | Washout | Control | ACPD | Washout | Control | DHPG | Control | APDC | Washout |
| IPSC1 | 100 | 44.5 ± 11.2† | 92.0 ± 12.6 | 100 | 43.9 ± 5.5* | 68.5 ± 6.2 | 100 | 93.4 ± 7.0 | 100 | 48.7 ± 9.8† | 71.3 ± 14.1 |
| IPSC2 | 97.4 ± 8.4 | 44.1 ± 9.8‡ | 79.0 ± 12.1 | 80.0 ± 7.2 | 36.6 ± 2.9* | 71.6 ± 8.4 | 73.9 ± 5.9 | 71.4 ± 8.8 | 76.7 ± 6.5 | 42.1 ± 8.7† | 54.6 ± 10.7 |
| IPSC3 | 84.7 ± 8.9 | 42.5 ± 9.2† | 72.3 ± 11.6 | 70.0 ± 6.0 | 33.9 ± 3.3* | 65.6 ± 7.6 | 61.2 ± 6.7 | 57.1 ± 7.1 | 67.5 ± 7.8 | 38.3 ± 7.2* | 50.3 ± 8.4 |
| IPSC4 | 73.1 ± 9.8 | 43.1 ± 7.4† | 69.2 ± 11.0 | 64.0 ± 5.7 | 33.7 ± 3.4* | 58.3 ± 7.9 | 52.0 ± 6.3 | 48.7 ± 6.1 | 60.6 ± 6.3 | 38.6 ± 6.1† | 50.7 ± 5.8 |
| L4-L4 | Effect of ACPD, % of the 1st Control IPSC | GDPβS in the Intracellular Solution, % of the 1st Control IPSC | Effect of DHPG, % of the 1st Control IPSC | Effect of APDC, % of the 1st Control IPSC | |||||||
| Average ±SE | Control | ACPD | Washout | Control | ACPD | Washout | Control | DHPG | Control | APDC | Washout |
| IPSC1 | 100 | 38.8 ± 9.2‡ | 93.8 ± 8.7 | 100 | 49.5 ± 4.2* | 97.7 ± 9.1 | 100 | 92.8 ± 5.6 | 100 | 47.3 ± 4.8‡ | 76.6 ± 6.7 |
| IPSC2 | 96.6 ± 8.6 | 41.2 ± 7.3† | 91.5 ± 8.8 | 100.3 ± 4.6 | 51.2 ± 4.9* | 86.1 ± 9.8 | 101.9 ± 5.0 | 93.3 ± 2.2 | 94.8 ± 5.6 | 54.9 ± 3.6‡ | 65.6 ± 7.6 |
| IPSC3 | 88.1 ± 10.1 | 41.4 ± 4.8† | 89.7 ± 9.0 | 91.4 ± 3.6 | 53.3 ± 6.5* | 77.6 ± 7.4 | 99.1 ± 4.0 | 93.8 ± 5.6 | 96.4 ± 6.7 | 57.5 ± 4.8‡ | 60.5 ± 7.9 |
| IPSC4 | 86.7 ± 10.1 | 44.4 ± 6.6* | 80.4 ± 9.8 | 83.8 ± 4.1 | 49.9 ± 5.6* | 71.5 ± 7.2 | 89.5 ± 5.9 | 84.4 ± 4.2 | 85.8 ± 6.9 | 56.7 ± 4.0‡ | 60.3 ± 7.5 |
IPSCs, inhibitory postsynaptic currents; L, layer.
P < 0.05,
P < 0.01, and
P < 0.001.
A presynaptic effect should not influence the time course of IPSCs, and, to test this, we measured the effects of ACPD on the rise and decay times of the evoked IPSCs. Rise time was defined as the time elapsed between 20 and 80% of the peak value of the evoked IPSCs. Figure 2Ai shows that application of ACPD had no significant effect on this parameter for the evoked IPSCs (P > 0.1 for all comparisons on Mann-Whitney U tests). To check whether the inhibition of evoked IPSCs is associated with postsynaptic GABA receptor desensitization, we also measured the effects of ACPD on the decay time (between 80 and 20% of the peak value of the evoked IPSCs after baseline adjustment). As shown in Fig. 2Aii, the application of ACPD had no significant effect on the decay time of all 4 evoked IPSCs (P > 0.1 for all comparisons on Mann-Whitney U tests). In a complementary set of experiments, we added GDPβS to the intracellular solution for 15 additional cells recorded in layers 2/3. The goal here was to interfere with the effects of postsynaptic metabotropic receptors (see materials and methods). For 8 of the 15 cells, we obtained data from all 3 conditions: control, ACPD application, and washout; whereas for the remaining 7 cells, we obtained data for only the 1st 2 conditions. GDPβS failed to prevent the effects of ACPD on evoked IPSCs (Fig. 1, Ci and Cii; the 1st IPSC was decreased by 56%, P < 0.05; the 2nd, by 43%, P < 0.05; the 3rd, by 36%, P < 0.05; and the 4th, by 30%, P < 0.05; Wilcoxon signed-rank test; Table 1). After washing out, the amplitudes of all 4 IPSCs were mostly recovered (the 1st IPSC back to 69% of the baseline, the 2nd IPSC back to 90% of the baseline, the 3rd IPSC back to 94% of the baseline, and the 4th IPSC back to 91% of the baseline; Table 1). Furthermore, application of ACPD had no significant effect on IPSC rise or decay times (Fig. 2, Bi and Bii; P > 0.1 for all 4 IPSCs on Mann-Whitney U tests) in these experiments. These observations further support a presynaptic site for the effects of ACPD on the evoked IPSCs.
Fig. 2.

Effects of ACPD on the rise time (20–80%) and the decay time (80–20%) of the 4 evoked IPSCs in V1. A: effects of ACPD on rise time and decay time of IPSCs recorded in layers 2/3 cells while stimulating in layer 4 in V1. Ai: rise time of the 4 IPSCs before (Control) and after ACPD application (ACPD) using normal intracellular solution. ACPD application had no effect on the rise time of any of the 4 IPSCs. Aii: decay time of the 4 IPSCs before (Control) and after ACPD application (ACPD). ACPD application had no effect on the decay time of any of the 4 IPSCs. B: effects of ACPD on rise time and decay time of IPSCs recorded in layers 2/3 cells while stimulating in layer 4 in V1 with GDPβS in the intracellular solution. ACPD application produced no significant change in the rise time or the decay time of the IPSCs. C: effects of ACPD on rise time and decay time of IPSCs recorded in layer 4 cells while stimulating in an adjacent location within layer 4 in V1 using normal intracellular solution. ACPD application had no significant change in the rise time or the decay time of IPSCs. D: no significant effect of ACPD application on the rise time or the decay time of IPSCs recorded in layer 4 cells while stimulating in an adjacent location within layer 4 in V1 with GDPβS in the intracellular solution.
During the recording of an additional seven cells in layers 2/3, we attempted to isolate potential postsynaptic effects of ACPD in the following manner. Recordings were performed in a low-Ca2+ and high-Mg2+ ACSF to block synaptic transmission. While holding a cell at 0 mV, we applied RuBi-GABA to the bath and photostimulated the cell over a four-by-four matrix (50-μm spacing between points; Fig. 1Di). This directly activated the GABA receptors on the recorded cells, with some of the activation sites being dendritic, and such photostimulation produced outward currents (Fig. 1Di). ACPD application had no appreciable effects on outward currents evoked by this direct GABAergic activation on either the cell bodies or dendrites (Fig. 1D; P = 0.8). This indicates no appreciable effect on activation of postsynaptic GABA receptors by coactivating postsynaptic mGluRs.
Using the same experimental arrangement as in Fig. 1A, we applied specific mGluR agonists to eight additional cells recorded in layers 2/3 to identify the mGluRs involved in the effects shown in Fig. 1, A–C. Application of DHPG had no significant effect on the amplitude of IPSCs recorded in layers 2/3 cells following layer 4 stimulation (Fig. 1E; P > 0.05 for all 4 IPSCs, Wilcoxon signed-rank test; see Table 1 for detailed data). Application of APDC, however, resulted in a significant decrease in the amplitude of all 4 evoked IPSCs (Fig. 1F; the 1st IPSC was decreased by 51%, P < 0.01; the 2nd, by 35%, P < 0.01; the 3rd, by 29%, P < 0.05; and the 4th, by 22%, P < 0.01; Wilcoxon signed-rank test; Table 1), whereas washing out largely reversed these effects (the 1st IPSC back to 71% of the baseline, the 2nd IPSC back to 71% of the baseline, the 3rd IPSC back to 74% of the baseline, and the 4th IPSC back to 84% of the baseline; Table 1). We thus conclude that the effects documented in Fig. 1A are due to presynaptic activation of group II mGluRs.
GABAergic inputs in layer 4 activated from adjacent layer 4 locations in V1.
To test the generality of mGluR effects on GABAergic transmission, we repeated the experiments described above in another GABAergic pathway within V1. Namely, we recorded from layer 4 cells in V1 and stimulated an adjacent region in layer 4 (which was selected following glutamate photostimulation) at least 200 μm away from the recorded cell. The experimental arrangement is schematically illustrated in Fig. 3A. As before, we held the cells at 0 mV and introduced AMPA and NMDA receptor antagonists (50 μM DNQX and 40 μM MK-801) to isolate IPSCs.
Fig. 3.

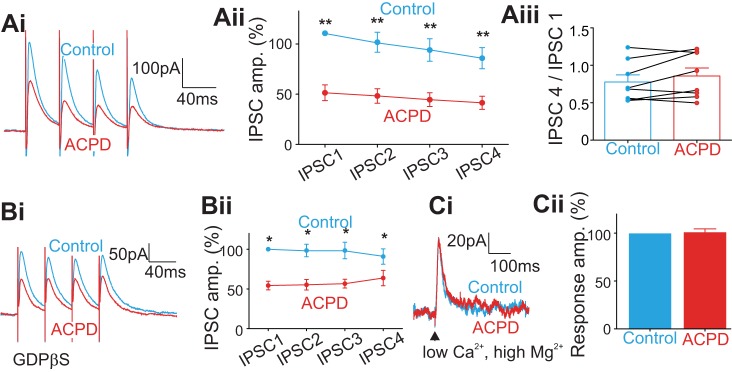
Effects of ACPD on the inhibitory inputs from adjacent layer 4 to cells in layer 4 in V1; conventions are similar to those in Fig. 1, including meaning of asterisks. A: cartoon showing the placement of a bipolar concentric electrode in layer 4 in V1 (red circle) and the recorded cell in layer 4 (yellow star) at least 200 μm away from the stimulation site. B: effects of ACPD on inhibitory responses evoked by 4 pulses delivered at 25 Hz. Bi: traces showing an example experiment. Bii: graph showing the normalized amplitudes of the 4 IPSCs before (Control) and after ACPD application (ACPD) and those after washing out (Wash-out). Each of the 4 IPSCs was decreased significantly by ACPD application and recovered after washing out. Biii: graph showing the effects of ACPD on the ratio of the 4th IPSC to the 1st IPSC of each recorded cell and that the washing out reversed the effect on most cells. C: effects of ACPD and washing out on the evoked IPSCs while blocking the postsynaptic G protein-coupled pathway with GDPβS in the intracellular solution. Ci: traces showing an example experiment. Cii: graph showing the normalized amplitudes of 4 IPSCs before (Control) and after the ACPD application (ACPD) and those after washing out (Wash-out). D: effect of ACPD on direct application of GABA to recorded cells achieved by photostimulation of GABA in a low-Ca2+, high-Mg2+ ACSF. Di: evoked outward currents before (blue) and after the ACPD application (red) evoked by photostimulation of GABA; the arrow shows the time of photostimulation 100 ms after the recording starts. Dii: no significant change of ACPD on outward currents. E and F: effects of the specific mGluR agonists. E: DHPG produced no significant change in evoked IPSCs. F: APDC produced a significant decrease in evoked IPSCs, and the effect could be partly reversed by washing out.
Figure 3B shows the effects of ACPD on IPSCs evoked in 11 cells in layer 4 of V1. As we saw for the experiment documented in Fig. 1, after ∼8 min of ACPD application, the amplitudes of all 4 IPSCs were significantly decreased (Fig. 3Bi): the 1st IPSC was decreased by 61% (P < 0.001); the 2nd, by 55% (P < 0.01); the 3rd, by 47% (P < 0.01); and the 4th, by 42% (P < 0.05, Wilcoxon signed-rank test; Fig. 3Bii; Table 1). Washout was studied in 7 of the 11 cells, and we found that it generally reversed the effects of ACPD (the 1st IPSC back to 94% of the baseline, the 2nd IPSC back to 95% of the baseline, the 3rd IPSC back to 100% of the baseline, and the 4th IPSC back to 93% of the baseline; Table 1). As with the experiment shown in Fig. 1, the ratios of the amplitudes of the 4th IPSC and the 1st IPSC were varied among the cells before ACPD with 6 showing depression and 5, facilitation (Fig. 3Biii). Following ACPD application, 9 of the 11 cells showed a more facilitating pattern of responses (Fig. 3Biii; P < 0.05, Wilcoxon signed-rank test). Among the 7 cells that got through the washing-out procedure, washout reversed the response pattern in 6 cells (P < 0.05 vs. the ACPD group, P > 0.05 vs. the control group, Wilcoxon signed-rank test). As above for the layer 4-to-layers 2/3 pathway, application of ACPD had no significant effect on the rise or decay times (Fig. 2, Ci and Cii; P > 0.1 for all 4 IPSCs on Mann-Whitney U tests).
We used the same methodology in this study of the within-layer-4 GABAergic pathway as we did in the layer 4-to-layers 2/3 pathway to test further for the presence of presynaptic vs. postsynaptic effects of ACPD. GDPβS was used in the recording electrode of 12 additional neurons to block effects due to activation of postsynaptic mGluRs. The application of ACPD induced a significant decrease of the amplitude of evoked IPSCs in layer 4 (Fig. 3Ci; Table 1): the 1st IPSC was decreased by 51% (Fig. 3Cii; P < 0.05); the 2nd, by 49% (P < 0.05); the 3rd, by 38% (P < 0.05); and the 4th, by 34% (P < 0.05). After washing out, the amplitudes of all 4 IPSCs were mostly recovered (the 1st IPSC back to 98% of the baseline, the 2nd IPSC back to 86% of the baseline, the 3rd IPSC back to 85% of the baseline, and the 4th IPSC back to 85% of the baseline; Table 1). Again, application of ACPD had no significant effect on the rise or decay times (Fig. 2, Di and Dii; P > 0.1 for all 4 IPSCs on Mann-Whitney U tests). To isolate possible postsynaptic contributions of mGluRs in reducing IPSC amplitudes in this experiment, we again used photostimulation of GABA in a low-Ca2+ and high-Mg2+ ACSF in 5 other cells. Figure 3D shows no significant effect of ACPD application on directly activated GABAergic outward currents in these experiments (Fig. 3Dii; P = 0.6). Based on these observations, we conclude that application of ACPD reduces the amplitude of GABAergic IPSCs evoked in these layer 4 cells by activating presynaptic mGluRs.
Specific mGluR agonists for this pathway were tested in additional experiments. DHPG was tested on 6 additional cells in layer 4, and this failed to affect significantly the amplitudes of IPSC evoked from lateral locations in layer 4 (Fig. 3E; Table 1; P > 0.05 for all 4 IPSCs). The application of APDC in 13 additional cells induced a significant amplitude decrease for all 4 IPSCs (Fig. 3F; Table 1): the 1st IPSC was decreased by 53% (Fig. 3Fii; P < 0.001); the 2nd, by 40% (P < 0.001); the 3rd, by 39% (P < 0.001); and the 4th, by 29% (P < 0.001); whereas washing out partly reversed the effect (the 1st IPSC back to 77% of the baseline, the 2nd IPSC back to 69% of the baseline, the 3rd IPSC back to 63% of the baseline, and the 4th IPSC back to 70% of the baseline; Table 1). Overall, the experiments in the layer 4-to-layer 4 GABAergic pathway in V1 shows the same susceptibility to mGluR activation as does the GABAergic pathway from layer 4 to layers 2/3: evoked IPSCs are decreased in amplitude by the activation of presynaptic group II mGluRs.
Effects on GABAergic Inputs in A1
To determine further the potential generality of the effects reported above for V1, we repeated a selected subset of the above experiments in A1.
GABAergic inputs in layers 2/3 activated from layer 4 in A1.
The laminar locations of the electrical stimulation and recorded cells in A1 were similar to those in V1, as shown in Fig. 1A, with the same recording and stimulation parameters. We tested the effect of ACPD on IPSCs evoked from layer 4 in eight layers 2/3 cells in A1. As in V1, these IPSCs were significantly reduced in amplitude by the application of ACPD (Fig. 4Ai; Table 2): the first IPSC was decreased by 61% (Fig. 4Aii; P < 0.05); the second, by 47% (P < 0.05); the third, by 37% (P < 0.05); and the fourth, by 30% (P < 0.01). Every cell responded with depressing IPSCs, but following ACPD application the responses moved toward facilitation in seven out of eight cells recorded (Fig. 4Aiii; P < 0.05, Wilcoxon signed-rank test). Application of ACPD had no significant effect on the rise time (Fig. 5Ai; P > 0.1 for all 4 IPSCs on Mann-Whitney U tests) or the decay times (Fig. 5Aii; P > 0.2 for all 4 IPSCs, Mann-Whitney test). We also applied GDPβS in the intracellular solution of 8 additional cells recorded in layers 2/3 and found that the amplitude of IPSCs was still reduced by ACPD application (Fig. 4Bi; Table 2): the 1st IPSC was decreased by 42% (Fig. 4Bii; P < 0.01); the 2nd, by 32% (P < 0.01); the 3rd, by 22% (P < 0.05); and the 4th, by 17% (P < 0.05). Finally, application of ACPD had no significant effect on the rise or decay times (Fig. 5, Bi and Bii; P > 0.1 for all 4 IPSCs on Mann-Whitney U tests). GABA photostimulation in 5 additional cells recorded in a low-Ca2+ and high-Mg2+ ACSF showed no significant effect of ACPD on the directly evoked outward currents (Fig. 4C; P = 0.8).
Fig. 4.

Effects of ACPD application on the inhibitory inputs from subjacent layer 4 to cells in layers 2/3 in A1; meaning of asterisks as in Fig. 1. A: the general effect of ACPD. Ai: traces showing the evoked IPSCs before and after ACPD application. Aii: graph showing the normalized amplitudes of the 4 IPSCs before and after ACPD application. Each of the 4 IPSCs was decreased significantly by ACPD application. Aiii: graph showing the effects of ACPD on the ratio of the 4th IPSC to the 1st IPSC for each recorded cell. B: effects of ACPD on the evoked IPSCs while blocking the postsynaptic G protein-coupled pathway with GDPβS in the intracellular solution. C: effect of ACPD on direct application of GABA to recorded cells achieved by photostimulation of GABA in a low-Ca2+, high-Mg2+ ACSF.
Table 2.
Effect of the agonist ACPD on the amplitudes of evoked IPSCs (percentage of the 1st IPSC in control group) in A1
| L4-L2/3 | Effect of ACPD, % of the 1st Control IPSC |
GDPβS in the Intracellular Solution, % of the 1st Control IPSC |
L4-L4 | Effect of ACPD, % of the 1st Control IPSC |
GDPβS in the Intracellular Solution, % of the 1st Control IPSC |
||||
|---|---|---|---|---|---|---|---|---|---|
| Average ±SE | Control | ACPD | Control | ACPD | Average ±SE | Control | ACPD | Control | ACPD |
| IPSC1 | 100 | 39.3 ± 11.2* | 100 | 57.6 ± 8.5† | IPSC1 | 100 | 46.5 ± 7.1† | 100 | 54.3 ± 5.4* |
| IPSC2 | 79.5 ± 3.2 | 32.9 ± 7.8* | 74.6 ± 4.3 | 42.8 ± 4.8† | IPSC2 | 92.0 ± 9.0 | 43.6 ± 6.5† | 98.4 ± 7.8 | 55.2 ± 6.6* |
| IPSC3 | 68.1 ± 3.0 | 30.9 ± 6.9* | 62.3 ± 6.4 | 39.8 ± 3.0* | IPSC3 | 84.9 ± 10.2 | 40.2 ± 6.2† | 98.4 ± 10.4 | 56.6 ± 5.5* |
| IPSC4 | 59.5 ± 2.5 | 29.1 ± 6.9† | 51.7 ± 5.9 | 34.8 ± 2.8* | IPSC4 | 77.6 ± 9.5 | 37.4 ± 5.9† | 90.8 ± 9.7 | 63.7 ± 9.6* |
P < 0.05,
P < 0.01.
Fig. 5.

Effects of ACPD on the rise time (20–80%) and the decay time (80–20%) of the 4 evoked IPSCs in A1. A: effects of ACPD on rise time and decay time of IPSCs recorded in layers 2/3 cells while stimulating in layer 4 in A1. Ai: rise time of the 4 IPSCs before (Control) and after ACPD application (ACPD) using normal intracellular solution. ACPD application had no effect on the rise time of any of the 4 IPSCs. Aii: decay time of the 4 IPSCs before (Control) and after ACPD application (ACPD). ACPD application had no effect on the decay time of any of the 4 IPSCs. B: effects of ACPD on rise time and decay time of IPSCs recorded in layers 2/3 cells while stimulating in layer 4 in A1 with GDPβS in the intracellular solution. ACPD application produced no significant change in the rise time or the decay time of the IPSCs. C: effects of ACPD on rise time and decay time of IPSCs recorded in layer 4 cells while stimulating in an adjacent location within layer 4 in A1 using normal intracellular solution. ACPD application had no significant change in the rise time or the decay time of IPSCs. D: no significant effect of ACPD application on the rise time or the decay time of IPSCs recorded in layer 4 cells while stimulating in an adjacent location within layer 4 in A1 with GDPβS in the intracellular solution.
GABAergic inputs in layer 4 activated from adjacent layer 4 locations in A1.
The stimulation and recording methods used for the investigation of the layer 4 GABAergic inputs to layer 4 cells in A1 were similar to those used in V1. In each of the eight cells recorded from layer 4, the four evoked IPSCs were reduced in amplitude by ACPD (Fig. 6Ai; Table 2): the first IPSC was decreased by 54% (Fig. 6Aii; P < 0.01); the second, by 48% (P < 0.01); the third, by 45% (P < 0.01); and the fourth, by 40% (P < 0.01). Six out of eight cells responded with depressing IPSCs. For five cells, ACPD application moved responses toward facilitation, whereas for three cells it moved responses toward depression (Fig. 6Aiii). Application of ACPD had no significant effect on the rise or decay times (Fig. 5, Ci and Cii; P > 0.1 for all 4 IPSCs on Mann-Whitney U tests). We applied GDPβS in the intracellular solution while recording from 5 additional cells for which the application of ACPD reduced the amplitude of evoked IPSCs (Fig. 6Bi; Table 2): the 1st IPSC was decreased by 46% (Fig. 6Bii; P < 0.05); the 2nd, by 43% (P < 0.05); the 3rd, by 42% (P < 0.05); and the 4th, by 27% (P < 0.05). Neither IPSC rise times (Fig. 5Di; P > 0.1 for all 4 IPSCs on Mann-Whitney U tests) nor decay times (Fig. 5Dii; P > 0.05 for all 4 IPSCs, Mann-Whitney test) were affected by ACPD application. GABA photostimulation in 6 other cells recorded in a low-Ca2+ and high-Mg2+ ACSF showed no significant effect of ACPD on the directly evoked outward currents (Fig. 6C; P = 0.9).
Fig. 6.
Effects of ACPD on the inhibitory inputs from adjacent layer 4 to cells in layer 4 in A1; meaning of asterisks as in Fig. 1. A: the general effect of ACPD. Ai: traces showing the evoked IPSCs before and after ACPD application. Aii: graph showing the normalized amplitudes of the 4 IPSCs before and after ACPD application. Each of the 4 IPSCs was decreased significantly by ACPD application. Aiii: graph showing the effects of ACPD on the ratio of the 4th IPSC to the 1st IPSC for each recorded cell. B: effects of ACPD on the evoked IPSCs while blocking the postsynaptic G protein-coupled pathway with GDPβS in the intracellular solution. C: effect of ACPD on direct application of GABA to recorded cells achieved by photostimulation of GABA in a low-Ca2+, high-Mg2+ ACSF.
Age-Dependent mGluR Effects
Inhibitory circuits in visual cortex continue to mature after birth, and the amount of GABAergic input converging onto layers 2/3 pyramidal cells undergoes a dramatic increase during the postnatal critical period (Morales et al. 2002). The ages of animals we used in our experiments ranged from 9 to 31 days postnatal (P). To determine whether the effects of mGluR activation vary with age, we pooled the data from V1 and A1 together and then split them into four age groups (<P15, P15–19, P20–25, and >P24). We then compared the effects of ACPD on the amplitude of the first evoked IPSC. Whereas ACPD decreased IPSC amplitudes significantly (compared with control conditions) in all four age groups, the decrease was particularly pronounced for the youngest age group (Fig. 7). The ACPD-induced decrease of IPSC amplitudes in the <P15 age group was significantly higher than that of the other three groups (<P15 vs. P15–19, P < 0.001; <P15 vs. P20–24, P < 0.001; <P15 vs. >P24, P < 0.05; Mann-Whitney test). However, the effects of ACPD on IPSC amplitudes were similar across the three older age groups (P > 0.05, Mann-Whitney for each comparison). These results suggest that even though ACPD had similar effects across animals of different ages, these effects were particularly prominent in animals at early stages of development.
Fig. 7.
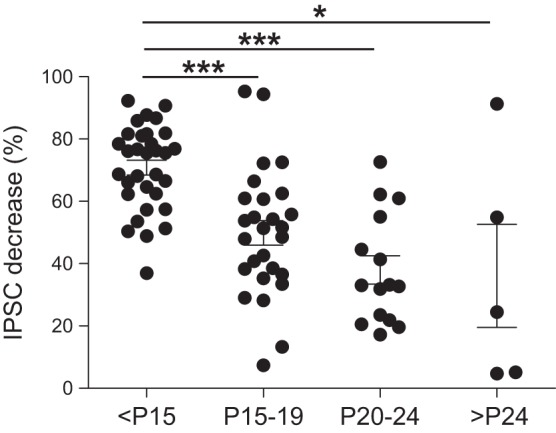
Effects of ACPD application at different ages in postnatal days (<P15, P15–19, P20–24, and >P24); meaning of asterisks as in Fig. 1. Although ACPD application decreased the amplitude of IPSCs in all 4 age groups, the decrease observed for the youngest age group was significantly higher compared with the other age groups. Each data point represents a cell. Data points within each age group have been spread out for clarity.
DISCUSSION
We have shown that application of ACPD significantly decreases the amplitude of GABAergic transmission in the layer 4-to-layers 2/3 pathway and the layer 4-to-layer 4 pathway in both V1 and A1 of mice. A similar decrease of GABAergic neurotransmission by presynaptic mGluRs has been observed in other brain regions (Chen and Bonham 2005; Farazifard and Wu 2010; Hanania and Johnson 1999; Hayashi et al. 1993; Jones et al. 1998; Jouvenceau et al. 1995; Liu et al. 1993; Neale and Salt 2006; Salt and Eaton 1995; Salt and Turner 1998). However, our data demonstrate for the first time the effects of mGluR activation on specific intracortical GABAergic pathways in V1 and A1. We also were able to show that these effects are due to activation of group II mGluRs located presynaptically, and we argue below that the presynaptic site of action is likely to be the presynaptic GABAergic terminals. The implication is that, as activity increases among certain as yet unspecified glutamatergic cortical circuits, this leads to downregulation of many GABAergic circuits through activation of these presynaptic mGluRs.
One proviso to the above is the identity of the GABAergic afferents activated in our experiments. By using photostimulation to identify a “hot spot” of cell bodies as a source of GABAergic inputs to a recorded cell and by placing fine stimulating electrodes over that hot spot, we feel that we have minimized the problem associated with also activating fibers of passage (e.g., see De Pasquale and Sherman 2011, 2012), but we make no claim that we have eliminated this possibility. However, even with some contamination of fibers of passage, this would not seriously affect our main conclusion that presynaptic mGluRs fairly consistently reduced the probability of release of different GABAergic circuits within cortex. We also note that we found some variability in short-term synaptic plasticity of IPSCs at baseline as evidenced by synaptic depression in most cells with facilitation in some. We suggest that this is due to the contribution of different GABAergic inputs for each recorded cell, a common feature for projections within cortex, with these inputs having differing patterns of short-term plasticity. Nonetheless, the activation of mGluRs in these experiments showed a general pattern of reducing depression (or increasing facilitation) in recorded cells, and given other data we describe, this is all consistent with a general reduction of probability of release in presynaptic GABAergic terminals. The only possible exception to this pattern was observed in the layer 4-to-layer 4 pathway in A1, where mGluR activation did not significantly affect short-term plasticity, although a trend to this effect was seen (Fig. 6Aiii). Whereas the reason for this difference with the results in V1 (Fig. 3Biii) is not clear, other differences between circuitry of V1 and A1 have been noted in several species, including rodents (Anderson et al. 2009; Linden and Schreiner 2003; Read et al. 2002; Smith and Populin 2001), so this possible difference is not surprising.
The presynaptic site of the affected mGluRs is supported by several independent lines of evidence: the effects were accompanied generally by appropriate reduction in synaptic depression; there were no evident changes in the time course of evoked IPSCs; addition of GDPβS to the intracellular solution did not reduce the effects of mGluR agonists; and direct responses to photostimulation of GABA in a low-Ca2+ and high-Mg2+ ACSF were not affected by mGluR agonists. There are two plausible presynaptic actions of group II mGluRs seen here. One is that activation of these receptors so hyperpolarizes the GABAergic afferent inputs that fewer respond to the electrical activation applied, resulting in a smaller IPSC. This may seem improbable, because electrical stimulation is likely to be well above activation threshold even for moderately hyperpolarized cells, but the possibility cannot be ruled out. The other possibility, that the effect is due to activation of group II mGluRs on presynaptic GABAergic terminals, seems much more likely. This is because the changes seen in short-term synaptic plasticity, namely that for the vast majority of cases the activation of group II mGluRs reduced depression, is best explained by a decrease in probability of release, leading to smaller evoked IPSCs (Dobrunz and Stevens 1997; Frick et al. 2007; Markram et al. 1998; Thomson 2000; Varela et al. 1999). This simpler explanation for the results seen clearly implicates the presynaptic GABAergic terminals as the site of action.
The advantage of reducing the gain of synaptic transmission via activation of presynaptic receptors is that specific afferents can be targeted, although it is not clear whether all GABAergic terminals targeting various postsynaptic cells from a given parent neuron possess mGluRs. Nonetheless, the fact that the present data indicate that GABAergic transmission in cortex is commonly affected through activation of presynaptic mGluRs raises the possibility that much GABAergic circuitry can be selectively regulated.
This conclusion should be considered in the context of prior work that shows that activation of certain glutamatergic inputs also downregulates glutamatergic circuits, likewise through activation of mGluRs, although evidence from various sources indicates both presynaptic and postsynaptic involvement of both group I and group II mGluRs in this latter result (De Pasquale and Sherman 2011, 2012, 2013; Lee and Sherman 2009a,b). It is interesting in this regard that the available evidence involving a number of examples indicates that activation of the relevant mGluRs always leads to a reduction of synaptic transmission and not an increase. There are two possibilities, among others, to consider here. One is that, as overall excitability rises in cortical circuits, the more active glutamatergic afferents lead to broad activation of mGluRs serving to downregulate transmission of both GABAergic and glutamatergic circuits in a roughly balanced manner, producing a sort of homeostatic mechanism for cortical circuitry. Another possibility is that glutamatergic afferents can selectively target either GABAergic or glutamatergic pathways for more specific modulation of activity levels in cortical circuits.
GRANTS
This work was supported by National Institute of Deafness and Other Communications Disorders Grant DC-008794 (to S. M. Sherman) and National Eye Institute Grant EY-022338 (to S. M. Sherman).
DISCLOSURES
No conflicts of interest, financial or otherwise, are declared by the author(s).
AUTHOR CONTRIBUTIONS
T.L., I.P., and S.M.S. conception and design of research; T.L. and I.P. performed experiments; T.L., I.P., and S.M.S. analyzed data; T.L., I.P., and S.M.S. interpreted results of experiments; T.L., I.P., and S.M.S. prepared figures; T.L., I.P., and S.M.S. drafted manuscript; T.L., I.P., and S.M.S. edited and revised manuscript; T.L., I.P., and S.M.S. approved final version of manuscript.
REFERENCES
- Anderson JS, Carandini M, Ferster D. Orientation tuning of input conductance, excitation, and inhibition in cat primary visual cortex. J Neurophysiol 84: 909–926, 2000 [DOI] [PubMed] [Google Scholar]
- Anderson LA, Christianson GB, Linden JF. Mouse auditory cortex differs from visual and somatosensory cortices in the laminar distribution of cytochrome oxidase and acetylcholinesterase. Brain Res 1252: 130–142, 2009 [DOI] [PubMed] [Google Scholar]
- Cartmell J, Schoepp DD. Regulation of neurotransmitter release by metabotropic glutamate receptors. J Neurochem 75: 889–907, 2000 [DOI] [PubMed] [Google Scholar]
- Chen CY, Bonham AC. Glutamate suppresses GABA release via presynaptic metabotropic glutamate receptors at baroreceptor neurones in rats. J Physiol 562: 535–551, 2005 [DOI] [PMC free article] [PubMed] [Google Scholar]
- De Pasquale R, Sherman SM. A modulatory effect of the feedback from higher visual areas to V1 in the mouse. J Neurophysiol 109: 2618–2631, 2013 [DOI] [PMC free article] [PubMed] [Google Scholar]
- De Pasquale R, Sherman SM. Modulatory effects of metabotropic glutamate receptors on local cortical circuits. J Neurosci 32: 7364–7372, 2012 [DOI] [PMC free article] [PubMed] [Google Scholar]
- De Pasquale R, Sherman SM. Synaptic properties of corticocortical connections between the primary and secondary visual cortical areas in the mouse. J Neurosci 31: 16494–16506, 2011 [DOI] [PMC free article] [PubMed] [Google Scholar]
- DeFelipe J. Neocortical neuronal diversity: chemical heterogeneity revealed by colocalization studies of classic neurotransmitters, neuropeptides, calcium-binding proteins, and cell surface molecules. Cereb Cortex 3: 273–289, 1993 [DOI] [PubMed] [Google Scholar]
- Dobrunz LE, Stevens CF. Heterogeneity of release probability, facilitation, and depletion at central synapses. Neuron 18: 995–1008, 1997 [DOI] [PubMed] [Google Scholar]
- Farazifard R, Wu SH. Metabotropic glutamate receptors modulate glutamatergic and GABAergic synaptic transmission in the central nucleus of the inferior colliculus. Brain Res 1325: 28–40, 2010 [DOI] [PubMed] [Google Scholar]
- Ferster D, Miller KD. Neural mechanisms of orientation selectivity in the visual cortex. Annu Rev Neurosci 23: 441–471, 2000 [DOI] [PubMed] [Google Scholar]
- Frick A, Feldmeyer D, Sakmann B. Postnatal development of synaptic transmission in local networks of L5A pyramidal neurons in rat somatosensory cortex. J Physiol 585: 103–116, 2007 [DOI] [PMC free article] [PubMed] [Google Scholar]
- Haglund MM, Berger MS, Kunkel DD, Franck JE, Ghatan S, Ojemann GA. Changes in gamma-aminobutyric acid and somatostatin in epileptic cortex associated with low-grade gliomas. J Neurosurg 77: 209–216, 1992 [DOI] [PubMed] [Google Scholar]
- Hamberger A, van Gelder NM. Metabolic manipulation of neural tissue to counter the hypersynchronous excitation of migraine and epilepsy. Neurochem Res 18: 503–509, 1993 [DOI] [PubMed] [Google Scholar]
- Hanania T, Johnson KM. Regulation of NMDA-stimulated [14C]GABA and [3H]acetylcholine release by striatal glutamate and dopamine receptors. Brain Res 844: 106–117, 1999 [DOI] [PubMed] [Google Scholar]
- Hayashi Y, Momiyama A, Takahashi T, Ohishi H, Ogawa-Meguro R, Shigemoto R, Mizuno N, Nakanishi S. Role of a metabotropic glutamate receptor in synaptic modulation in the accessory olfactory bulb. Nature 366: 687–690, 1993 [DOI] [PubMed] [Google Scholar]
- Hirsch JA, Martinez LM. Circuits that build visual cortical receptive fields. Trends Neurosci 29: 30–39, 2006 [DOI] [PubMed] [Google Scholar]
- Hollmann M, Heinemann S. Cloned glutamate receptors. Annu Rev Neurosci 17: 31–108, 1994 [DOI] [PubMed] [Google Scholar]
- Jones NM, Monn JA, Beart PM. Type I and II metabotropic glutamate receptors regulate the outflow of [3H]d-aspartate and [14C]gamma-aminobutyric acid in rat solitary nucleus. Eur J Pharmacol 353: 43–51, 1998 [DOI] [PubMed] [Google Scholar]
- Jouvenceau A, Dutar P, Billard JM. Presynaptic depression of inhibitory postsynaptic potentials by metabotropic glutamate receptors in rat hippocampal CA1 pyramidal cells. Eur J Pharmacol 281: 131–139, 1995 [DOI] [PubMed] [Google Scholar]
- Lam YW, Sherman SM. Mapping by laser photostimulation of connections between the thalamic reticular and ventral posterior lateral nuclei in the rat. J Neurophysiol 94: 2472–2483, 2005 [DOI] [PubMed] [Google Scholar]
- Lee CC, Sherman SM. Glutamatergic inhibition in sensory neocortex. Cereb Cortex 19: 2281–2289, 2009a [DOI] [PMC free article] [PubMed] [Google Scholar]
- Lee CC, Sherman SM. Modulator property of the intrinsic cortical projection from layer 6 to layer 4. Front Syst Neurosci 3: 1–5, 2009b [DOI] [PMC free article] [PubMed] [Google Scholar]
- Lee CC, Sherman SM. Synaptic properties of thalamic and intracortical inputs to layer 4 of the first- and higher-order cortical areas in the auditory and somatosensory systems. J Neurophysiol 100: 317–326, 2008 [DOI] [PMC free article] [PubMed] [Google Scholar]
- Linden JF, Schreiner CE. Columnar transformations in auditory cortex? A comparison to visual and somatosensory cortices. Cereb Cortex 13: 83–89, 2003 [DOI] [PubMed] [Google Scholar]
- Liu YB, Disterhoft JF, Slater NT. Activation of metabotropic glutamate receptors induces long-term depression of GABAergic inhibition in hippocampus. J Neurophysiol 69: 1000–1004, 1993 [DOI] [PubMed] [Google Scholar]
- Marco P, Sola RG, Pulido P, Alijarde MT, Sánchez A, Ramón y Cajal S, DeFelipe J. Inhibitory neurons in the human epileptogenic temporal neocortex. An immunocytochemical study. Brain 119: 1327–1347, 1996 [DOI] [PubMed] [Google Scholar]
- Markram H, Wang Y, Tsodyks M. Differential signaling via the same axon of neocortical pyramidal neurons. Proc Natl Acad Sci USA 95: 5323–5328, 1998 [DOI] [PMC free article] [PubMed] [Google Scholar]
- Monier C, Chavane F, Baudot P, Graham LJ, Fregnac Y. Orientation and direction selectivity of synaptic inputs in visual cortical neurons: a diversity of combinations produces spike tuning. Neuron 37: 663–680, 2003 [DOI] [PubMed] [Google Scholar]
- Morales B, Choi SY, Kirkwood A. Dark rearing alters the development of GABAergic transmission in visual cortex. J Neurosci 22: 8084–8090, 2002 [DOI] [PMC free article] [PubMed] [Google Scholar]
- Neale SA, Salt TE. Modulation of GABAergic inhibition in the rat superior colliculus by a presynaptic group II metabotropic glutamate receptor. J Physiol 577: 659–669, 2006 [DOI] [PMC free article] [PubMed] [Google Scholar]
- Pinheiro PS, Mulle C. Presynaptic glutamate receptors: physiological functions and mechanisms of action. Nat Rev Neurosci 9: 423–436, 2008 [DOI] [PubMed] [Google Scholar]
- Read HL, Winer JA, Schreiner CE. Functional architecture of auditory cortex. Curr Opin Neurobiol 12: 433–440, 2002 [DOI] [PubMed] [Google Scholar]
- Reichova I, Sherman SM. Somatosensory corticothalamic projections: distinguishing drivers from modulators. J Neurophysiol 92: 2185–2197, 2004 [DOI] [PubMed] [Google Scholar]
- Salt TE, Eaton SA. Distinct presynaptic metabotropic receptors for l-AP4 and CCG1 on GABAergic terminals: pharmacological evidence using novel α-methyl derivative mGluR antagonists, MAP4 and MCCG, in the rat thalamus in vivo. Neuroscience 65: 5–13, 1995 [DOI] [PubMed] [Google Scholar]
- Salt TE, Turner JP. Modulation of sensory inhibition in the ventrobasal thalamus via activation of group II metabotropic glutamate receptors by 2R,4R-aminopyrrolidine-2,4-dicarboxylate. Exp Brain Res 121: 181–185, 1998 [DOI] [PubMed] [Google Scholar]
- Schoepp DD. Unveiling the functions of presynaptic metabotropic glutamate receptors in the central nervous system. J Pharmacol Exp Ther 299: 12–20, 2001 [PubMed] [Google Scholar]
- Shepherd GM, Pologruto TA, Svoboda K. Circuit analysis of experience-dependent plasticity in the developing rat barrel cortex. Neuron 38: 277–289, 2003 [DOI] [PubMed] [Google Scholar]
- Sherman SM. The function of metabotropic glutamate receptors in thalamus and cortex. Neuroscientist 20: 136–149, 2014 [DOI] [PMC free article] [PubMed] [Google Scholar]
- Sherwin AL. Neuroactive amino acids in focally epileptic human brain: a review. Neurochem Res 24: 1385–1395, 1999 [DOI] [PubMed] [Google Scholar]
- Smith PH, Populin LC. Fundamental differences between the thalamocortical recipient layers of the cat auditory and visual cortices. J Comp Neurol 436: 508–519, 2001 [DOI] [PubMed] [Google Scholar]
- Theyel BB, Llano DA, Sherman M. The corticothalamocortical circuit drives higher-order cortex in the mouse. Nat Neurosci 13: 84–88, 2010 [DOI] [PMC free article] [PubMed] [Google Scholar]
- Thomson AM. Facilitation, augmentation and potentiation at central synapses. Trends Neurosci 23: 305–312, 2000 [DOI] [PubMed] [Google Scholar]
- Varela JA, Song S, Turrigiano GG, Nelson SB. Differental depression at excitatory and inhibitory synapses in visual cortex. J Neurosci 19: 4293–4304, 1999 [DOI] [PMC free article] [PubMed] [Google Scholar]
- Verde EM, Zayat L, Etchenique R, Yuste R. Photorelease of GABA with visible light using an inorganic caging group. Front Neural Circuits 2: 2, 2008 [DOI] [PMC free article] [PubMed] [Google Scholar]
- Wang J, Lonart G, Johnson KM. Glutamate receptor activation induces carrier mediated release of endogenous GABA from rat striatal slices. J Neural Transm 103: 31–43, 1996 [DOI] [PubMed] [Google Scholar]
- Wood JH, Hare TA, Glaeser BS, Ballenger JC, Post RM. Low cerebrospinal fluid gamma-aminobutyric acid content in seizure patients. Neurology 29: 1203–1208, 1979 [DOI] [PubMed] [Google Scholar]