

Abstract
Self-motion generates patterns of optic flow on the retina. Neurons in the dorsal part of the medial superior temporal area (MSTd) are selective for these optic flow patterns. It has been shown that neurons in this area that are selective for expanding optic flow fields are involved in heading judgments. We wondered how subpopulations of MSTd neurons, those tuned for expansion, rotation or spiral motion, contribute to heading perception. To investigate this question, we recorded from neurons in area MSTd with diverse tuning properties, while the animals performed a heading-discrimination task. We found a significant trial-to-trial correlation (choice probability) between the MSTd neurons and the animals' decision. Neurons in different subpopulations did not differ significantly in terms of their choice probability. Instead, choice probability was strongly related to the sensitivity of the neuron in our sample, regardless of tuning preference. We conclude that a variety of subpopulations of MSTd neurons with different tuning properties contribute to heading judgments.
Keywords: self-motion perception, heading judgment, direction computation, optic flow field, single unit electrophysiological recording
when navigating through the environment, the visual surroundings generate an optic flow field on our retinae. There is a geometric relationship between a given direction of self-motion (heading) and the resulting optic flow field. In principle, the latter can be used to infer the former. Human observers are able to use the information contained in optic flow fields to inform heading direction (Gibson 1955, 1958). Moreover, humans are quite good at doing so, being able to discriminate heading differences of 1° or less, based on the visual information provided by optic flow field alone (Warren and Hannon 1988, 1990).
Physiological studies in primates suggest that the neural basis of this ability is a network of cortical areas that support the choice of heading (Britten 2008), and the dorsal part of the medial superior temporal area (MSTd) is most likely a crucial cortical area in this network (Britten and van Wezel 1998; Gu et al. 2008). Neurons in area MSTd have large receptive field (15–100° in diameter; Duffy and Wurtz 1991a), extending ipsilaterally, and are known to respond to several elementary types of optic flow: expansion, contraction, rotation, and translation. Any given neuron preferentially responds to a single type or a combination of these optic flow types (Duffy and Wurtz 1991a; Graziano et al. 1994; Tanaka et al. 1986). The combinations correspond to complex patterns of optic flow in physical space; for instance the combination of contracting and rotating optic flow yields a spiral stimulus. In addition, MSTd neurons are tuned for the “focus of expansion” (FOE) in the flow field (Duffy and Wurtz 1995). The FOE is the point from which all motion vectors expand, indicating the direction of heading. Humans can accurately judge direction of heading by observing the location of the FOE in the flow field (Warren and Hannon 1988). More recently, seminal studies by the groups of Angelaki and DeAngelis have shown that the activity of MSTd neurons is correlated with heading direction judgment (Gu et al. 2010), and established a causal link between these neural activities in MSTd with heading perception, especially for visual optic flow, via microstimulation and reversible inactivation techniques (Gu et al. 2012). Finally, MST neurons are also closely linked to a variety of other neural systems: they respond to vestibular cues (Gu et al. 2006, 2008) and are selective for pursuit eye movement (Komatsu and Wurtz 1988a, 1988b; Newsome et al. 1988). As MSTd neurons are involved in heading judgments that are influenced by vestibular signals and pursuit eye movements, in addition to the cues from optic flow, we wondered how different subpopulations of MSTd neurons, specifically neurons selective for radial (Vradial), rotation (Vrotation), and spiral motion, respectively, contribute to heading judgments. Thus, in the present study, we aimed to establish whether these different subpopulations in area MSTd are involved in heading computation and, if so, to what degree.
To do so, we trained two macaque monkeys to perform a fine-discrimination heading-direction task while recording from several subsets of MSTd neurons, including the subset that prefers rotating optic flow. Preliminary results were reported in abstract form (Xu et al. 2006).
MATERIALS AND METHODS
Recording and Surgical Methods
We recorded the electrical activity of individual, well-isolated neurons in area MSTd of two macaque monkeys (Macaque Mulatta): D (male) and M (female). Prior to behavioral training of the animals, we sited an acrylic cap that accommodated a head stabilization system as well as a stainless steel recording cylinder. This cylinder was centered at Horsely-Clarke coordinates 15 mm lateral and 2 mm anterior (Duffy and Wurtz 1991a; Tanaka et al. 1986) for easy access to area MSTd in a dorsoventral approach. We also inserted a scleral search coil (Judge et al. 1980) to monitor eye position. These methods have previously been detailed elsewhere (Duffy and Wurtz 1997; 1995).
During the daily recording sessions, we identified MSTd neurons based on the following anatomical landmarks and physiological criteria: 1) known depth below the dura; 2) known white/gray matter transitions; 3) large receptive fields, exceeding a size of 50°; 4) receptive field centers that are in the contralateral hemifield, but extend at least 2° ipsilaterally and including the fovea [this point is particularly important to differentiate from middle temporal (MT) and ventral medial superior temporal neurons]; 5) optic flow type selectivity (expansion, contraction, clockwise, counterclockwise rotation, and spiral, Fig. 1), using the method of vector analysis (details in materials and methods section); 6) the above selectivity is position invariant within the receptive field (Duffy and Wurtz 1991b), using a smaller dot field stimulus (20° in diameter); although the actual firing rate (FR) may be different, the relative response or the preference among the different flow types remains the same at different locations within the receptive field; and 7) known location relative to area MT (Shenoy et al. 1999, 2002). During the tuning test, each stimulus was repeated five times and presented in random order. After establishing the recording site to be in MSTd, the waveforms of single MSTd neurons were isolated by a window discriminator (FHC) and recorded with the “Digitizer” (Plexon) software. Spikes and waveforms were saved and sorted offline with the “OfflineSorter” software (Plexon) prior to analysis. Following the identification and stable isolation of an MSTd neuron, we determined the FOE tuning of each neuron, after which we recorded behavioral and neural activity during the heading-direction discrimination-task performed by the animal. All procedures and protocols were approved by the University of Chicago Institutional Animal Care and Use Committee and followed US Department of Agriculture as well as American Association for Accreditation of Laboratory Animal Care guidelines for the ethical use of animals in research.
Fig. 1.
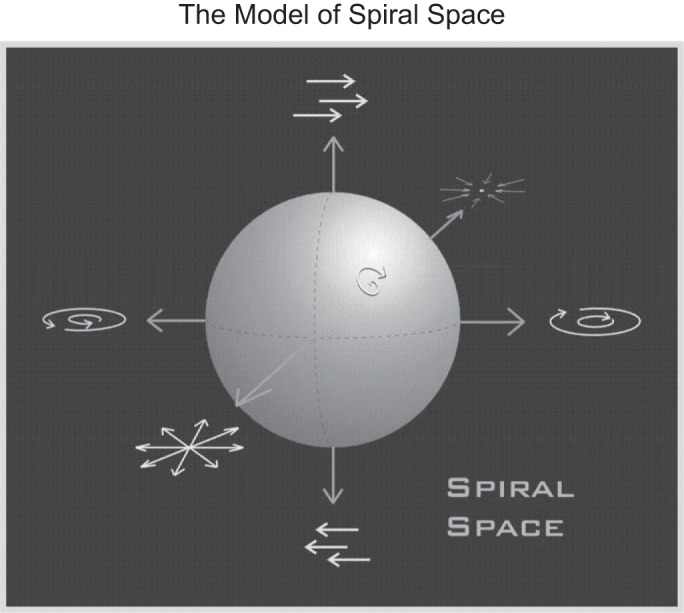
Spiral space model. We propose that neurons in the dorsal part of the medial superior temporal area (MSTd) not only respond to individual elementary optic flow types or discrete combinations thereof, but that this area is actually tuned to motion in three-dimensional (3D) space in a continuous way, what we call “spiral space” tuning. For example, 1) adding clockwise (CW) rotation motion and contraction (Con) motion yields one type of spiral motion, corresponding to moving backward and torsional eye movement or roll rotation in a real situation; 2) adding laminar motion (e.g., left) to radial motion [e.g., expansion (Exp)] yields tuning for a particular focus of expansion (FOE) location or direction of heading in real situation. The model suggests that MSTd neurons respond to all possible motion types in this 3D space, covering it entirely, in analogy to a retinotopic map or to feature maps (e.g., motion) in other areas, such as middle temporal (MT).
Visual Stimulation
Optic-flow stimuli were generated to simulate the approach to a frontoparallel wall by an individual moving forward at a particular heading direction and an approach speed of 40 cm/s (Longuet-Higgins and Prazdny 1980). Stimulus size was as large as possible, given our 40-in. LCD screen (Samsung SyncMaster 403T, Korea, 80 × 60°) at a viewing distance of 57 cm. Dot density was 0.3 dots/degree2 with an individual dot luminance of 42 cd/m2 (background luminance 2 cd/m2) at a refresh rate of 85 Hz. After establishing the FOE tuning, the animal performed a heading direction discrimination task. Here, each trial consisted of two stimuli, optic flow fields corresponding to simulated self-motion that were each presented for a duration of 600 ms, separated by an interstimulus interval of 500 ms. The first stimulus served as a reference, with a FOE position placed in the center of the screen. The second, test-stimulus, was placed at FOE locations within ±10° of visual angle relative to the “reference” stimulus. Thus reference and test stimuli differed solely in terms of the azimuthal locus of FOE which was selected randomly from the set (in degrees) (−9.9, −3.0, −2.5, −2.0, −1.5, −1.0, −0.5, −0.25, −0.1, 0, 0.1, 0.25, 0.5, 1.0, 1.5, 2.0, 2.5, 3.0, 9.9) for animal D and (−9.9, −5.0, −3.0, −1.0, −0.5, 0, 0.5, 1.0, 3.0, 5.0, 9.9) for animal M (due to the different lengths of training for animals D and M, the points on the psychometric curve were not identical), where negative values indicate positions left to the reference, while positive values denote those to the right of the reference. Each stimulus combination was repeated for 30 times.
Behavioral Task
While we recorded the electrical activity from single neurons in area MSTd, the animals were performing a fine-discrimination heading-direction task: two alternative forced choice task (2-AFC).
Each trial of this task began when the animal fixated a small dot in the center of the screen. The animal was required to maintain fixation within 0.5° of the dot until it disappeared. If the gaze position moved beyond these limits, the trial was aborted, and the data from the trial were not used in the analysis. While the dot was on the screen, the reference and test stimuli were successively shown for 600 ms each, with a 500-ms interstimulus interval. If the animal kept fixation up until this point, the fixation dot was extinguished 500 ms after the end of the test stimulus. Then two dots appeared on the screen, flanking the location of the previously shown fixation dot. The monkey indicated the direction of the test stimulus relative to the reference by saccading to one of these dots. If the judgment of the monkey was correct, a juice reward was delivered (see Fig. 2).
Fig. 2.
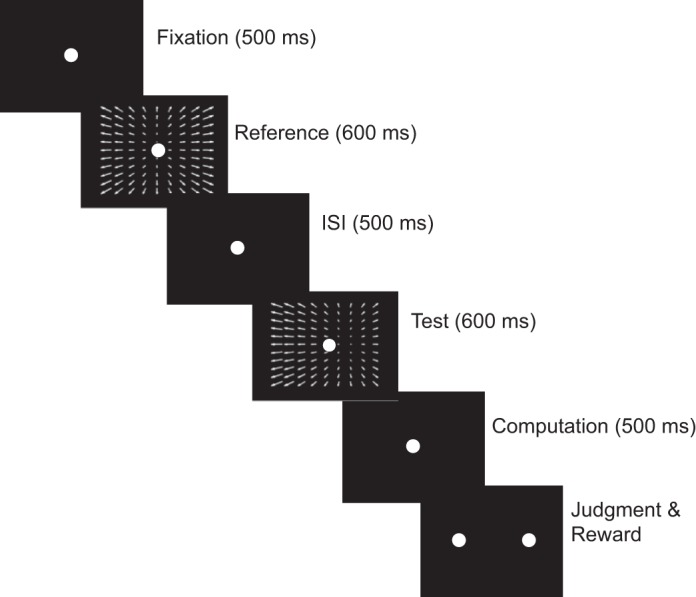
Trial sequence. During the experiment, the animal fixates on a small dot in the center of the screen for 500 ms. The animal is required to maintain fixation within 0.5° until the dot disappears. While the dot is on the screen, a first stimulus (“reference”) is shown for a duration of 600 ms. After an interstimulus interval (ISI) of 500 ms, a second stimulus (“test”) is shown for another 600 ms. The fixation dot is extinguished 500 ms after the end of the test stimulus. Two dots then appear on the screen, flanking the location of the previously shown fixation dot. The animal indicates the direction of the test stimulus relative to the reference stimulus by saccading to one of the dots (left or right). If the judgment of the animal is correct, a juice reward is given.
We started electrophysiological recordings when behavioral performance had stabilized (80% correct trials).
Data Analysis
Vector analysis.
The preferred motion type is the type that elicits the maximal neural response, and the strength of selectivity is characterized by the tuning index (TI). TI is calculated as normalizing the relative response between the maximal response and minimal responses by a combination of the two responses, such as TI = FRmax − FRmin/FRmax + FRmin. We tried this method first, but this TI method could not capture the circular feature of the optic flow type (shown in Fig. 1). Vradial (expansion and contraction) exhibits a phase difference 180°, as does clockwise and counterclockwise Vrotation. The combination between Vradial and Vrotation is also called “spiral motion.” In real situations, Vradial simulates the motion that derives from moving forward or backward, while Vrotation naturally occurs in a situation of roll relative to the environment or due to torsional eye movements; spiral motion results from a combination of both situations at the same time.
To account for this, we used the method of vector analysis (Crowe 1967) to decompose the neural responses onto the Vradial and Vrotation: Vradial = FR × cosine(α) and Vrotation = FR × cosine(β), in which α is the angle between the spiral motion and the expansion motion, and β is the angle between the spiral motion and the Vrotation. The preference is first decided by the summation of responses of the two vectors (Vradial and Vrotation) and whether the summation is greater than 0 by t-test. When it is greater than 0, we conducted paired comparison (paired t-test) to see whether Vradial is significantly different from Vrotation for each unit. If the Vradial is significantly larger than Vrotation, we classify the cell as radial cell (expansion or contraction, depending the value of α: α = 0° is the expansion cell; α = 180° is the contraction cell, although we have a very limited number of contraction cells in our sample, due to the type of visual stimuli we displayed at the test-simulating forward motion). If the Vrotation is significantly larger than Vradial, we classify the cell as a rotation cell (clockwise or counterclockwise, depending the value of α: α = 90° is the clockwise rotation tuned cell; α = 270° is the counterclockwise rotation tuned cell). If there is no significant difference between the two components, and the α is in between 0° to 90° or 90° to 180°, or 180° to 270°, or 270° to 360°, we classify it as spiral tuned cell.
Metrics of behavioral performance.
The percentage of correct trials is converted to the probability of rightward choices [P(rightward choices)]. We then arrange these probabilities by the difference of the location in FOE between test and reference stimulus in the behavioral task and fit a cumulative Gaussian curve to the observed data. The resulting curve is the psychometric curve, given as P(rightward) = (where x is the FOE difference in the observed data; μ and σ are the estimated parameters, mean and standard deviation for the observed data under the assumption of a normal distribution). We define the psychometric threshold as 80% rightward choices (Britten et al. 1992), corrected for its bias at point of subjective equality (PSE, or 50% rightward choices). Behavioral sensitivity is also measured by the slope of the psychometric curve at PSE, which is inversely proportional to the standard deviation (σ) of the Gaussian curve fit.
Metrics of neural performance.
We define these measures in analogy to the behavioral performance and thus take into account that the neuron (with minimal 20 trials) has a higher FR if the stimulus matches or is close to its preferred FOE. For a given neuron that prefers FOE to the right of the reference, the neural data for each trial is grouped into two distributions: neural responses to the reference stimulus and to the test stimulus that is closer to its FOE preference. We then estimate the area under curve (Green and Swets 1966) and convert this number into percentage of rightward choices. Therefore, the estimated neural performance of the ideal observer is P(rightward) = [ P(s/Test)ds]P(r/REF)dr, where s is the neural responses for the test stimulus, and r is the neural responses for the reference (REF) stimulus (Purushothaman and Bradley 2005). Conversely, if the neuron prefers FOE at the left to the reference, P(rightward) = 1 − [ P(s/Test)ds]P(r/REF)dr. We then fit the estimated neural performance data with a cumulative Gaussian curve to arrive at estimates of neurometric performance. Like the psychometric threshold, the neurometric threshold is defined as 80% rightward choices, corrected for bias at the PSE. Neural sensitivity is also measured by the slope of the neurometric curve at PSE, inversely proportional to the standard deviation of the Gaussian curve fit.
Metrics of the relationship between neural activity and behavioral performance: choice probability.
We estimate the trial-to-trial correlation between neural activity and behavioral performance based on signal detection theory (Green and Swets 1966) by calculating the choice probability (CP). To do so, we utilize ambiguous trials, trials in which both test and reference stimuli have the same FOE positions (or FOE difference is 0). For a given neuron with minimal 20 trials, we group its neural responses for these trials by the choice of the animal (leftward or rightward) and then compare their relative FRs. If the FR for a neuron preferring FOEs to the left is higher than average for a leftward choice, the trial would be labeled as a “hit”; a rightward choice as a “false alarm” and vice versa. From this data, we construct a receiver operator characteristic curve and calculate the area under the curve, which corresponds to the CP of a neuron (Britten et al. 1996). To test the significance of each unit's CP, we used a bootstrap approach (Britten et al. 1996; Efron and Tibshirani 1993). We randomly permuted the data from each trial, keeping the same distributions of neural activities and behavioral responses individually, but not the association between the two. We then calculated the CP from this sample. This permutation was repeated 2,000 times, and we calculated the 95% confidence interval of the CP empirically.
An alternative way to compute CPs is to calculate them based on the response to test stimuli alone. For test stimuli with a FOE position at the center, we group the neural responses for these trials by the choice of the animal (leftward or rightward) and compare the relative FRs for these two groups and then calculate the corresponding CP in the same way as above.
Relating neurometric and behavioral performance.
We calculate the ratio between the neurometric threshold and the psychometric threshold as measured in Vector analysis and Metrics of behavioral performance above and define it as N/P ratio. This ratio indicates the sensitivity of a neuron relative to the animal. We would take a N/P ratio close to 1 as an indication that the neuron is about as sensitive as the monkey on the task. If, however, the N/P ratio is larger than 1, the neuron appears to be less sensitive than the monkey. This allows us to compare the sensitivities of the animals to that of their individual MSTd neurons.
All analysis detailed above was conducted in Matlab, R or SPSS software.
RESULTS
We recorded the neural activity of 198 well-isolated single neurons in area MSTd while the two animals (D and M) performed a fine heading direction discrimination task. We were forced to discard data from some neurons, as the animals did not perform enough trials to calculate reliable response parameters when data from these neurons were recorded. This was the case for 26 neurons and 35 neurons for the N/P ratio and CP, respectively. Hence, our analysis of the N/P ratio includes data from 172 MSTd neurons, whereas our analysis of CPs includes data from 163 neurons.
Response Properties of MSTd Neurons
A sample MSTd neuron is shown in Fig. 3 to demonstrate its preference for expansion and counterclockwise rotation, corresponding to spiral motion. We further divided flow types into radial, rotation, or spiral, using the vector analysis method (see section on Vector analysis in Data Analysis for details), based on whether the neurons exhibited a significant response to a single component of Vradial, such as expansion and contraction, or Vrotation such as clockwise or counterclockwise; or two components, such as any combination of Vradial and Vrotation, the spiral motion. Based on our classification, we counted 27 expansion cells, 12 contraction cells, 29 rotation cells (12 clockwise and 17 counterclockwise), and 104 spiral cells among our sample of 172 neurons. Testing for FOE tuning suggests that this neuron prefers rightward FOE with a peak response near 30° right of the center. This preference is used for fitting the neurometric curve and computing the neurometric threshold (see the section on Metrics of the relationship between neural activity and behavioral performance in Data Analysis for details). Out of the total 172 neurons in our sample, 84 cells were tuned for left FOEs and 88 for right FOEs.
Fig. 3.
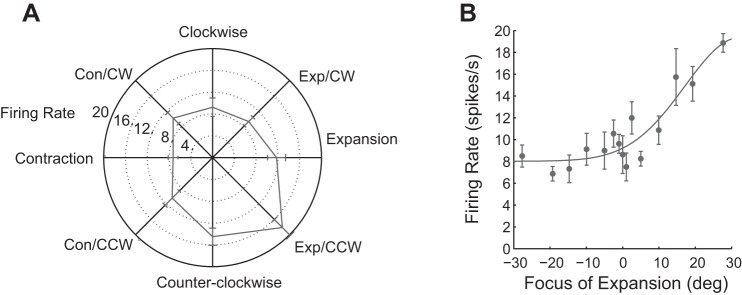
Example neuron illustrating spiral and FOE tuning of an MSTd neuron. Neural responses were averaged for at least 20 repetitions. The error bar is the standard error of the mean (SEM). Firing rate is measured in spikes per second. A: spiral tuning of the neuron in polar coordinates: average neural responses were plotted as the distance from the center. This neuron is tuned to Exp and counterclockwise (CCW) motion, spiral motion. B: the same neuron's FOE tuning: average neural responses were plotted as a function of FOE. This neuron responds strongly for a rightward FOE, about 30° to the right.
Behavioral Performance
The behavioral responses of the animals were recorded while they were performing the heading discrimination task. The average psychometric threshold for monkey D was 0.81° (−0.092 in log units) for this task (Fig. 4A), while the corresponding threshold for monkey M was 4.18° (0.62 in log units) (Fig. 4B). We attribute this to the fact that the two animals were trained for durations that differed by over one order of magnitude (D was trained for about 2 yr, whereas M was trained for 2 mo). Thus our selection of FOE differences in the stimuli varied slightly between the two animals to have the maximum number of data points near the PSE. Despite this attempt at equalizing the task, animal D performed the task much better than animal M, which is evident when comparing the psychometric thresholds from the two monkeys (Fig. 4C), (t = 7.47, P < 0.01, independent two-sample t-test, two tailed; same in the following).
Fig. 4.

Comparing behavioral and neural performance. A: behavioral performance. The average behavioral performance of two monkeys (D, circles; M, triangles). Each individual circle/triangle in the figures is the average proportion of rightward responses for the corresponding FOE difference (test − reference) in degrees; the error bar for each circle/triangle is the standard error of the mean (SEM) for all trials. The fitted psychometric curve is a cumulative Gaussian distribution fit. B: an example neuron and its corresponding behavioral performance while it was recorded from animal D. The circles are measured behavioral performance: the proportion of rightward responses to the FOE difference between test and reference stimuli. The crosses are the performance based on the neuron's responses. The curves are the fitted lines based on cumulative Gaussian distribution. Psychometric threshold and neurometric threshold are defined as 80% rightward responses predicted by the fitted curves, corrected for bias at point of subjective equality. Psychometric thresholds were found to be much lower than neurometric thresholds. C: the relationship between neurometric and psychometric thresholds. The circles are the neurometric and the corresponding psychometric thresholds from animal D; the triangles are corresponding thresholds from animal M. The dotted-dashed line indicates equal neurometric and psychometric thresholds. All of the observed dots are below this line, suggesting that the animals are much more sensitive than individual MSTd neurons in this task. D: the kernel density distribution of the neurometric threshold (in log units): the two peaks of the density function suggests a binomial distribution (Hartigan's dip test, P = 0.0074). E: distribution of the log ratio of neurometric to psychometric thresholds. The distributions are of similar shape for animal D (light gray) and animal M (dark gray) with a shift in the peaks.
Neural Performance
The performance of each MSTd neuron was estimated by ideal observer analysis using signal detection theory (see materials and methods for details). The neural performance of a sample MSTd neuron and corresponding behavioral responses of the monkey are shown in Fig. 4B. Compared with the psychometric curve, the neurometric curve has a much more shallow slope. Therefore, the psychometric thresholds were found to be much lower than the corresponding neurometric thresholds. The average neurometric threshold (geometric mean in logarithmic scale) was 1.86 for monkey D and 2.05 for monkey M (Fig. 4C). Interestingly, despite the stark differences in psychophysical thresholds, there is no statistical difference in neurometric thresholds between the two animals (t = 1.18, P = 0.24). Therefore, we averaged the neurometric threshold, which resulted in a value of 1.92. The distribution of the psychometric to neurometric thresholds is shown in Fig. 4C. The dashed line corresponds to equal psychometric and neurometric thresholds. As all data points are below the equality line, it is evident that the psychometric thresholds are considerably lower than the neurometric thresholds. These data points seem to form two groups: by fitting the kernel density function of the neurometric threshold (Fig. 4D), we found that the data is most likely bimodal distributed, and the Hartigan's dip test for unimodality (Hartigan and Hartigan 1985) showed a significant results (dip statistics = 0.048, and P = 0.0074).
Ratio of Neural and Behavioral Performance
The average ratio arrived at when comparing the ratio of neurometric and psychometric thresholds is shown in Fig. 4E. The geometric average ratio is 1.89 on a log scale for both animals. Individually, the average ratio is 2.12 for monkey D and 1.48 for monkey M. Both of them are substantially and significantly larger than 0 (P < 0.0001, one-sample t-test). This suggests that the animals are much more sensitive than their individual neurons in MSTd when performing a fine discrimination heading task. It is also important to note that the ratio of monkey D is significantly larger than that of monkey M (P < 0.001), which is likely due to the prolonged training of monkey D that yielded a lower psychometric threshold, as their neural performances are similar and the neurometric threshold differences between the animals are not statistically significant. Another interesting fact of this distribution of ratios is that we also observed two peaks in the distribution for both animals, indicating bimodal distribution (the Hartigan's dip test: dip statistics = 0.052 and P = 0.018 for monkey D; and dip statistics = 0.067, and P = 0.047 for monkey M), similar to the neurometric threshold distribution. However, we could not ascertain the root cause behind this observation: we failed to establish a correlation between receptive field size and ratio. Moreover, there was no clear association between types of flow tuning and ratio.
Trial-to-Trial Covariance Between Neural and Behavioral Performance
The trial-to-trial correlation between neural activity and behavioral performance is estimated by the CP, based on signal detection theory (Green and Swets 1966). The average CP for all MSTd neurons was 0.532 (SD = 0.092), significantly greater than chance (one-sample t-test, t = 4.50, P = 0.00001), similar to those typically reported in area MT for similar coarse and fine discrimination tasks (Britten et al. 1996; Crowell and Banks 1996; Purushothaman and Bradley 2005). This CP is derived from the difference in the FR of the two stimuli (FRtest − FRreference). For individual neurons, a bootstrap test (Britten et al. 1996; Efron and Tibshirani 1993) showed that, among the 163 cells, 73 cells (44.79%) have a significant CP above 0.5 (Fig. 5A), given a 95% confidence interval based on 2,000 permutations. An alternative way to compute CPs is to calculate them based on the response to test stimuli alone. When we performed the analysis in this way, we found that the average CP was lower, 0.524 (SD = 0.119), but still significantly different from chance (t = 2.58, P = 0.01). As the first way to calculate CPs matches our experimental design (we trained the animals to report the relative FOE difference between the test and reference optic flow field, while varying the reference FOE), we perform all further analyses using this version of arriving at the CP in this report. A summary of these results is presented in Fig. 5A. We also compared the results from using the two methods in the following subpopulations, and the results are of similar trend, although the CPs derived using the second method yield greater variability. A closer comparison of CP between the two animals is shown in Fig. 5B. The average CP for animal D is 0.531; the average CP for animal M is 0.535. There is no significant difference between the two animals in CP (t = 0.22, P = 0.82). We take this as evidence that even the animal that was only trained briefly prior to recording was in fact performing the task.
Fig. 5.

Trial-to-trial correlation between neural and behavioral performance: choice probability (CP) analysis. A: the distribution of all MSTd neurons (n = 163). The average CP is 0.532, which is significantly different from chance (t = 4.5, P = 0.00001). The green bars represent the CPs of nonsignificant bootstraps (M = 0.463, n = 90, P < 0.0001), and the red bars the CPs of significant bootstraps (M = 0.609, n = 73, P < 0.0001). There is a relatively large CP (0.893) in the data, and this may indicate an outlier. Without this outlier, the average CP becomes 0.53, still significantly different from chance (t = 4.38, P = 0.00002). B: the average CP for animal D is 0.531, and for animal M it is 0.535. Both of them are significantly different from chance (t = 3.38, P < 0.0001; t = 3.11, P = 0.0031, respectively). C: the average CP for radial, spiral, and rotation cells. The average CP for radial cells is 0.548 (P = 0.0044), spiral cells 0.531 (P = 0.0013), and rotation cells 0.514 (P = 0.33). D: the average CP, number of cells, and its P value from t-test are presented for each subpopulation of MSTd neurons. Note that the vector analysis method classified only a small number (n = 11) of the neurons as Con tuned. CPs of cells in this subpopulation (Con cells) vary substantially, and the large variation and small number of cells causes its statistical test to be not significant from chance (M = 0.561, P = 0.071).
The Role of Rotation and Spiral Cells in Heading Computation
In this analysis, we compare neurons that prefer Vradial to those preferring Vrotation or Vspiral in the stimulus. Because our visual stimuli in the task simulate the forward self-motion, which generates an expansion motion on the retina, we first examine whether expansion-preferred or nonexpansion-preferred neurons differ in their CPs. For the purposes of this analysis, we consider the expansion- and spiral expansion-preferred cells (“spiral” cells, see Fig. 3A for an example of an MSTd neuron that prefers counterclockwise spiral motion) as expansion cells as long as they are tuned for expansion. The expansion cells have an average CP of 0.540 (t = 3.94, P = 0.0002). We treat neurons that prefer rotation and other than the above-mentioned expansion types as nonexpansion cells. The CP of the nonexpansion cells is 0.522 (t = 2.24, P = 0.03). However, there is no significant difference between the CP of expansion and nonexpansion cells (t = 1.24, P = 0.22). Using the neural activities elicited by the test stimuli only, the average CPs for expansion and nonexpansion cells are 0.523 (t = 1.71, P = 0.09) and 0.524 (t = 1.88, P = 0.06), and there is no significant difference between the two (t = 0.0513, P = 0.95).
We then further divided these subpopulations of MSTd cells into three groups: those preferring Vradial (expansion and contraction); rotation (clockwise and counterclockwise motion), or spiral flow (one type of radial and one type of rotation, e.g., counterclockwise expansion as in Fig. 3A). Under this classification scheme, both radial and spiral cells exhibit significant CPs (M = 0.548, P = 0.0044; and M = 0.531, P = 0.0013, respectively), while rotation cells do not exhibit a significant CP (M = 0.514, P = 0.33), but note that the sample size for rotation cells is the smallest among the three (n = 37, n = 101 vs. n = 25 for radial, spiral, and rotation, respectively). The distribution of the three cell categories are shown in Fig. 5C, demonstrating the gradual shift of the distribution center toward chance from radial to rotation cells. Using only the neural activities evoked by the test stimuli, the average CPs for radial, spiral, and rotations cells are 0.537 (P = 0.086), 0.522 (P = 0.075), and 0.506 (P = 0.7), respectively.
We repeated this calculation for all subpopulations of MSTd cells, average CP for expansion M = 0.543, clockwise M = 0.499, counterclockwise M = 0.524, and contraction M = 0.561, plus spiral types, clockwise/expansion M = 0.532, counterclockwise/expansion M = 0.550, clockwise/contraction M = 0.513, and counterclockwise/contraction M = 0.520 (Fig. 5D), together with the P values of the statistical tests. Note that we did not perform statistical analysis for some subpopulations because the number of these subsamples is extremely small (n = 1), and thus it may neither be a representative sample of the entire population, nor provide adequate power for the statistical test. Comparing the CPs of all these subpopulations did not yield a significant difference (ANOVA, F = 0.503, P = 0.899), which may be due to the large variability and unequal sample size of different subpopulations. Using only neural activities from the test stimulus conditions, the average CPs for the subpopulations of cells mentioned above are 0.528, 0.468, 0.532, and 0.556 (expansion, clockwise, counterclockwise, and contraction, respectively), and for spiral cells are 0.514, 0.525, 0.538, and 0.504 (clockwise/expansion, counterclockwise/expansion, clockwise/contraction and counterclockwise/contraction, respectively).
The Correlation Between CP and the Neurometric Threshold for the Subpopulations of MSTd Neurons
To see if the neurometric threshold is correlated with trial-to-trial correlation of the neural activities and the decision the animals made, we analyzed the relation between neural threshold and CP. Note that there are more neurons with their neurometric thresholds computed than those with CPs computed; we had to discard some of the neurons that do not have CPs. We found a significant correlation between the two: r = −0.2451, P = 0.0016 (Fig. 6). It thus suggests that the more sensitive the neurons, the higher its trial-to-trial correlation, the more predictable of the animal's decision based on its neural activities. We also take the neuronal subpopulation into account, using analysis of covariance (ANCOVA) by treating the neurometric threshold as a covariate. Doing so, we found a significant effect of the neural threshold (P = 0.002), but not the subpopulation itself (subpopulation, P = 0.497) on CP. This suggests that the subpopulation itself may not be the key factor for CP, but rather that the more sensitive the individual neuron is, the larger its contribution to the decision.
Fig. 6.
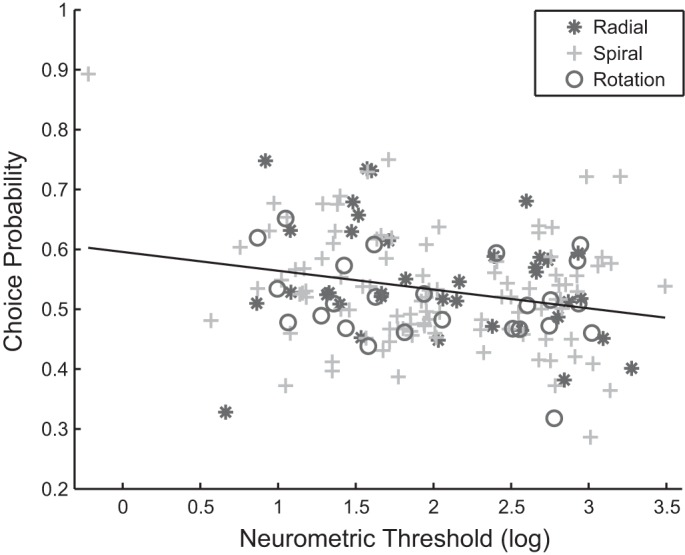
Correlation between CP and neurometric threshold. The correlation between the CP and neurometric threshold is r = −0.2451 (P = 0.0016). The black line is the linear regression fitted line. The three subpopulations are: asterisk, radial motion selective neurons (Exp cells in majority); cross, spiral motion selective neurons; circle, rotation motion selective neurons (CW and CCW). The fitted linear regression line is CP = −0.031 × neurometric threshold + 0.596. Both regression coefficients are significant (P = 0.002 and P < 0.0001, respectively).
Results From the Most Sensitive Neurons
Since we present the same type of stimulus to different neurons, it appears that some of the neurons we recorded may not be as sensitive as the other neurons to the same stimulus (as suggested in Fig. 4, C–E). Therefore, we analyze the two groups separately: 1) for those sensitive neurons (neurometric threshold ≤ 2, we chose 2 because this seems to be where the dip occurs in the density plot), we found a significant CP (M = 0.549, P = 0.0000101); 2) for less sensitive neurons (neurometric threshold > 2), the average CP is not significant (M = 0.514, P = 0.153).
We repeated the same analysis of neural sensitivity and CP as detailed above on the most sensitive neurons. The results of this analysis are shown in Fig. 7. The average ratio of the neurometric and psychometric thresholds for this group of sensitive neurons is 1.523 for both animals. The average ratio is 1.669 for monkey D and 1.189 for monkey M (Fig. 7A). Both of them are significantly greater than 0 (P < 0.0001, one-sample t-tests) and they differ significantly from each other (P < 0.0001, independent t-test).
Fig. 7.

Analysis on the most sensitive neurons. A: the distribution of ratio of neurometric to psychometric thresholds on logarithmic scale. The average log ratio is 1.523 (n = 87), and it is significantly larger (P < 0.0001, independent t-test) for monkey D (1.669) than for monkey M (1.189). B: the average CP for animal D is 0.560 (P < 0.0001, one-sample t-test, same in the following) and for animal M it is 0.526 (P = 0.141). C: the average CP for radial, spiral, and rotation cells. The average CP for radial cells is 0.578 (P = 0.0076), spiral cells 0.529 (P = 0.139), and rotation cells 0.544 (P = 0.0015). D: the average CP, number of cells, and its P value from t-test are presented for each MSTd neuron subpopulation. E: the correlation between the CP and neurometric threshold is r = −0.272 (P = 0.011). The black line is the linear regression fitted line. The three subpopulations are: blue asterisk, radial motion selective neurons (Exp cells in majority); green cross, spiral motion selective neurons; red circle, rotation motion selective neurons (CW and CCW). The fitted linear regression line is CP = −0.067 × neurometric threshold + 0.645. Both regression coefficients are significant (P = 0.011 and P < 0.001, respectively).
The distribution of CPs is shown in Fig. 7B for both animals D and M. The average CP for animal D is 0.560 (n = 59, P < 0.0001) and 0.526 (n = 28, P = 0.141) for animal M. The distribution of CP for the three neural subpopulations is shown in Fig. 7C. The average CP for radial tuned neurons is 0.578 (n = 18, P = 0.0076), 0.529 for rotation cells (n = 13, P = 0.139), and 0.544 for spiral cells (n = 56, P = 0.0015). A detailed description of each neural subgroup is shown in Fig. 7D, with a similar distribution as all the neurons in Fig. 5D. Lastly, the correlation between CP and neural sensitivity is significant (r = −0.272, P = 0.011, Fig. 7E).
Performing the ANCOVA on the most sensitive neurons by treating the neurometric threshold as a covariate, we found a significant effect of the neural threshold (P = 0.044), but not of subpopulation (subpopulation, P = 0.394) on CP. This result is similar to that of the entire MSTd neuron sample as a whole. Taken together, this suggests that being a member of a particular subpopulation may not be the key factor for CP; rather, the more sensitive the individual neuron, the larger its contribution to the decision, regardless of which subpopulation it is a part of.
DISCUSSION
We found a significant trial-to-trial correlation between the behavioral choices of monkeys and the FRs of individual MSTd neurons during a fine-discrimination heading task. This constitutes an independent replication of Gu et al. (2008) using a modified experimental paradigm, an approach that is increasingly recognized as important (Ioannidis 2005; Moonesinghe et al. 2007). Among subsets of MSTd cells, we found that spiral cells, those that exhibit preferences for spiraling optic flow patterns, also exhibit significant CPs in the task, statistically indistinguishable from those we found in expansion cells, whereas rotation cells, those that exhibit preferences for rotating optic flow patterns, showed a somewhat larger than chance, but not significantly different from chance, CP. These findings suggest a gradient of involvement of different types of MSTd neurons in the computation of heading. This constitutes the first direct evidence that different subpopulations of MSTd neurons may construct a gradual internal space for three-dimensional (3D) motion in the physical world (Fig. 1). Furthermore, these results support the notion that spiral cells might also play an important role in the computation of heading. Moreover, we found individual MSTd neurons to be less sensitive than the animals as the neurometric thresholds of individual neurons are much higher than psychometric thresholds of the animals.
CP and Neural Subpopulations
The significant CP found in most subpopulations of MSTd neurons reflects a trial-to-trial correlation between the behavioral choices of monkeys and the FRs of individual MSTd neurons. This suggests that neurons in area MSTd are related to heading direction computations, confirming previous findings (Gu et al. 2008). Our result is consistent with a recent study reporting a similar and significant average CP of 0.52 for heading detection tasks in MSTd (Gu et al. 2008). However, the design of the present study is different from that of Gu et al., such that the present study used a two-interval 2-AFC paradigm with both a reference and a test stimulus, whereas the study by Gu et al. used a one-interval 2-AFC paradigm where the judgment of heading direction was relative to a center reference. In addition, a recent study by Gu et al. (2010) suggested that the behavioral performance depends on the eccentricity of the reference stimulus, such that the further away from the center for the reference stimulus, the worse the performance in heading judgment for macaques (see also Crowell and Banks 1993 for humans), and this dependence could be modeled by the population activity in area MSTd. In our study, we trained the animals to report the relative FOE between the test and reference optic flow field while varying the reference FOE. Therefore, the CPs derived from the difference between the FRs of test and reference stimuli are less variable than those derived from the FRs in response to test stimuli alone (SD 0.092 vs. 0.119). This CP is thus more indicative of the trial-to-trial correlation between the neural response and the animals' decision in the present study design. Therefore, these results suggest that the computation of heading is rapid and likely based on the information available in a given trial: both test and reference stimuli displayed during the task, but not a memory copy of the reference direction in the current study. Previously, no significant CP of neurons in MSTd was reported for a task where the animals judged optic flow patterns embedded in random noise (Heuer and Britten 2004). We attribute this difference in findings to difference in study design. Heuer and Britten (2004) used stimuli that were matched to the preference of the neuron, whereas both our laboratory and Gu et al. (2008) did not. Moreover, in the task used by the Britten group, ambiguous trials for the CP calculation were defined as those without coherently moving dots (Britten et al. 1993; Movshon and Newsome 1992), whereas our task always contained coherently moving dots, and the ambiguous trials were simply those where the reference location matched the test location.
In addition, the above previous studies investigating the role of MSTd neurons in optic flow and heading perception did not distinguish between different subpopulations of MSTd neurons. In contrast, we looked at all functionally different subsets of MSTd neurons, including those that exhibit preferences for spiraling optic flow patterns, and found that they also exhibit significant CPs, similar in magnitude to those of expansion cells. Thus our findings suggest that spiral cells might also play an important role in heading computation. In addition, the significant trial-to-trial correlation in both spiral and expansion cells may be related to the existence of a 3D tuning space in MSTd neurons (Fig. 1), such that the neural correlates of heading perception are related to the tuning properties/preferences of these neurons. It is reasonable to assume a priori that the CP has nothing to do with spiral space tuning, as the computation of CP is solely based on the FOE tuning, which was determined by Vradial flow fields only. However, empirically, the tuning of FOE is not unrelated to spiral space tuning. In particular, when we recorded the responses from spiral motion or Vrotation selective neurons to expanding optic flow motion in the present study, these neurons were responding to nonoptimal stimuli. If these two tuning properties (FOE and spiral space tuning) were purely orthogonal, we would not see any significant CPs in these spiral or rotational selective neurons. Interestingly, our results do show significant CPs for some of these neurons (counterclockwise, expansion/counterclockwise, and contraction neurons in Fig. 7D). This suggests that this spiral space is continuous: different degrees in spiral space connect seemingly orthogonal motion types (e.g., Vradial and Vrotation). In such a space, a given MSTd neuron is tuned for a particular combination of Vradial, Vrotation, and laminar motion and in a continuous way. Changes in the position of the FOE due to eye movements can be interpreted as an addition of laminar motion to Vradial (Britten 2008), and we postulate that some MSTd neurons should be tuned for this, if they do cover the three-dimensional spiral space in the way this model suggests. Therefore, it seems reasonable that spiral cells would be involved to some, but significant, degree in heading computation, and that is indeed what we find. This 3D spiral space model unifies the existing knowledge of MSTd neurons properties, the component cells, and FOE tuning (Duffy and Wurtz 1991a, 1995); the continuous spiral tuning (excluding FOE tuning) (Graziano et al. 1994); and the nonlinear temporal responses to continuously changing optic flow, a temporal domain extension of this model (Paolini et al. 2000).
Neural Sensitivity and Behavioral Performance
We report that, in our fine discrimination task, individual neurons exhibited a much lower neuronal sensitivity than that of the animal. This finding contrasts with previous reports where neural sensitivities close to that of the animal were reported (Heuer and Britten 2004). However, this apparent discrepancy is easily resolved. First, Heuer and Britten used a coarse discrimination task. In other neural areas, these tasks tend to yield neural sensitivities close to that of the animals (Britten et al. 1992), whereas fine discrimination tasks tend to report lower ones in the same areas (Purushothaman and Bradley 2005). Purushothaman and Bradley report that the majority of neurons have a neuronal threshold 26 times higher than that of the monkey. Moreover, in Britten's task, stimulus parameters were matched to the optic flow preferences of the neurons. Therefore, from the perspective of any given neuron, the task was extremely easy. In the present study, we used the same stimulus for all neurons, regardless of preference. Hence, from the perspective of individual neurons, our stimuli could be called “suboptimal” (Tony Movshon, personal communication). We conjecture that individual neurons in our study would also appear more sensitive, if we matched our stimuli to neural preferences and used a coarse discrimination task. However, our design is ecologically valid. At any given time, most neurons will not encounter stimuli that exactly match their preferences. Moreover, both people and animals routinely distinguish minute differences in heading to guide self-motion. Hence, we take our results to conclude that in these situations heading judgments may be dependent on pooled neural activity in MSTd instead of the activity of single MSTd neurons.
Behaviorally, the performance of monkey D is much better than that of monkey M. We attribute this to the substantially longer training of monkey D compared with monkey M. Curiously, this behavioral improvement did not translate to heightened neural sensitivities in individual neurons of area MSTd of monkey D. The neurometric thresholds for neurons in area MSTd between the two animals are neither appreciably nor significantly different. The most parsimonious explanation for this pattern of results is an improvement in behavioral sensitivity related to the duration of training without a corresponding improvement of neuronal sensitivity in area MSTd, but it may be in some other areas, such as lateral intraparietal area (Freedman and Assad 2006) or of other forms. Note that, because of the relative short duration of training in monkey M, her behavioral responses exhibit larger variability than those of monkey D (SD of psychometric threshold: 1.536 vs. 0.355, M and D, respectively), besides the larger psychometric threshold of monkey M than that of monkey D. How does this training affect the population coding and readout of the neural activities itself invites further investigation. A recent study by Gu et al. (2011) suggests that this may be because of reduced interneuronal correlation over the course of training.
CP and Neural Sensitivity
We find a significant correlation between CP and neural sensitivity, suggesting that the more sensitive an individual neuron is, the larger its contribution to the decision of the animal. When we limit our analysis to the most sensitive neurons (neurometric threshold ≤ 2), we find a significant CP (M = 0.549, P = 0.0000101), whereas the CP for the less sensitive neurons (neurometric threshold > 2) is not significant (M = 0.514, P = 0.153). A previous study (Gu et al. 2008) did not find a significant correlation between the two for visually based heading judgments, but they found such correlations for vestibular and combined conditions. We think this may be because of the difference between our designs. Studies in area MT (Britten et al. 1996; Purushothaman and Bradley 2005) did find significant correlation between CP and neural sensitivity, suggesting the animal's decision places more weights to the most sensitive neurons from the neural population.
In conclusion, our results suggest that MSTd neurons are involved in the computations underlying the performance in a heading discrimination task, utilizing the entire visual information present in a given trial. Different subpopulations of MSTd neurons seem to be involved in a way that is suggestive of a 3D spiral space model, implying that MSTd neurons are tuned in a spiral space representing self-motion.
GRANTS
This work was supported by Ministry of Education Academic Research Fund Tier 1 to H. Xu, National Eye Institute (NEI) Grant F32-EY-019833 to P. Wallisch, and NEI Grant EY-13138 to D. C. Bradley.
DISCLOSURES
No conflicts of interest, financial or otherwise, are declared by the author(s).
AUTHOR CONTRIBUTIONS
Author contributions: H.X. and D.C.B. conception and design of research; H.X. and P.W. performed experiments; H.X. analyzed data; H.X. and D.C.B. interpreted results of experiments; H.X. and D.C.B. prepared figures; H.X. drafted manuscript; H.X. and P.W. edited and revised manuscript; H.X., P.W., and D.C.B. approved final version of manuscript.
ACKNOWLEDGMENTS
We thank Gopathy Purushothaman and Andrew Clark for valuable suggestions regarding study design, Paymon Hosseini for help with computer programming, Derek Zaraza for help with animal training, Josh Berg and Sylvie Bradley for clerical support, J. Anthony Movshon for valuable suggestions on the manuscript, and Carmel Heah and Anthony Hayes for proofreading of the manuscript.
Present address of P. Wallisch: Center for Neural Science, New York University, New York, NY.
REFERENCES
- Britten KH. Mechanisms of self-motion perception. Annu Rev Neurosci 31: 389–410, 2008 [DOI] [PubMed] [Google Scholar]
- Britten KH, Newsome WT, Shadlen MN, Celebrini S, Movshon JA. A relationship between behavioral choice and the visual responses of neurons in macaque MT. Vis Neurosci 13: 87–100, 1996 [DOI] [PubMed] [Google Scholar]
- Britten KH, Shadlen MN, Newsome WT, Movshon JA. The analysis of visual motion: a comparison of neuronal and psychophysical performance. J Neurosci 12: 4745–4765, 1992 [DOI] [PMC free article] [PubMed] [Google Scholar]
- Britten KH, Shadlen MN, Newsome WT, Movshon JA. Responses of neurons in macaque MT to stochastic motion signals. Vis Neurosci 10: 1157–1169, 1993 [DOI] [PubMed] [Google Scholar]
- Britten KH, van Wezel RJ. Electrical microstimulation of cortical area MST biases heading perception in monkeys. Nat Neurosci 1: 59–63, 1998 [DOI] [PubMed] [Google Scholar]
- Crowe MJ. A History of Vector Analysis: The Evolution of the Idea of a Vectorial System. New York: Dover, 1967 [Google Scholar]
- Crowell JA, Banks MS. Ideal observer for heading judgments. Vision Res 36: 471–490, 1996 [DOI] [PubMed] [Google Scholar]
- Duffy CJ, Wurtz RH. Medial superior temporal area neurons respond to speed patterns in optic flow. J Neurosci 17: 2839–2851, 1997 [DOI] [PMC free article] [PubMed] [Google Scholar]
- Duffy CJ, Wurtz RH. Response of monkey MST neurons to optic flow stimuli with shifted centers of motion. J Neurosci 15: 5192–5208, 1995 [DOI] [PMC free article] [PubMed] [Google Scholar]
- Duffy CJ, Wurtz RH. Sensitivity of MST neurons to optic flow stimuli. 1. A continuum of response selectivity to large-field stimuli. J Neurophysiol 65: 1329–1345, 1991a [DOI] [PubMed] [Google Scholar]
- Duffy CJ, Wurtz RH. Sensitivity of MST neurons to optic flow stimuli. 2. Mechanisms of response selectivity revealed by small-field stimuli. J Neurophysiol 65: 1346–1359, 1991b [DOI] [PubMed] [Google Scholar]
- Efron B, Tibshirani RJ. An Introduction to the Bootstrap. New York: Chapman and Hall, 1993 [Google Scholar]
- Freedman DJ, Assad JA. Experience-dependent representation of visual categories in parietal cortex. Nature 443: 85–88, 2006 [DOI] [PubMed] [Google Scholar]
- Gibson JJ. Visually controlled locomotion and visual orientation in animals. Br J Psychol 49: 182–194, 1958 [DOI] [PubMed] [Google Scholar]
- Gibson JJ, Olum P, Rosenblatt F. Parallax and perspective during aircraft landings. Am J Psychol 68: 372–385, 1955 [PubMed] [Google Scholar]
- Graziano MSA, Andersen RA, Snowden RJ. Tuning of MST neurons to spiral motions. J Neurosci 14: 54–67, 1994 [DOI] [PMC free article] [PubMed] [Google Scholar]
- Green DM, Swets JA. Signal Detection Theory and Psychophysics. New York: Wiley, 1966, p. xi, 455 [Google Scholar]
- Gu Y, Angelaki DE, DeAngelis GC. Neural correlates of multisensory cue integration in macaque MSTd. Nat Neurosci 11: 1201–1210, 2008 [DOI] [PMC free article] [PubMed] [Google Scholar]
- Gu Y, Deangelis GC, Angelaki DE. Causal links between dorsal medial superior temporal area neurons and multisensory heading perception. J Neurosci 32: 2299–2313, 2012 [DOI] [PMC free article] [PubMed] [Google Scholar]
- Gu Y, Fetsch CR, Adeyemo B, DeAngelis GC, Angelaki DE. Decoding of MSTd population activity accounts for variations in the precision of heading perception. Neuron 66: 596–609, 2010 [DOI] [PMC free article] [PubMed] [Google Scholar]
- Gu Y, Watkins PV, Angelaki DE, DeAngelis GC. Visual and nonvisual contributions to three-dimensional heading selectivity in the medial superior temporal area. J Neurosci 26: 73–85, 2006 [DOI] [PMC free article] [PubMed] [Google Scholar]
- Hartigan JA, Hartigan PM. The dip test of unimodality. Ann Stat 13: 70–84, 1985 [Google Scholar]
- Heuer HW, Britten KH. Optic flow signals in extrastriate area MST: comparison of perceptual and neuronal sensitivity. J Neurophysiol 91: 1314–1326, 2004 [DOI] [PubMed] [Google Scholar]
- Ioannidis J. Why most published research findings are false. PLoS Med 2: e124, 2005 [DOI] [PMC free article] [PubMed] [Google Scholar]
- Judge SJ, Richmond BJ, Chu FC. Implantation of magnetic search coils for measurement of eye position: an improved method. Vision Res 20: 535–538, 1980 [DOI] [PubMed] [Google Scholar]
- Komatsu H, Wurtz RH. Relation of cortical areas Mt and Mst to pursuit eye-movements. 1. Localization and visual properties of neurons. J Neurophysiol 60: 580–603, 1988a [DOI] [PubMed] [Google Scholar]
- Komatsu H, Wurtz RH. Relation of cortical areas Mt and Mst to pursuit eye-movements. 3. Interaction with full-field visual-stimulation. J Neurophysiol 60: 621–644, 1988b [DOI] [PubMed] [Google Scholar]
- Longuet-Higgins HC, Prazdny K. The interpretation of a moving retinal image. Proc R Soc Lond B Biol Sci 208: 385–397, 1980 [DOI] [PubMed] [Google Scholar]
- Moonesinghe R, Khoury MJ, Janssens AC. Most published research findings are false–but a little replication goes a long way. PLoS Med 4: e28, 2007 [DOI] [PMC free article] [PubMed] [Google Scholar]
- Movshon J, Newsome W. Neural foundations of visual motion perception. Curr Dir Psychol Sci 1: 35–39, 1992 [Google Scholar]
- Newsome WT, Wurtz RH, Komatsu H. Relation of cortical areas MT and MST to pursuit eye movements. II. Differentiation of retinal from extraretinal inputs. J Neurophysiol 60: 604–620, 1988 [DOI] [PubMed] [Google Scholar]
- Paolini M, Distler C, Bremmer F, Lappe M, Hoffmann KP. Responses to continuously changing optic flow in area MST. J Neurophysiol 84: 730–743, 2000 [DOI] [PubMed] [Google Scholar]
- Purushothaman G, Bradley DC. Neural population code for fine perceptual decisions in area MT. Nat Neurosci 8: 99–106, 2005 [DOI] [PubMed] [Google Scholar]
- Shenoy KV, Bradley DC, Andersen RA. Influence of gaze rotation on the visual response of primate MSTd neurons. J Neurophysiol 81: 2764–2786, 1999 [DOI] [PubMed] [Google Scholar]
- Shenoy KV, Crowell JA, Andersen RA. Pursuit speed compensation in cortical area MSTd. J Neurophysiol 88: 2630–2647, 2002 [DOI] [PubMed] [Google Scholar]
- Tanaka K, Hikosaka K, Saito H, Yukie M, Fukada Y, Iwai E. Analysis of local and wide-field movements in the superior temporal visual areas of the macaque monkey. J Neurosci 6: 134–144, 1986 [DOI] [PMC free article] [PubMed] [Google Scholar]
- Warren WH, Hannon DJ. Direction of self-motion is perceived from optical-flow. Nature 336: 162–163, 1988 [Google Scholar]
- Warren WH, Jr, Hannon DJ. Eye movements and optical flow. J Opt Soc Am A 7: 160–169, 1990 [DOI] [PubMed] [Google Scholar]
- Xu H, Wallisch P, Bradley D. Neural basis of heading discrimination in macaque MSTd. (Abstract). Program No. 306.7 2006 Neuroscience Meeting Planner Atlanta, GA: Society for Neuroscience, 2006 [Google Scholar]