

Abstract
BACKGROUND AND PURPOSE:
AD has been documented as a kind of disconnection syndrome by functional neuroimaging studies. The primary focus of this study was to examine, with the use of resting-state fMRI, whether AD would impact connectivity among RSNs.
MATERIALS AND METHODS:
Fourteen patients with AD and 16 NC were recruited and scanned by using resting-state fMRI. Group independent-component analysis and the BN learning approach were used, respectively, to separate the RSNs and construct the network-to-network connectivity patterns for each group. The convergence index for the special network DMN was measured.
RESULTS:
Three of the 4 connections were significantly lower in AD compared with NC. Although numerically the AD group had more connections, none was statistically different from that in the NC group except for 1 increased connection from the DMN to the DAN. The convergence index for the DMN node was lower in AD than in NC.
CONCLUSIONS:
Connections among cognitive networks in AD were more vulnerable to impairment than sensory networks. The DMN decreased its integration function for other RSNs but may also play a role in compensating for the disrupted connections in AD.
Neuroimaging studies of AD have found the mechanism of the disease to be associated with neural network disconnection among brain regions or systems that ordinarily connect.1 In line with the disconnection hypothesis, recent neuroimaging studies have been increasingly concerned with network-based spontaneous-activity alterations in patients with AD.2
Spontaneous activity measured by fMRI is organized into multi-RSNs, which are involved in a variety of sensory and cognitive processing. Recent studies demonstrated that these RSNs differed in electrophysiologic signatures3 and were organized in certain patterns.4,5 In AD, spontaneous activity was selectively impaired in particular higher cognitive RSNs such as memory,6 attention,7,8 and the DMN.7 Present RSN studies of AD usually focus on the interregional connectivity alterations within separate networks without considering the more global internetwork interaction changes among different RSNs. Because disrupted large-scale neural integrity was nicely demonstrated by graph theory–based topologic measures,9,10 we hypothesized that the disconnection syndrome of AD would be further presented as a more general characteristic in the brain across different RSN systems. Therefore, we are especially interested in the connectivity among these RSNs whose functionalities have been previously characterized for the effects of AD.
This study used resting-state fMRI data from 14 patients with AD and 16 NC for the network-to-network connectivity analysis. A combined group independent-component analysis and BN learning approach11 was used for analyzing the data. Independent-component analysis was used first for the identification of RSNs, and BN was then used for analyzing the conditional dependence relations between RSNs and for constructing the RSN directional connectivity models. We intended to address 2 main issues: 1) which connections among which RSNs are more vulnerable to impairment by AD and 2) among these RSNs, the DMN distinctly shows more activity during resting-state than during cognitive tasks, and it has been suggested that the DMN plays a role in integrating information from other networks4,12—therefore, we are also interested in examining the influence of AD on the integration function of the DMN among these RSNs.
Materials and Methods
Subjects and Tasks
The NC group had a mean age of 65 ± 9.20 years with 7 men and 9 women, and the AD group had a mean age of 60 ± 7.27 years with 6 men and 8 women. They were recruited and scanned at an urban senior citizens health clinic. The AD group had an average Mini-Mental State Examination score of 14 (range, 4–20), and the NC group had an average Mini-Mental State Examination score of 29 (range, 27–30). Five of the 14 patients had a Clinical Dementia Rating score of 1, and 6 had a Clinical Dementia Rating of 2. The remaining 3 patients had a Clinical Dementia Rating of 3. The 14 patients with AD were free of other diseases, and the 16 NC were free of any known medical, neurologic, and psychiatric disorders. Sedation was not used for any patients. Before scanning, none of the patients had been on any medications for cognitive impairments of AD or for other classes of psychotherapy. Participants were instructed simply to keep their eyes closed and not to think of anything in particular. The purpose of the study was explained to the participants and/or caregivers, and each gave written informed consent approved by the local institutional review board before the experiment.
Data Acquisition
A 3T MR imaging system (Trio; Siemens, Erlangen, Germany) at an urban senior citizens health clinic was used for resting-state fMRI data acquisition. Gradient echo-planar imaging was used to acquire 20 axial sections (6-mm thickness; 0-mm gap; FOV, 256 × 256 mm2; matrix size, 64 × 64; TR, 2000 ms; TE, 30 ms; flip angle, 85°; 250 repetitions per time-series). The functional run for each subject lasted 8 minutes.
Image Processing
The group independent-component analysis and BN approach described previously by Wu et al11 was used for the resting-state fMRI data analysis.
1) Data Preprocessing.
fMRI images were preprocessed by using SPM2 (http://www.fil.ion.ucl.ac.uk/spm) for within-subject spatial realignment, between-subject spatial normalization, and Gaussian filter smoothing. Linear trend removal and temporal filtering were also applied to remove low-frequency drifts and physiologic high-frequency noise.
2) Group Independent-Component Analysis.
Group independent-component analysis was performed by using the fMRI toolbox GIFT (http://icatb.sourceforge.net). Eight RSNs, including the lateral and medial visual, auditory, sensory-motor, self-referential, dorsal and ventral attention networks, and the DMN, which were previously reported in healthy young subjects,4 were used for generating RSN templates. For each set of separated independent components, corresponding to 1 of the 8 RSNs, 1 sample t test was performed over all subjects to determine the corresponding statistical RSN map.
3) BN Modeling on the Network-to-Network Connectivity.
A BN model is a directed acyclic graph represented as nodes with arcs between them. Arcs between nodes signify the directional dependence relations among them, and the absence of arcs refers to conditional independencies. This model has been recently used for the interregional effective connectivity modeling in fMRI studies.11,13,14 Here we extended it to the network-to-network connectivity analysis. Because simulations from Smith et al15 showed that the BN performed well in finding the connectivity relations from temporal data but could not provide very accurate directionality, the connection directionality identified as a result of the BN should be cautiously interpreted here. Each RSN is represented by a node in the BN graph. To extract the time courses of each RSN, the region-of-interest masks for these RSNs were first defined by taking the intersection of each 1 sample t test RSN map (at P = .05 false discovery rate) with a gray matter mask defined by the WFU_PickAtlas (http://www.nitrc.org/projects/wfu_pickatlas) in SPM2. For each subject, the time-series of all voxels in each RSN mask was extracted, averaged, and entered in the within-group BN analysis. The collection of Matlab functions called the Bayesian Net Toolbox (http://code.google.com/p/bnt) were used for learning the structure and parameters of the BN model. A stepwise regression procedure11 was performed to refine the BN configuration via testing the significance of connections. To examine the BN-based connectivity differences between the AD and NC groups, a random permutation test was adopted to find the between-group differences in connection weights.11 Type I errors of having between-group differences for each connection were reported.
4) Analyzing the Convergence Index for the DMN.
Previous effective connectivity modeling, including BN4 and Granger causality analysis,12 consistently demonstrated that the DMN was inclined to accept incoming connections from other RSN nodes rather than generating outgoing connections. We, therefore, took the proportion of incoming connections to the DMN node over all links, with the DMN as the index, to measure the integration degree of the DMN. We constructed the BN connectivity pattern for each subject and calculated the DMN index for the individual subject in each group. Specifically, a higher index of integration with the DMN is regarded as indicating a stronger function in uniting other RSNs. Similarly, the nonparametric permutation test was finally performed on this DMN index to test whether the DMN in AD had a reduced integration function.
Results
RSN Maps in NC and AD
Figure 1 shows 8 RSNs in NC and AD. The LVN (Fig 1A) and MVN (Fig 1B) are 2 networks for visual processing and are respectively located in the lateral and medial parts of the visual cortex. The AN (Fig 1C) is responsible for auditory processing and is located in the bilateral superior temporal gyrus and in the primary and secondary auditory cortices. The SMN (Fig 1D) is the network covering the somatosensory, premotor, and supplementary motor cortices. The SRN (Fig 1E) includes regions from the medial-ventral prefrontal cortex, the anterior cingulate, and the posterior cingulate. It is involved in self-referential activity.16 The DAN (Fig 1F) and VAN (Fig 1G) are 2 networks responsible for attentional processing.17 The DAN is bilaterally centered in the intraparietal sulcus and the frontal eye field. The VAN is largely right lateralized in the temporal-parietal junction and the ventral frontal cortex. The DMN (Fig 1H) includes the posterior cingulate, medial prefrontal and bilateral inferior parietal cortices, and the medial temporal lobe structures.
Fig 1.

Spatial maps of 8 RSNs in NC (upper panel) and AD (lower panel). A–H, Respectively, the networks for LVN, MVN, AN, SMN, SRN, DAN, VAN, and DMN. Each map was the result of a 1-sample t test on the individual independent component patterns (P < .05, corrected by false discovery rate).
In summary, the LVN, MVN, AN, and SMN are 4 networks related to sensory processing, and the remaining DMN, SRN, DAN, and VAN are associated with higher cognitive function.
BN-Based RSN Connectivity Patterns
Figure 2 shows the BN connectivity patterns among RSNs for NC (Fig 2A) and AD (Fig 2B). Connection directions and the weight coefficients and their statistical significance are given in Table 1. Directional connections observed in both groups include LVN→MVN, AN→SMN, AN→VAN, SMN→LVN, and VAN→DMN. Connections MVN→DMN, SMN→SRN, SRN→VAN, and VAN→DAN are present only in NC, while connections SMN→VAN, SRN→DMN, DMN→LVN, DMN→DAN, VAN→SRN, and VAN→LVN are found only in AD. In terms of the number of total connections, there are 2 more in AD.
Fig 2.

BN-based connectivity between RSNs in NC (A), and AD (B). The RSNs are graphically represented with connections depicting conditional dependencies. All the connections in the maps survived significance testing (P < .05). Solid and dashed arcs are, respectively, for positive and negative connections. Line width is proportional to the connection weights. The asterisks on connections indicate that the connections in NC are significantly stronger than those in AD, while the pound sign points out the opposite case (permutation test, P < .05).
Table 1:
List of direct connections in the BN models of NC and ADa
| Connections | NC |
AD |
||
|---|---|---|---|---|
| Weights | (T, P) Values | Weights | (T, P) Values | |
| I | ||||
| LVN→MVN | 1.09 | (11.7, <.0001) | 1.16 | (11.9, <.0001) |
| AN→SMN | 0.84 | (12.6, <.0001) | 0.84 | (10.9, <.0001) |
| AN→VAN | −0.34 | (−4.6, <.0001) | 0.69 | (6.9, <.0001) |
| SMN→LVN | 0.15 | (7.1, <.0001) | 0.52 | (5.8, <.0001) |
| VAN→DMN | 0.47 | (3.1, .0022) | 0.40 | (4.6, <.0001) |
| II | ||||
| MVN→DMN | 0.31 | (2.1, .0370) | ||
| SMN→SRNb | 0.78 | (5.4, <.0001) | ||
| SRN→VANb | 1.25 | (13.8, <.0001) | ||
| VAN→DANb | 1.08 | (11.4, <.0001) | ||
| III | ||||
| SMN→VAN | 0.28 | (3.1, .0022) | ||
| SRN→DMN | 0.46 | (7.2, <.0001) | ||
| DMN→LVN | 0.98 | (7.2, <.0001) | ||
| DMN→DANc | 0.81 | (9.2, <.0001) | ||
| VAN→SRN | 0.63 | (6.6, <.0001) | ||
| VAN→LVN | −1.03 | (−9.2, <.0001) | ||
Row I shows that connections coexisted in both groups. Rows II and III show, respectively, the connections in NC and AD. All the connections listed in the Table survived the statistical testing (P < .05).
The connection in NC is significantly stronger than that in AD.
The connection in AD is significantly stronger than that in NC.
In NC (Fig 2A), the sensory RSNs, LVN, MVN, AN, and SMN, have only incoming connections from each other (ie, no connection from any cognitive RSN). The cognitive RSNs, SRN, DAN, and VAN, generate connections directed only to cognitive networks but receive connections from both the sensory and the cognitive networks. The DMN has only incoming connections, which include either direct or indirect connections to all the other cognitive networks except the DAN and which also include all sensory networks.
In AD (Fig 2B), altered connections are found. In AD, the sensory network LVN also receives connections from the cognitive networks DMN and VAN. The DMN also generates direct connections to other networks, and 3 networks, LVN, MVN, and DAN, have no direct or indirect connections to the DMN.
Between-Group RSN Connectivity Difference
Table 2 shows the probabilities of between-group connection differences determined by a random permutation test (P < .05). The connections that coexisted in both groups did not show significant between-group differences. Three of the 4 connections only present in NC, SMN→SRN, SRN→VAN, and VAN→DAN, have greater weight than in AD. The remaining connection, MVN→DMN, does not. Although 6 more connections are observed in AD at the group level, only 1 connection, DMN→DAN, has a greater connection weight than in NC.
Table 2:
Results of between-group comparison of RSN interconnectivity determined by the permutation testa
| NC > AD |
AD > NC |
||
|---|---|---|---|
| Connections in NC | Type I Error | Connections in AD | Type I Error |
| LVN→MVN | 0.575 | LVN→MVN | 0.425 |
| AN→SMN | 0.512 | AN→SMN | 0.488 |
| AN→VAN | 0.868 | AN→VAN | 0.132 |
| SMN→LVN | 0.188 | SMN→LVN | 0.812 |
| VAN→DMN | 0.089 | VAN→DMN | 0.911 |
| MVN→DMN | 0.061 | SMN→VAN | 0.104 |
| SMN→SRN | 0.043 | SRN→DMN | 0.502 |
| SRN→VAN | 0.022 | DMN→LVN | 0.056 |
| VAN→DAN | 0.029 | DMN→DAN | 0.021 |
| VAN→SRN | 0.842 | ||
| VAN→LVN | 0.882 | ||
The column “NC > AD” shows the type I error probabilities of the connections in NC group that are stronger than the ones in AD group. The column “AD > NC” shows the contrary case.
DMN Integrating Degree: Convergence Index
Figure 3 displays the scattergraph of the DMN index for the subjects in NC and AD groups. The mean DMN index in NC and AD is, respectively, 0.81 ± 0.18 and 0.51 ± 0.23. The nonparametric permutation test shows that this index is higher in NC than in AD (P = .0003).
Fig 3.
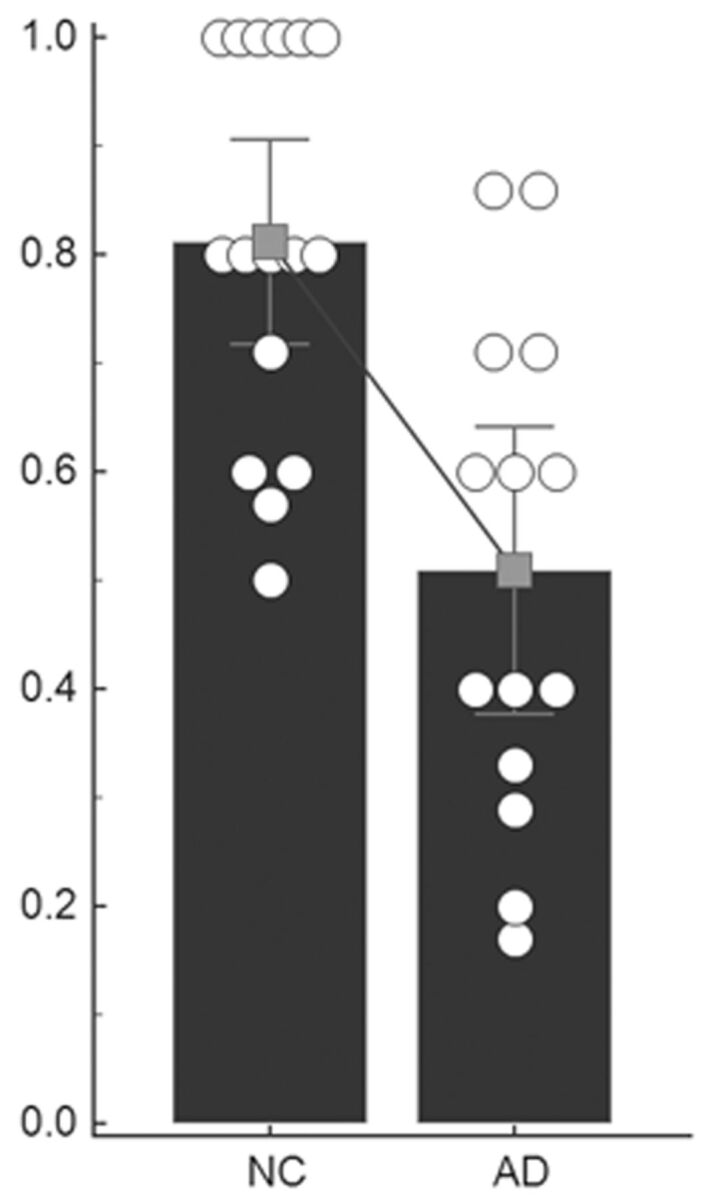
Scatterplots of the DMN index. The circles show the DMN index of individual subjects. The histogram and the error bar show the within-group mean value and SD. A declining line between the 2 histograms indicates a significantly decreased degree of integration with the DMN in AD.
Discussion
Consistent with our hypothesis, altered RSN interactions were detected in AD. Three of the 4 connections in NC showed a statistically significant decrease in connective weights in AD. Although there were numerically more connections in the AD group, none was statistically different from that in NC except 1 increased connection from the DMN to the DAN. The DMN also had a significantly decreased degree of information integration in AD.
Alterations in Directional Connectivity among RSNs in AD
A between-group comparison of the RSN connectivity found that 5 connections were not affected by the group membership. Three, LVN→MVN, AN→SMN, SMN→LVN, were connections between sensory RSNs. In contrast to these uninterrupted connections, 3 connections, SMN→SRN, SRN→VAN, VAN→DAN, which were all connected with cognitive networks, decreased their weights in AD. This suggested that AD was more likely to target the connectivity related to higher cognitive networks. This was consistent with previous region-level–based global graphic mapping, which demonstrated preferentially disrupted neural integrity in systems underlying the higher functions in AD.18
Impaired direct connections with the SRN (SMN→SRN and SRN→VAN) in AD may be related to decreased self-referential ability.19 Because the SRN has been suggested as an important intermediary for the reciprocal modulation between sensory and cognitive processing,20 our finding might indicate that the disrupted SMN→SRN→VAN connectivity in AD would result in a communication decline between sensory and cognitive networks.
VAN and DAN are 2 networks responsible respectively for the endogenous attention orienting and the exogenous attention re-orienting processes.21 As validated by both behavioral measurements and neuroimaging studies,22–25 attention impairment is a very common manifestation of AD. The disrupted VAN→DAN connection implies decreased direct dependence or influence relations among the 2 networks in AD. Recent resting fMRI studies also documented the decreased functional connectivity of DAN in AD.7,8 We presume that the deteriorative intrinsic activity in DAN would bring on the inhibitory dependence of the DAN on the VAN. Both the decreased DAN functional connectivity and the loss of direct connection between them would lead to attention deficits in AD.
Although no direct connection with the DMN had significantly decreased weight in AD, we found that the connection from the DMN to the DAN in AD was significantly stronger than in NC. The increased connectivity may represent the connectivity compensation characteristic in AD. It is hypothesized that patients with AD may recruit additional healthy neurons or alternative brain systems to optimize or maximize cognitive performance.26 The results suggested that patients with AD seemed to rely on the increased DMN→DAN connectivity to maintain the lost direct connections between networks. The disrupted direct-connection VAN→DAN may be alternatively compensated by the indirect pathway between them, VAN→DMN→DAN. The DMN, therefore, probably serves as an additional mediation network for cognitive processing between the 2 attention systems. Most interesting, impaired and compensated functional connectivity within the DMN has been simultaneously demonstrated as well by other studies of this network.27 We also noticed that the VAN→DMN connection was the only one between cognitive networks that coexisted in both groups and was weighted equivalently. In addition, the results also demonstrated that the lost connection from the SRN to the VAN was switched to a VAN-to-SRN connection and that the disrupted connection from the SMN to the SRN might be compensated for by the indirect connection through VAN (SMN→VAN→SRN). Although the 2 direct connections, SMN→VAN and VAN→SRN, are only present in AD, their weights are not statistically stronger than those in the NC group, possibly owing to the network-connectivity randomization induced by the progress of the disease as discussed below.
Alterations in RSN Cooperation in AD
Another concern is the change of cooperation among RSNs in AD. In NC, sensory networks all receive incoming connections only from the sensory networks themselves, and cognitive networks all initiate outgoing connections only to the cognitive networks. Although there are direct connections from sensory networks to cognitive networks, there are no significant connections from cognitive networks to sensory networks. These connectivity relationships within and between sensory/cognitive networks are in general accord with those previously reported in healthy young subjects.4 This pattern of connection was altered, however, in AD, with 2 connections from cognitive networks to sensory networks: DMN→LVN and VAN→LVN. The regular intradependence of sensory networks and the intrainfluence of cognitive networks can represent the close interconnectivity among networks at similar function levels, and the changed sensory and cognitive network connectivity relations in AD may suggest that the disease has affected the between-network directional connectivity and has influenced the RSN functional cooperation.
Nevertheless, the opposite connections from cognitive network to sensory network presented in AD do not show greater weights. Six connections between RSNs absent in NC were found in the AD group, and the AD group also had a total number of connections that was 2 greater than that of the NC group. However, these quantitatively greater connections in AD were not statistically stronger than those in NC, with the exception of the connection from the DMN to the DAN. In contrast, the BN model for the NC group demonstrated 4 more connections, and 3 had stronger weights than those in AD. The increased number of connections but lack of increased connective weights in AD may imply a randomization of network connectivity influenced by the process of the disease. Disease-specific randomization in functional network connectivity on one hand may represent a loss of global information integration or cooperation in AD,11 and on the other, these extra abnormal connections may provide patients with AD with more compensatory pathways for network communication that ordinarily proceeds via other paths in the absence of the disease.
Decreased Information Integration of the DMN in AD
In the BN connectivity pattern of the NC group, the DMN acts as a confluent node. It only receives incoming connections without initiating outgoing ones. Connections starting from sensory networks all converge on the DMN node directly or indirectly. In AD, however, 3 networks, LVN, MVN, and DAN, have no direct or indirect connections pointing toward the DMN, and the convergence index of the DMN was also lower in AD than in NC. Both the group results and the individual analysis indicate that the integration function of the DMN declines in AD. This is in line with studies from graph-theory–based analysis of overall cortical connectivity, which have shown that regions with a high degree of both local and distant connectivity converge on regions within the DMN and that regions from this network constitute the hubs of the cortex that are vulnerable to AD.9 The mean convergence index of 0.51 implied that the proportion of incoming and outgoing connections with DMN was equivalent or balanced in AD. In addition to integrating resting information from other networks, the DMN in AD may generate more outgoing connections to compensate for the reduced between-network cooperation or for the connections disrupted by the influence of the disease as discussed above.
Limitations
First, additional studies are needed to extend our evaluation beyond the 8 RSNs in this study to validate the present findings. Second, the BN learning approach cannot model reciprocal connections and temporal causal relations between nodes. Although the BN has been demonstrated as one of the most promising methods in detecting network connections for resting fMRI data, the connection directionality should be cautiously interpreted.15 Therefore, we have limited our focus on the examination and discussion of AD-induced connectivity alterations. In addition, the group-level–based statistical analysis of the BN limited our ability to evaluate the associations of fMRI connectivity with clinical measures, which made it difficult to provide the clinical relevance of these findings. Third, the present findings are based on a small sample size, and need to be validated in an independent large dataset sample to see how the network-to-network connectivity changes correlate with disease severity. Our application of the internetwork connectivity is among the first in the study of AD, to our knowledge. After demonstrating the dramatic difference between NC and patients with late-stage AD, the feasibility of such an approach for distinguishing patients at the early stage from NC or among those before the onset of the disease but with different risks of AD (eg, due to the possession of the APOE4 allele) will be investigated in future studies. Finally, future works are expected to explore other indices, in addition to the DMN index, arising from the complicated connectivity relations among RSNs to reveal more about the influence of AD on internetwork relations.
Conclusions
BN modeling documented altered interconnectivity and cooperation among RSNs in patients with AD. Connections related to higher cognitive networks were more vulnerable to impairment by the disease. The important DMN decreased its information integration functionality among these networks but may also play a role in compensating for the disrupted connections in AD.
ABBREVIATIONS:
- AD
Alzheimer disease
- AN
auditory network
- BN
Bayesian network
- DAN
dorsal attention network
- DMN
default-mode network
- LVN
lateral visual network
- MVN
medial visual network
- NC
healthy controls
- RSN
resting-state network
- SMN
sensory-motor network
- SRN
self-referential network
- VAN
ventral attention network
Footnotes
Disclosures: Eric Reiman—RELATED: Grant: Banner Alzheimer's Institute,* Comments: National Institute on Aging grants. *Money paid to the institution.
This work was supported by the Key Program of National Natural Science Foundation of China (grant 60931003), General Program of National Natural Science Foundation of China (grant 60905063), and Scientific Foundation of Institute of Psychology, Chinese Academy of Sciences (grant Y1CX251005). It was also supported by the National Institute of Mental Health (RO1 MH57899), the National Institute on Aging (R01 AG031581-10 and P30 AG19610, k23 AG24062), and the state of Arizona.
References
- 1. Delbeuck X, Van der Linden M, Collette F. Alzheimer's disease as a disconnection syndrome? Neuropsychol Rev 2003;13:79–92 [DOI] [PubMed] [Google Scholar]
- 2. Sorg C, Riedl V, Perneczky R, et al. Impact of Alzheimer's disease on the functional connectivity of spontaneous brain activity. Curr Alzheimer Res 2009;6:541–53 [DOI] [PubMed] [Google Scholar]
- 3. Jann K, Kottlow M, Dierks T, et al. Topographic electrophysiological signatures of fMRI resting state networks. PLoS One 2010;5:e12945. [DOI] [PMC free article] [PubMed] [Google Scholar]
- 4. Li R, Chen K, Fleisher AS, et al. Large-scale directional connections among multi resting-state neural networks in human brain: a functional MRI and Bayesian network modeling study. Neuroimage 2011;56:1035–42 [DOI] [PMC free article] [PubMed] [Google Scholar]
- 5. Zhang Z, Liao W, Zuo XN, et al. Resting-state brain organization revealed by functional covariance networks. PLoS One 2011;6:e28817. [DOI] [PMC free article] [PubMed] [Google Scholar]
- 6. Sperling RA, Dickerson BC, Pihlajamaki M, et al. Functional alterations in memory networks in early Alzheimer's disease. Neuromolecular Med 2010;12:27–43 [DOI] [PMC free article] [PubMed] [Google Scholar]
- 7. Sorg C, Riedl V, Mühlau M, et al. Selective changes of resting-state networks in individuals at risk for Alzheimer's disease. Proc Natl Acad Sci U S A 2007;104:18760–65 [DOI] [PMC free article] [PubMed] [Google Scholar]
- 8. Li R, Wu X, Fleisher AS, et al. Attention-related networks in Alzheimer's disease: a resting functional MRI study. Hum Brain Mapp 2011;33:1076–88 [DOI] [PMC free article] [PubMed] [Google Scholar]
- 9. Buckner RL, Sepulcre J, Talukdar T, et al. Cortical hubs revealed by intrinsic functional connectivity: mapping, assessment of stability, and relation to Alzheimer's disease. J Neurosci 2009;29:1860–73 [DOI] [PMC free article] [PubMed] [Google Scholar]
- 10. Sanz-Arigita EJ, Schoonheim MM, Damoiseaux JS, et al. Loss of ‘small-world’ networks in Alzheimer's disease: graph analysis of FMRI resting-state functional connectivity. PLoS One 2010;5:e13788. [DOI] [PMC free article] [PubMed] [Google Scholar]
- 11. Wu X, Li R, Fleisher AS, et al. Altered default mode network connectivity in Alzheimer's disease a resting functional MRI and Bayesian network study. Hum Brain Mapp 2011;32:1868–81 [DOI] [PMC free article] [PubMed] [Google Scholar]
- 12. Liao W, Mantini D, Zhang ZQ, et al. Evaluating the effective connectivity of resting state networks using conditional Granger causality. Biol Cybern 2010;102:57–69 [DOI] [PubMed] [Google Scholar]
- 13. Rajapakse JC, Zhou J. Learning effective brain connectivity with dynamic Bayesian networks. Neuroimage 2007;37:749–60 [DOI] [PubMed] [Google Scholar]
- 14. Zheng XB, Rajapakse JC. Learning functional structure from fMR images. Neuroimage 2006;31:1601–13 [DOI] [PubMed] [Google Scholar]
- 15. Smith SM, Miller KL, Salimi-Khorshidi G, et al. Network modelling methods for fMRI. Neuroimage 2011;54:875–91 [DOI] [PubMed] [Google Scholar]
- 16. Mantini D, Perrucci MG, Del Gratta C, et al. Electrophysiological signatures of resting state networks in the human brain. Proc Natl Acad Sci U S A 2007;104:13170–75 [DOI] [PMC free article] [PubMed] [Google Scholar]
- 17. Fox MD, Corbetta M, Snyde AZ, et al. Spontaneous neuronal activity distinguishes human dorsal and ventral attention systems. Proc Natl Acad Sci U S A 2006;103:10046–51 [DOI] [PMC free article] [PubMed] [Google Scholar]
- 18. He Y, Chen Z, Gong GL, et al. Neuronal networks in Alzheimer's disease. Neuroscientist 2009;15:333–50 [DOI] [PubMed] [Google Scholar]
- 19. Irish M, Lawlor BA, O'Mara SM, et al. Impaired capacity for autonoetic reliving during autobiographical event recall in mild Alzheimer's disease. Cortex 2011;47:236–49 [DOI] [PubMed] [Google Scholar]
- 20. Northoff G, Heinzel A, Greck M, et al. Self-referential processing in our brain: a meta-analysis of imaging studies on the self. Neuroimage 2006;31:440–57 [DOI] [PubMed] [Google Scholar]
- 21. Corbetta M, Shulman GL. Control of goal-directed and stimulus-driven attention in the brain. Nat Rev Neurosci 2002;3:201–15 [DOI] [PubMed] [Google Scholar]
- 22. Amieva H, Phillips LH, Della Sala S, et al. Inhibitory functioning in Alzheimer's disease. Brain 2004;127:949–64 [DOI] [PubMed] [Google Scholar]
- 23. Grearing M, Graves RE, Mohr E. Breakdown of selective attentional mechanisms in Alzheimer's disease. J Clin Exp Neuropsychol 1991;13:69 [Google Scholar]
- 24. Hao J, Li KC, Li K, et al. Visual attention deficits in Alzheimer's disease: an fMRI study. Neurosci Lett 2005;385:18–23 [DOI] [PubMed] [Google Scholar]
- 25. Perry RJ, Hodges JR. Attention and executive deficits in Alzheimer's disease: a critical review. Brain 1999;122:383–404 [DOI] [PubMed] [Google Scholar]
- 26. Stern Y. What is cognitive reserve? Theory and research application of the reserve concept. J Int Neuropsychol Soc 2002;8:448–60 [PubMed] [Google Scholar]
- 27. Qi ZG, Wu X, Wang ZQ, et al. Impairment and compensation coexist in amnestic MCI default mode network. Neuroimage 2010;50:48–55 [DOI] [PubMed] [Google Scholar]