Abstract
The microarchitecture and alignment of trabecular bone adapts to the particular mechanical milieu applied to it. Due to this anisotropic mechanical property, measurement orientation has to be taken into consideration when assessing trabecular bone quality and fracture risk prediction. Quantitative ultrasound (QUS) has demonstrated the ability in predicting the principal structural orientation (PSO) of trabecular bone. Although the QUS prediction for PSO is very close to that of μCT, certain angle differences still exist. It remains unknown whether this angle difference can induce significant differences in mechanical properties or not. The objective of this study is to evaluate the mechanical properties in different PSOs predicted using different methods, QUS and μCT, thus to investigate the ability of QUS as a means to predict the PSO of trabecular bone noninvasively. By validating the ability of QUS to predict the PSO of trabecular bone, it is beneficial for future QUS applications because QUS measurements in the PSO can provide information more correlated with the mechanical properties than with other orientations. In this study, seven trabecular bone balls from distal bovine femurs were used to generate finite element models based on the 3-dimensional μCT images. Uniaxial compressive loading was performed on the bone ball models in the finite element analysis (FEA) in 6 different orientations (three anatomical orientations, two PSOs predicted by QUS and the longest vector of mean intercept length (MIL) tensor calculated by μCT). The stiffness was calculated based on the reaction force of the bone balls under loading and the von Mises stress results showed that both the mechanical properties in the PSOs predicted by QUS is significantly higher than the anatomical orientations and comparatively close to the longest vector of MIL tensor. The stiffness in the PSOs predicted by QUS is also highly correlated with the stiffness in the MIL tensor orientation (ATTmax vs. MIL, R2=0.98, p<001; UVmax vs. MIL, R2=0.92, p<001). These results were validated by in vitro mechanical testing on the bone ball samples. This study demonstrates that the PSO of trabecular bone predicted by QUS has an equally strong apparent stiffness with the orientation predicted by μCT.
Keywords: quantitative ultrasound, non-invasive measurement, bone remodeling, anisotropic structure, trabecular principal orientation, finite element analysis
Introduction
One important observation about trabecular bone is its ability to adapt its structure according to the specific mechanical environment, as commonly defined as “Wolff's law” (Martin et al., 1998; Wolff, 1896). This anisotropic nature of trabecular bone indicates that the “quality” of bone cannot be simply characterized by using dual-energy x-ray absorptiometry (DXA) to quantify some global parameters of bone, such as bone mineral density (BMD). As the National Institutes of Health specifies, “Bone quality refers to architecture, turnover, damage accumulation (e.g., microfractures) and mineralization” (2000). To overcome the limitation of the current bone imaging techniques, researchers have developed alternative modalities to assess bone quality and predict fracture risk (Burghardt et al., 2011; Cody et al., 1999; Krug et al., 2010; Link, 2012; Tommasini et al., 2012). Quantitative ultrasound (QUS), a safe, low cost, portable, radiation-free and noninvasive imaging tool, has been widely used for bone quality assessment since it was introduced (Ashman et al., 1987; Cardoso et al., 2003; Gluer, 1997; Haiat et al., 2008; Langton et al., 1984; Lin et al., 2006; Njeh et al., 1997; Qin et al., 2007).
The propagation of ultrasound waves through trabecular bone is heavily influenced by the macroarchitecture and alignment of trabeculae (Mizuno et al., 2010). Recently, many researchers have been investigating the interaction between the anisotropic trabecular macroarchitecture and the quantitative ultrasound propagation (Cardoso and Cowin, 2011, 2012; Cowin and Cardoso, 2011; Han and Rho, 1998; Hosokawa, 2009, 2010, 2011a, b; Hosokawa and Otani, 1998; Lee et al., 2007; Mizuno et al., 2009; Mizuno et al., 2008; Mizuno et al., 2010). In a 3-dimensional volumetric trabecular structure, not only the alignment of the trabeculae but also the “solid/liquid” or “bone/marrow” interfaces play a very important role in scattering, refracting and attenuating the ultrasound wave. It has been recognized by researchers that the microstructure of trabecular bone has a substantial effect on the measurement of QUS that generalizing the bone quality by using any global measurement value may lose information about anisotropic material properties of trabecular bone. Our previous work successfully demonstrated a noninvasive quantitative ultrasonic method to predict the principal structural orientation (PSO) of trabecular bone (Lin et al., 2012). Such prediction using both ultrasound attenuation and velocity showed highly correlated results compared to the current gold standard—the longest vector of mean intercept length (MIL) tensor measured using micro computed tomography (μCT). Finite element analysis (FEA) based on μCT has been used as a noninvasive tool to evaluate the mechanical properties of bone (Bevill et al., 2006; Eswaran et al., 2009; Keaveny, 2010; Kim et al., 2007; Liu et al., 2009; Wald et al., 2011; Yeni et al., 2008).
Although it is commonly accepted that trabecular architecture is aligned against loading through remodeling, and it has been shown that such principal direction in trabecular bone can be predicted by the QUS, certain angle differences still exist between QUS prediction and μCT measurement. It remains unknown whether this angle difference can induce significant differences in mechanical properties or not. It is hypothesized that the principal trabecular structural orientation predicted by QUS is strongly correlated with μCT-based μFEA determined anisotropic mechanical strength. The objective of this study is then to evaluate the mechanical properties in different principal structural orientations predicted using different methods, i.e., QUS and μCT validated by mechanical testing, thus to investigate the ability of QUS as a means to predict the principal structural orientation and principal strength of trabecular bone noninvasively. By validating the ability of QUS in predicting the PSO with the highest mechanical properties of trabecular bone, it is beneficial for future QUS applications in a way that QUS measurement in the PSO can provide information more correlated with the mechanical properties than in other orientations.
Materials and methods
3-D volumetric trabecular sample preparation and μCT imaging
Seven spherical trabecular bone samples (Ø 25.4 mm) were machined from seven distal bovine femurs using a lathe machine. Three principal anatomical orientations were marked on the surfaces of the bone samples as anterior-posterior (AP), medial-lateral (ML) and proximal-distal (PD). The bone marrow inside the trabeculae was flushed out using a dental water-pick.
μCT imaging with resolution of 18 μm was performed on each trabecular bone ball by using a μCT 40 system (SCANCO Medical AG, Brüttisellen, Switzerland) to obtain the 3-dimensional geometry of the bone ball samples. The longest vector of the mean intercept length (MIL) tensor—the current gold standard of quantifying the structural anisotropy—was calculated using the μCT system (Whitehouse, 1974). The calculation function for MIL tensor is provided by the software of the μCT system. Then the 3-dimensional images of bone ball samples were converted into digital imaging and communications in medicine (DICOM) format images for later analysis using information processing language (IPL) in the μCT system.
Quantitative ultrasound measurement and prediction the principal structural orientation
A scanning confocal acoustic navigation (SCAN) system (Xia et al., 2007) was used for the quantitative ultrasound measurement. The center frequency of the two focused transducers (V302-SU-F2.00IN, Olympus NDT Inc., Waltham, MA) is 1 MHz; the diameter of the transducers is 25.4 mm; and the confocal length of the transducers is 50.8 mm. The transducers were coaxially installed 101.6 mm away from each other, aligning with the center of the bone ball which is placed in a rotation stage at the midpoint of the two transducers. For ultrasound measurement, the spherical bone sample is placed on a rotational stage and rotational QUS measurement was performed on three orthogonal planes perpendicular to the three anatomical axes of the bone specimen. During each scan, broadband ultrasound pulses with center frequency of 1 MHz were repeatedly transmitted through the center of the bone ball, and the average product of these 400 pulses was used for analysis. For the measurement on each orthogonal plane, the increment between every two QUS scan was 10 degrees, generating a total of 36 scans on each plane and 108 scans for every bone sample. This rotational QUS measurement method is based on the assumption that QUS measurement in the PSO has the highest result, and the peak measurement on each orthogonal plane is the projection of the measurement in PSO on that plane, and therefore can be used to back-calculate the 3-dimensional vector of PSO. Two QUS parameters, Ultrasound attenuation (ATT) and ultrasound velocity (UV) were calculated using the classic substitution method (Langton et al., 1984). ATT is calculated using the following equation:
| (1) |
Where I1 and I2 are the intensity of reference and sample wave, calculated by integrating the amplitude of the received pulse over time. UV is calculated using the following equation:
| (2) |
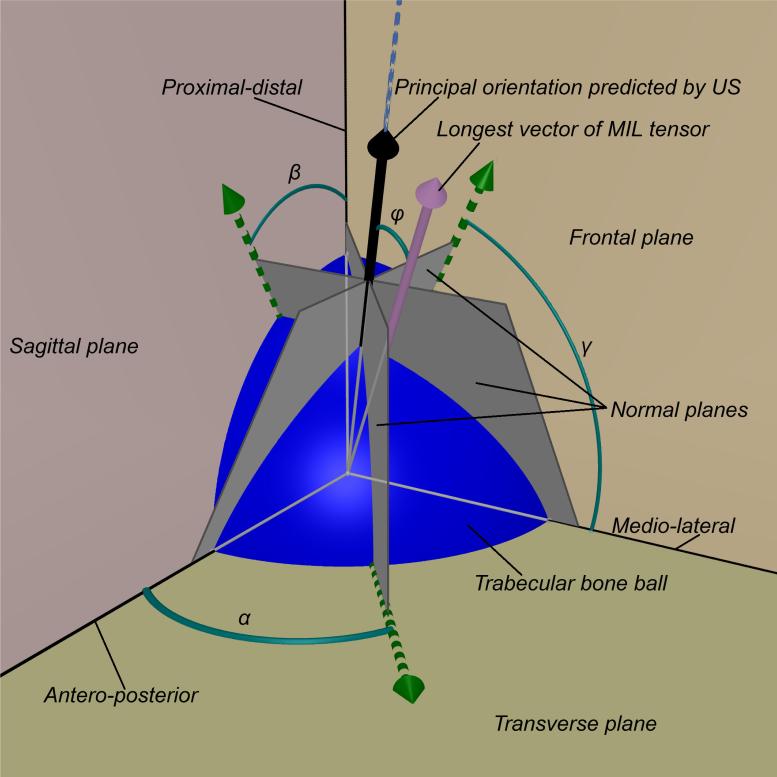
Where Cr is the velocity of ultrasound in water, t is the arrival time difference between reference and sample wave and d is the diameter of the bone sample. In this study, the first high peak of the fast wave is used as the landmark to calculate the time difference Δt. As shown in Figure 1, a Cartesian coordinate system (x-, yand z-axes) with the origin set at the center of the bone ball was defined in accordance to the anatomical orientations (AP, ML and PD) to calculate the PSO. The QUS parameters were plotted against the scanning angle on the corresponding orthogonal plane in the Cartesian coordinates system. A specific angle was determined based on the peak measurement of the QUS parameters for the measurement around a specific anatomical axis. In the 3-dimensional Cartesian coordinates system, a plane normal to the orthogonal plane was determined based on that angle, and the three normal planes of all three corresponding measuring anatomical planes can be denoted as the following 3 equations:
| (3) |
Figure 1.
The trabecular bone ball (blue sphere) was placed in a Cartesian coordinates system defined by the orthogonal anatomical planes (frontal, sagittal and transverse planes) with the center of the ball placed at the origin of the coordinates. Based on the rotational ultrasound measurement around 3 anatomical axes, the angles α, β and γ were determined. These are the angles in which the ultrasound measurements obtained peak values. According to these angles, three vectors (green arrows) on the corresponding orthogonal anatomical planes were determined, i.e., the vector on the transverse plane is determined by the ultrasound measurements around proximal-distal axis. Along the direction of each of these 3 vectors, a plane was defined normal to the corresponding anatomical plane. These normal planes (gray planes) intersect at one line (blue dash line). The normal vectors of these normal planes were used to define the intersection line using Equation 1 and Equation 2. A vector (black arrow) along the direction of that intersection line is defined as the principal orientation predicted by ultrasound, and the angle difference φ compared to the longest vector of MIL tensor (pink arrow) was calculated.
The normal vectors of these planes, (a1, b1, c2), (a2, b2, c2) and (a3, b3, c3), were used to calculate the 3 intersecting lines between every two planes using the following equations:
| (4) |
Theoretically, these three vectors should represent the same direction because all three planes intersect at the same line. Again, this is based on the assumption that QUS measurement in the PSO should have the highest values and the peak values recorded in the rotational measurements around three anatomical axes were in the projected vector of PSO of the principal orientation on the orthogonal planes. For example, the peak value in the measurements rotating around x-axis was in the direction of the projected vector of the PSO on the y-z plane. Therefore, when using the intersections of every two normal planes to determine the principal orientation, the results should be the same line, because there can be only one intersecting line between every two planes. Due to the inevitable measurement error, intersection vectors of every two planes differed from each other. Therefore, a center vector I(x, y, z) is calculated from the intersection vectors (I12, I13 and I23). The three intersection vectors were converted from Cartesian coordinate system (x, y, z) to Spherical coordinate system (r, θ, φ). After that, the angular components of the vectors were averaged as the angular components of the center vector. The magnitude of the center vector was arbitrarily decided as 1. The center vector was then converted back to Cartesian coordinates system to compare to the longest vector of the MIL tensor, H(xH, yH, zH) by using the following equation:
| (5) |
Finite element analysis of μCT-based trabecular bone ball models
The implementation of the spherical trabecular bone model gave rise to the feasibility of repeating the mechanical testing on the same bone specimen in different orientations, besides the anatomical orientations which were the only available options in the traditional bone cube model. FEA based on μCT images usually consists of the following steps: convert the gray-scale Hounsfield Unit data in the standard DICOM format into calibrated and segmented values; convert the calibrated DICOM image into finite element model and assign local material property to it; apply loading and boundary conditions to the finite element model; validate the finite element model using in vitro mechanical testing. The unfiltered DICOM format μCT images of each bone ball were processed and converted into a 3-D tetrahedral meshing structure. To eliminate the effect induced by the surface condition, a smaller spherical subvolume of trabecular bone with a diameter of 12 mm from the center of each bone ball image was cropped out for analysis. For image segmentation, global optimum threshold values were chosen by visual observation to include all trabeculae of the bone sphere. For some models, manual modifications of the threshold values were implemented by visually comparing the segmented image and the underlying original image for all μCT images by only one observer.
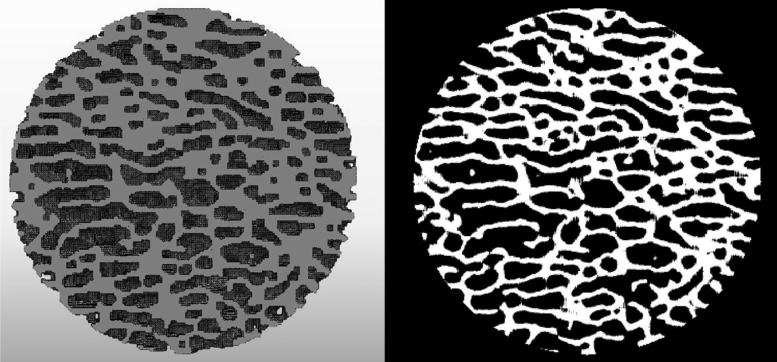
The segmented spherical sub-volumes of the bone samples were then used for mesh generation (Mimics V. 16.0, Meterialise NV, Plymouth, MI). Filters were applied to the volume of voxels to close small holes, filter small isolated parts, smooth the surface and improve connectivity of the model. Then a mesh of tetrahedral 4-point elements (C3D4) was created by grouping every two neighbor voxels together. The 3-dimensional mesh model was exported to ABAQUS version 6.10EF (Dassault Systemes, Inc., Providence, RI) (Figure 2). Certain notable changes can be observed between finite element model and the μCT image. These changes due to the filters applied and the grouping of voxels can induce differences between the mechanical properties between FEA and in vitro experiments. These differences are considered uniform throughout each model and independent of any tested orientation; therefore, do not affect the comparison between mechanical properties in different tested orientations.
Figure 2.
Typical cross-section of the spherical bone model in ABAQUS (left) and the binarized μCT image of the same section (right). After converted from the DICOM image from μCT using Mimics, the finite element mesh models used in the simulation were able to capture most of the geometrical features of the bone samples and reproduce the original structure of the samples.
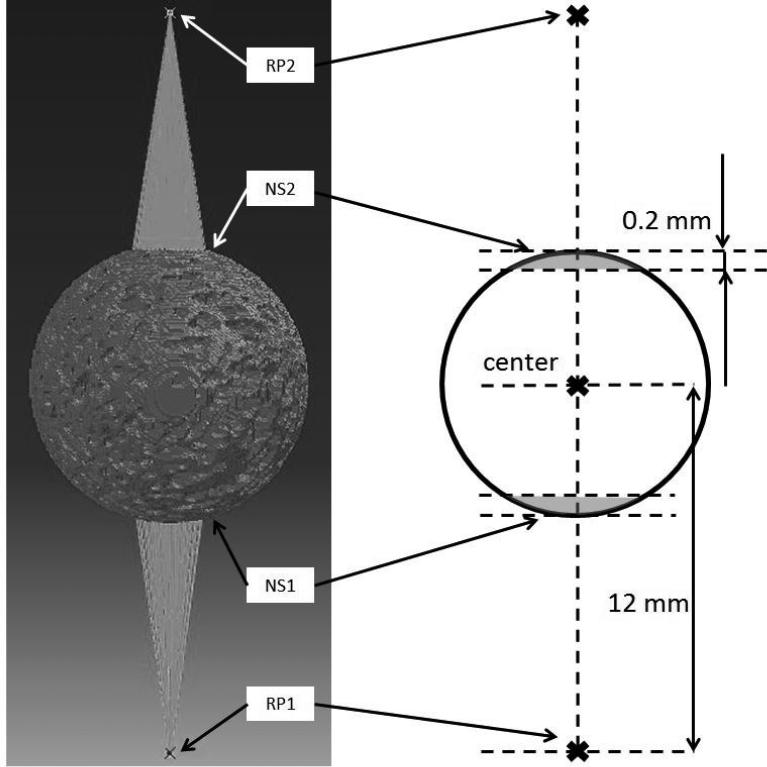
In the simulation, all seven bone ball models were loaded compressively in six orientations, AP, ML, PD, ATTmax (PSO predicted by ultrasound attenuation), UVmax (PSO predicted by ultrasound velocity) and MIL (PSO predicted by the longest vector of MIL tensor). Trabecular bone tissue in the models was assumed as homogenous and linear elastic isotropic. Density of 1739 kg/m3 (Ashman and Rho, 1988) and Poisson's ratio of 0.3 (Wirtz et al., 2000) were assigned to the material properties of the models. The Young's modulus assigned to each bone ball model was back-calculated from in vitro validation mechanical testing. The average Young's modulus of seven bone balls is 15.9 GPa. As shown in Figure 3, along the loading direction, two reference points (RP1, RP2) were defined 12 mm away from the center of the bone ball, on opposite sides. Two sets of nodes (NS1, NS2) were defined in accordance to the two reference points by using the following procedure: 1) two parallel planes perpendicular to the loading direction axis were defined; 2) one of the planes was tangent to the bone ball surface, and the other one was 0.2 mm into the bone ball; 3) the nodes between these two planes were included in the node set. The node sets were generated through a custom MATLAB program. The nodes in NS1 and NS2 were applied coupling with RP1 and RP2 in all six degrees of freedom. The introduction of RP1, RP2, NS1 and NS2 is to make sure that the compression loading is normal to the surface of the spherical model and through the center of the model. For the compressive loading, RP1 was pinned in all six degrees of freedom, while RP2 translated towards to center of the bone ball along the loading direction coupling with all the nodes in NS2 for 2,000 μstrain, namely 0.024 mm. This loading was done over the duration of 1 second. The reaction force of the whole model under the loading and the von Mises stress were recorded for analysis. Based on the reaction force of the bone ball models, the apparent stiffness of the bone samples in different loading orientations can be calculated by dividing the reaction force by the loading displacement. To focus on the stiffness difference between different orientations, and to eliminate the stiffness variance between different samples, the stiffness results in 6 orientations of each model were normalized to the stiffness value in the MIL orientation.
Figure 3.
For the boundary condition of the model, two sets of nodes (NS1, NS2) were defined to couple with two reference points (RP1, RP2). RP1 and RP2 were both 12 mm away from the center of the bone ball. The nodes in NS1 and NS2 (grey region in the schematic figure on the right) were respectively coupling constrained with RP1 and RP2 in all six degrees of freedom. During the loading, RP1 was encastred in all six degrees of freedom, and RP2 translated towards the center of the bone ball along the loading direction coupling with all the nodes in NS2 for 2,000 μstrain.
In vitro mechanical testing of the trabecular bone balls
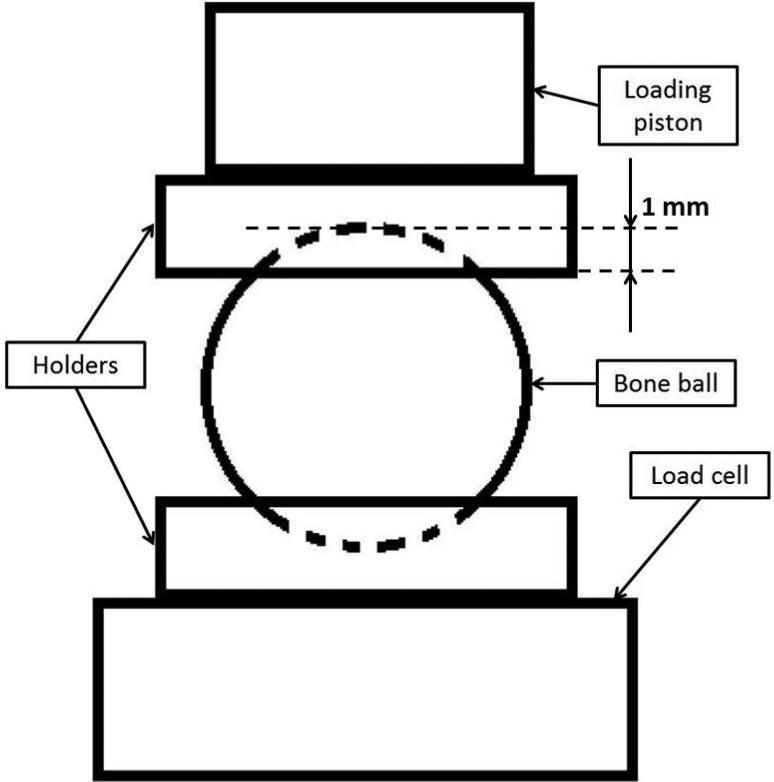
In vitro mechanical testing for the bone balls was performed to validate the model used in FEA. All seven bone balls were thoroughly thawed for 3 hours before the mechanical testing. Axial compressive loading was performed on a MTS MiniBionix 858 (MTS Corporation, Minneapolis, MN) axial load frame with TestStar II control software and a 5 kN MTS 19F-01 load cell. Two cylindrical holders were made of self-curing acrylic material to provide an interface between the bone sample and the loading piston (Serra-Hsu et al., 2011). One surface of the holder was polished flat with sand paper, and the other surface was made as a concave surface with a spherical wax mode, which had the same diameter as the bone balls. This concave surface created a bowl shape contact area about 1 mm deep to provide stable and uniformly distributed loading over the contact interface between the holder and the bone balls (Figure 4). The loading protocol began with a 50 N preload to make sure full contact between all the interfaces and eliminate the effect caused by the surface conditions of the samples. The loading then proceeded for 2,000 μstrain, namely 0.05 mm at the rate of 0.005 mm/s. The loading piston retreated back after the compressive loading, and the same loading cycle was repeated for 5 times. Force applied to the bone sample and displacement of the loading piston were recorded to calculate the apparent stiffness of the bone balls. For each bone ball sample, the compressive loading was performed in three anatomical orthogonal orientations, AP, ML and PD.
Figure 4.
Schematic representation of the in vitro mechanical testing set up. The bone ball was placed between two cylindrical holders with concave surfaces. The holders are made of self-curing acrylic, and each has one flat surface and one concave surface. The concave surfaces created a bowl shape area about 1 mm in depth and provided stable and uniformly distributed loading between the bone ball and the holder; the flat surface secured the stable and solid contact between the holders and the loading piston or load cell.
Data analysis
All values are reported as mean ± standard deviation. To confirm the normality of the data, Shapiro-Wilk test was performed, and normality was determined at significance of W<0.05. Repeat measures analysis of variance (ANOVA) and Tukey's post-hoc test were used to detect statistically significant differences between the normalized stiffness in different orientations. The same statistics test was also performed to compare the normalized von Mises stress in different tested orientations. Significance was determined at p<0.05, p<0.001 and p<0.0001. Correlations between stiffness in the PSOs predicted by QUS parameters and microCT and between FEA and in vitro mechanical loading were determined by using multiple linear regressions and Pearson's correlation coefficient.
Results
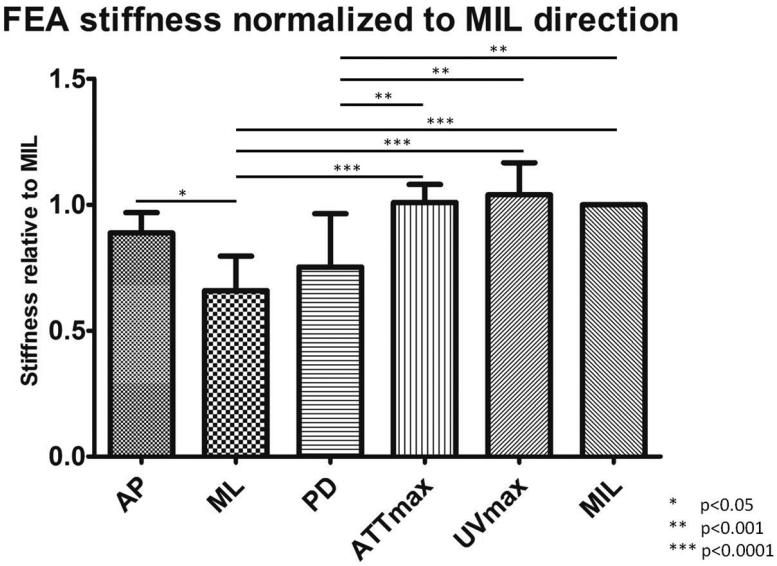
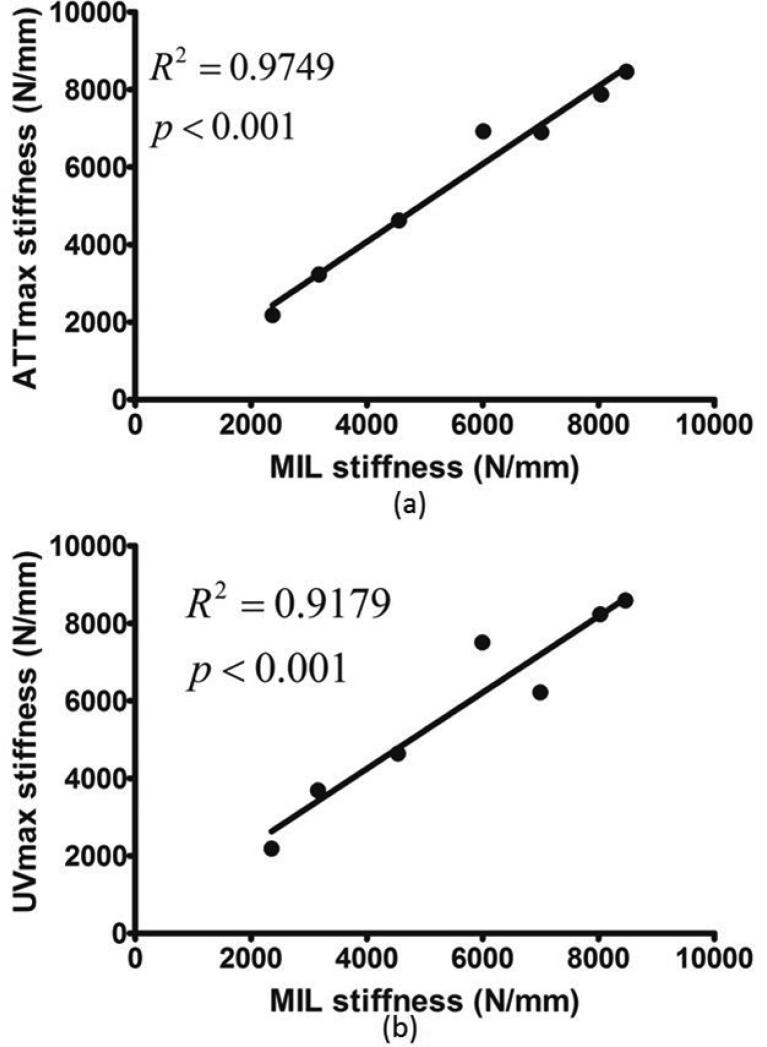
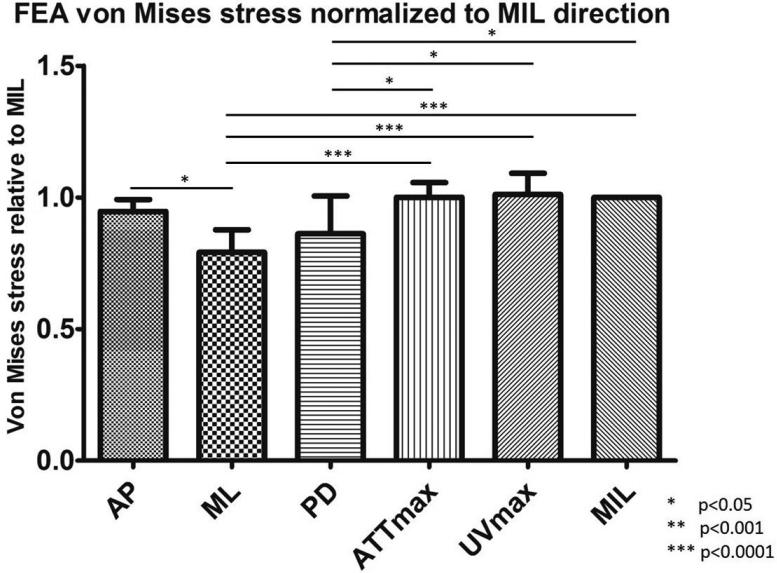
As reported in previous publication (Lin et al., 2012), the average angle difference between the PSOs predicted by ultrasound attenuation (ATTmax) and μCT is 11.67±6.83°; the angle difference between prediction by ultrasound velocity (UVmax) and μCT is 4.45±2.20°. The predictions from ATTmax and UVmax have an average angle difference of 8.96±7.48°. While stiffness in UVmax direction had the highest value out of all tested orientations, ML direction had the lowest value, 36.6% less than the stiffness in UVmax direction (p<0.0001). The other two anatomical orientations, AP and PD, were 14.6% and 27.6% (p<0.05), which is lower than UVmax. Stiffness in ATTmax and MIL directions were only 2.9% and 3.8% lower than UVmax (Figure 5). No statistical significance was found between the stiffness in the PSOs predicted by ATTmax, UVmax and MIL. With further analysis, highly significant correlations were also found between stiffness in the PSOs predicted by QUS parameters versus the longest vector of MIL tensor: ATTmax vs. MIL, R2=0.98, p<001; UVmax vs. MIL, R2=0.92, p<0.001 (Figure 6). Von Mises stress was also reported from the FEA in the same normalized manner as stiffness. Similar to stiffness, the Von Mises stress in the PSO predicted by UVmax has the highest value, only 1% and 1.1% higher than ATTmax and MIL, but 6.4%, 21.8% (p<0.001) and 14.7% (p<0.05) higher than the values of AP, ML and PD, respectively (Figure 7).
Figure 5.
The stiffness data from FEA was normalized to the values in the MIL orientations. Significant difference was observed: AP vs. ML, p<0.05; ML vs. ATTmax, p<0.0001; ML vs. UVmax, p<0.0001; ML vs. MIL, p<0.0001; PD vs. ATTmax, p<0.001; PD vs. UVmax, p<0.001; PD vs. MIL, p<0.001. No significant difference was observed between the stiffness in the PSOs predicted by ultrasound parameters and μCT.
Figure 6.
When comparing the stiffness from FEA of all seven bone ball models, highly significant correlations were found between the stiffness in the PSOs predicted by QUS and μCT. (a) ATTmax vs. MIL, R2=0.98, p<0.001; (b) UVmax vs. MIL, R2=0.92, p<0.001.
Figure 7.
The von Mises stress data was also normalized to the values in the MIL orientations. Significant difference was observed: AP vs. ML, p<0.05; ML vs. ATTmax, p<0.0001; ML vs. UVmax, p<0.0001; ML vs. MIL, p<0.0001; PD vs. ATTmax, p<0.05; PD vs. UVmax, p<0.05; PD vs. MIL, p<0.05. No significant difference was observed between the von Mises stress in the PSOs predicted by ultrasound parameters and μCT.
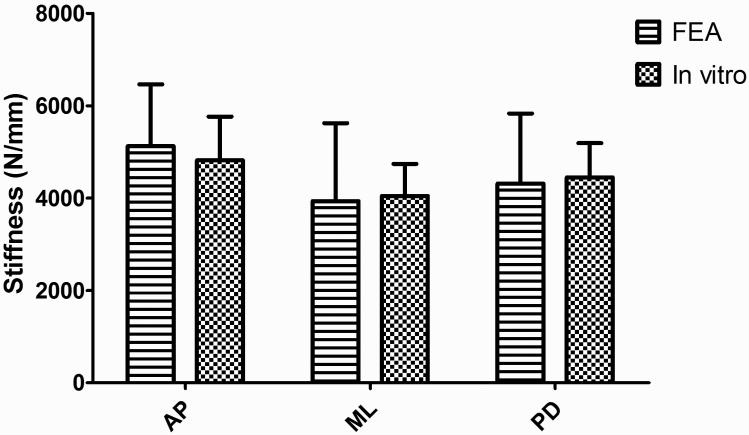
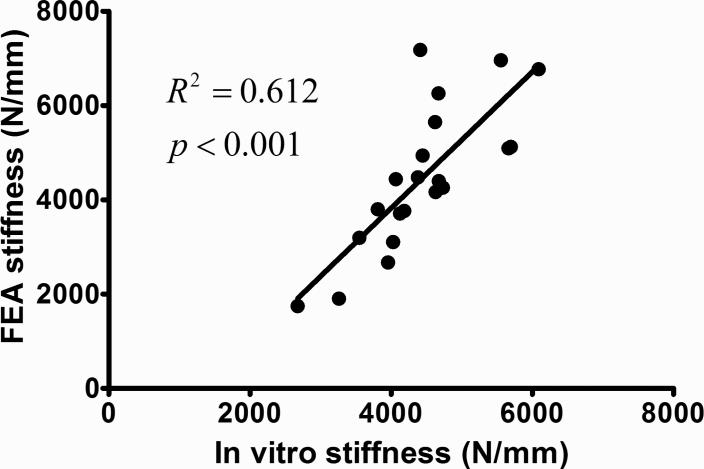
Similar to the data analysis of FEA, the slope of the loading force vs. loading displacement curve was calculated as the stiffness of the bone sample from the in vitro mechanical tests. The stiffness data from in vitro mechanical loading shows the same AP>PD>ML trend as the FEA data. Stiffness in ML direction is 16.0% and 9.0% lower than AP and PD. By comparing the stiffness from FEA and in vitro mechanical testing of the same loading direction, no significant difference was found in all three orientations (Figure 8). By pooling the stiffness data points of all anatomical orientations together, a highly strong and significant correlation (R2=0.61, p<0.001) exits between the FEA and in vitro mechanical testing (Figure 9).
Figure 8.
Comparison between the stiffness from both in vitro mechanical testing and FEA. The stiffness data from two different tests followed the same trend. The average difference percentage between the stiffness of two tests in the same orientation is 4.0%, and there is no significant difference found.
Figure 9.
Highly significant correlation was found between the stiffness data for all anatomical orientations of all seven bone balls in FEA and in vitro mechanical testing (R2=0.61, p<0.001).
Discussion
This study evaluated the mechanical properties of trabecular bone in various orientations by using μCT-based FEA method. The seven spherical trabecular bone samples were the same samples used in a previous study (Lin et al., 2012) to demonstrate the ability of QUS in detecting the principal structural orientation. Therefore, performing the μFEA on the same bone specimens not only served the purpose of validating such QUS prediction for PSO, but also helped to provide new insights on the correlation between QUS prediction and the anisotropic mechanical properties and microarchitecture of trabecular bone.
Previous studies (Hosokawa, 2006; Hosokawa and Otani, 1997, 1998; Mizuno et al., 2009; Mizuno et al., 2008; Mizuno et al., 2010; Yamamoto et al., 2009) all suggested that when ultrasound waves propagate along the direction of the trabecular bone alignment, ultrasound velocity is the fastest and the attenuation is the highest. The explanation for this phenomenon is that the ratio of trabecular structure along its alignment is the highest and the compression velocity of ultrasound in bone material is much higher than in water, and the ultrasound attenuation coefficient of bone material is also much higher than water or marrow. These findings all support our QUS prediction of PSO using either ATT or UV. The prediction of UV has a smaller angle difference (4.45°) with the MIL vector than the prediction of ATT (11.67°). This finding is in agreement with the work of Mizuno et al. (Mizuno et al., 2010), in which the velocity of fast wave was shown to have a higher correlation with the MIL tensor than the ultrasound attenuation. This study didn't focus on separation of the overlapping fast and slow waves. From the previous work, while the overlapping is observed, it didn't affect distinguishing the first high peak for the analysis of the signal arrival time. While the analysis of the ultrasound velocity is based on the fast wave, the attenuation calculation takes both fast and slow waves into consideration. This difference could be accountable for the angle difference between the PSO predictions of UV and ATT. The prediction of fast wave ultrasound velocity is not only better than attenuation by the average angle difference, but also by the angle variance of the interception vectors I12, I13 and I23. For the ease of comparing the angle difference of PSOs predicted by QUS and μCT and investigating the effect of the trabecular orientation on the mechanical properties, mean intercept length values of the PSOs predicted by ATTmax, UVmax and the maximum MIL from μCT are listed in Table 1.
Table 1.
Tensor coordinates values of the maximum MIL orientation from the μCT system and QUS measurement and the length of the vector in the MIL orientation |H2| in mm. The values of the QUS parameters, ATTmax and UVmax are converted from the spherical coordinates system. These values are used in the calculation of the angle difference between the PSOs predicted by μCT and QUS.
| Bone 1 | Bone 2 | Bone 3 | Bone 4 | Bone 5 | Bone 6 | Bone 7 | ||
|---|---|---|---|---|---|---|---|---|
| x | −0.0355 | 0.6974 | −0.7116 | 0.5412 | −0.0353 | −0.3926 | 0.6992 | |
| MIL | y | 0.4195 | −0.0384 | −0.0187 | −0.0408 | −0.7771 | −0.1243 | −0.0795 |
| z | 0.4941 | 0.3319 | 0.2507 | −0.2257 | 0.1636 | 0.8348 | 0.2528 | |
| x | −0.1156 | 0.8142 | −0.8919 | 0.9291 | −0.305 | −0.3418 | 0.8796 | |
| ATTmax | y | 0.3402 | −0.3072 | −0.1862 | −0.1129 | −0.8779 | −0.1244 | −0.1397 |
| z | 0.9332 | 0.4927 | 0.412 | −0.3521 | 0.3691 | 0.9315 | 0.4547 | |
| x | −0.1618 | 0.885 | −0.9275 | 0.9157 | −0.08815 | −0.352 | 0.9054 | |
| UVmax | y | 0.6546 | −0.0729 | −0.1157 | −0.07823 | −0.944 | −0.1386 | −0.1572 |
| z | 0.7384 | 0.4599 | 0.3555 | −0.3942 | 0.3179 | 0.9257 | 0.3944 | |
| |H2| (mm) | 0.6491 | 0.7733 | 0.7547 | 0.5878 | 0.7949 | 0.9309 | 0.7477 | |
In our study, the average material elastic modulus assigned to the model, 15.9 GPa, was in the range of the reported data of the previous studies (Ashman and Rho, 1988; Hosokawa and Otani, 1997; Isaksson et al., 2010). This value was back-calculated based on the biomechanical testing results, further proving the validity of the FEA model. According to the our previous work (Lin et al., 2012), there are certain angle differences between PSOs predicted by QUS parameters and μCT. Although these angle differences are relatively small, before this study, it was unknown how much of a difference in mechanical properties this angle difference can induce. It is very important to address that the PSO predicted by QUS not only has the highest value in QUS measurement, but also has the highest mechanical properties, because the development of using QUS to predict PSO serves the purpose of finding the best orientation to perform QUS measurement in order to get the highest correlation with mechanical properties. The loaded volumes of the bone balls in the FEA model are the center subvolume of the real bone balls and are smaller than the bone balls used in the mechanical test. This alteration resulted in the variation of the structural orientation of the outer layer of the trabecular bone ball not being analyzed in the FEA model. For the ROI of the QUS measurement, the ultrasound pulse propagates through the center of the bone ball, comparable to the ROI of the in vitro mechanical testing. In this study, due to the different ROIs used in the FEA model and QUS measurement, the in vitro mechanical testing also serves as a transition method to compare the results of FEA and QUS, besides validating the FEA model.
The main goal of this study is to find out how much the mechanical properties differentiate between the PSO predicted by QUS and the MIL orientation. Before the FEA, the angle difference between the PSO and MIL was quantified by QUS measurement. However, it is inappropriate to define whether this angle difference is “big” or “small” until the difference of the mechanical properties is determined. The stiffness in the PSOs predicted by ATTmax and UVmax are very close to the value in MIL orientation, with no significant differences. On the other hand, a significant difference can be found between the stiffness in the anatomical orientations and the QUS-predicted PSOs. These results lead to the conclusion that although the PSOs predicted by QUS and μCT have certain angle differences, the mechanical properties measured in these PSOs are of the same level, having no significant differences. The significant correlations between the stiffness in the PSO predicted by QUS parameters and MIL, in addition to the small difference of stiffness value, further demonstrated the ability of QUS in finding the principal orientation with the highest apparent stiffness.
It is noted that the correlation between the stiffness in the PSO predicted by UV and in the MIL orientation is lower than the correlation between the stiffness in the PSO predicted by the ATT and tin the MIL orientation, while the angle of the MIL orientation is more closer to the angle of the PSO predicted by UV than by ATT. In this study, we are more focus on relative comparison of mechanical properties in different orientations, the correlations between the stiffness in the PSOs predicted by QUS parameters and MIL directions can show us the validity of the FEA model in showing the relative relation of the mechanical properties in different orientations. We do not have any direct evidence to show a smaller angle difference between two orientations can lead to a higher correlation of mechanical properties in the two orientations. While the difference of mechanical properties in two close orientations can be small because of the small variation in structure, the correlations between the mechanical properties in these orientations could be affected by many factors, e.g., the two outliers in the UVmax stiffness vs. MIL stiffness graph. What we can conclude from the data presented in this paper is that the stiffness in the PSO predicted by QUS is not significantly different from the stiffness in the MIL direction. Further research on the geometrical distribution of the PSOs and MIL orientations could provide more insight on the relation between the proximity of orientations and the correlations of mechanical properties in the orientations.
The aim of both loading conditions in the FEA and in vitro was to make sure the compressive loading was normal to the sample surface, through the center of the bone ball and aligned with the desired tested orientation. The introduction of the concave holder used in the in vitro mechanical testing was able to stabilize the spherical bone sample during the compressive loading, and apply the loading uniformly over the concave surface along the orthogonal anatomical orientation of the bone ball sample. The linear translation of the reference point and the coupling between it and the node group was also able to simulate the same loading condition as the in vitro testing.
From our FEA analyses, von Mises stress was used to measure the equivalent stress to predict local tissue failure. The von Mises stress which takes into consideration principal and shear stresses of our bone model can predict the onset of bone yielding and indicate an increased propensity for local stress concentrations which could lead to local tissue failure. Displacement controlled compression loading protocol was used to ensure the same exertion of strain was applied on all bone models in every tested orientation. Our data clearly indicates that under the same compressive loading protocol, the distribution of von Mises stresses when loaded in the PSOs predicted by QUS is similar to that of MIL orientation and significantly higher than other anatomical orientations. While it is indicated that the local concentration of stress is higher in those QUS orientations, it is also implied that it takes more work to deform the bone in these PSOs due to the higher resistant force. The apparent stiffness data, combined with von Mises stress data, comprehensively leads to the conclusion that QUS clearly predicts the geometrical anisotropy nature of our bone models, and the PSOs predicted by QUS parameters not only have the higher apparent stiffness, but also are more structurally stable and less likely to yield, compared to the anatomical orientations.
It should be recognized that the essential methodologies and mechanisms of predicting such PSO are different when using QUS and μCT (Whitehouse, 1974). Researchers have shown that there is a certain angle difference between the trabeculae alignment and the orthogonal anatomical orientations (Pidaparti and Turner, 1997), between the loading milieu applied and the force distribution pattern (Biewener et al., 1996), and between the principal orientation of the loading environment and the principal alignment of the trabeculae (Gefen and Seliktar, 2004). These findings all remind us of the fact that simply investigating the geometric parameters cannot provide a comprehensive understanding of how the microarchitecture of trabecular bone is affected by the mechanical environment and react to it in return.
As a successive study of the previous work (Lin et al., 2012), this paper evaluates the mechanical properties in the PSO predicted by QUS, thus validated the ability of QUS in predicting such orientations. Future studies should take a step back and use this angle-dependent mechanical information to understanding the mechanism of such QUS modality. One limitation of this study is that successive compressive loading tests were performed on one sample in the in vitro testing. Residual effects such as microcrack induced by the previous compressive loading can affect the results of the latter testing in different orientation. To minimize such effect, the compressive loading was controlled at 2000 μstrain, which is within the elastic deformation range of trabecular bone and reported as the peak strain experienced by human in daily vigorous activities (Burr et al., 1996; Burr et al., 1998; Rubin and Lanyon, 1984). With this study, it is shown that although there is a certain angle difference between the PSOs predicted by QUS and μCT, the mechanical properties in these orientations are very close. A further study in the details of the propagation of ultrasound wave in trabecular bone, combined with the comprehensive information of the geometrical parameters, should be able to take us one step closer to the answer of the very question: can we use quantitative ultrasound to find the principal structural orientation of trabecular bone, and why?
Acknowledgement
This work is kindly supported by the National Space Biomedical Research Institute through NASA Cooperative Agreement NCC 9-58, NIH (AR52379 & AR61821), and NYSTAR.
Footnotes
*Conflict of Interest*
There is no conflict of interest for all authors.
References
- Ashman RB, Corin JD, Turner CH. Elastic properties of cancellous bone: measurement by an ultrasonic technique. Journal of Biomechanics. 1987;20:979–986. doi: 10.1016/0021-9290(87)90327-7. [DOI] [PubMed] [Google Scholar]
- Ashman RB, Rho JY. Elastic modulus of trabecular bone material. J Biomech. 1988;21:177–181. doi: 10.1016/0021-9290(88)90167-4. [DOI] [PubMed] [Google Scholar]
- Bevill G, Eswaran SK, Gupta A, Papadopoulos P, Keaveny TM. Influence of bone volume fraction and architecture on computed large-deformation failure mechanisms in human trabecular bone. Bone. 2006;39:1218–1225. doi: 10.1016/j.bone.2006.06.016. [DOI] [PubMed] [Google Scholar]
- Biewener AA, Fazzalari NL, Konieczynski DD, Baudinette RV. Adaptive changes in trabecular architecture in relation to functional strain patterns and disuse. Bone. 1996;19:1–8. doi: 10.1016/8756-3282(96)00116-0. [DOI] [PubMed] [Google Scholar]
- Burghardt AJ, Link TM, Majumdar S. High-resolution computed tomography for clinical imaging of bone microarchitecture. Clinical Orthopaedics and Related Research. 2011;469:2179–2193. doi: 10.1007/s11999-010-1766-x. [DOI] [PMC free article] [PubMed] [Google Scholar]
- Burr DB, Milgrom C, Fyhrie D, Forwood M, Nyska M, Finestone A, Hoshaw S, Saiag E, Simkin A. In vivo measurement of human tibial strains during vigorous activity. Bone. 1996;18:405–410. doi: 10.1016/8756-3282(96)00028-2. [DOI] [PubMed] [Google Scholar]
- Burr DB, Turner CH, Naick P, Forwood MR, Ambrosius W, Hasan MS, Pidaparti R. Does microdamage accumulation affect the mechanical properties of bone? J Biomech. 1998;31:337–345. doi: 10.1016/s0021-9290(98)00016-5. [DOI] [PubMed] [Google Scholar]
- Cardoso L, Cowin SC. Fabric dependence of quasi-waves in anisotropic porous media. Journal of the Acoustical Society of America. 2011;129:3302–3316. doi: 10.1121/1.3557032. [DOI] [PMC free article] [PubMed] [Google Scholar]
- Cardoso L, Cowin SC. Role of structural anisotropy of biological tissues in poroelastic wave propagation. Mechanics of Materials. 2012;44:174–188. doi: 10.1016/j.mechmat.2011.08.007. [DOI] [PMC free article] [PubMed] [Google Scholar]
- Cardoso L, Teboul F, Sedel L, Oddou C, Meunier A. In vitro acoustic waves propagation in human and bovine cancellous bone. Journal of Bone and Mineral Research. 2003;18:1803–1812. doi: 10.1359/jbmr.2003.18.10.1803. [DOI] [PubMed] [Google Scholar]
- Cody DD, Gross GJ, J. Hou F, Spencer HJ, Goldstein SA, P. Fyhrie D. Femoral strength is better predicted by finite element models than QCT and DXA. Journal of Biomechanics. 1999;32:1013–1020. doi: 10.1016/s0021-9290(99)00099-8. [DOI] [PubMed] [Google Scholar]
- Cowin SC, Cardoso L. Fabric dependence of wave propagation in anisotropic porous media. Biomechanics and modeling in mechanobiology. 2011;10:39–65. doi: 10.1007/s10237-010-0217-7. [DOI] [PMC free article] [PubMed] [Google Scholar]
- Eswaran SK, Fields AJ, Nagarathnam P, Keaveny TM. Multi-scale modeling of the human vertebral body: comparison of micro-CT based high-resolution and continuum-level models. Pacific Symposium on Biocomputing Pacific Symposium on Biocomputing. 2009:293–303. [PubMed] [Google Scholar]
- Gefen A, Seliktar R. Comparison of the trabecular architecture and the isostatic stress flow in the human calcaneus. Med Eng Phys. 2004;26:119–129. doi: 10.1016/j.medengphy.2003.10.003. [DOI] [PubMed] [Google Scholar]
- Gluer CC. Quantitative ultrasound techniques for the assessment of osteoporosis: expert agreement on current status. The International Quantitative Ultrasound Consensus Group. Journal of Bone and Mineral Research. 1997;12:1280–1288. doi: 10.1359/jbmr.1997.12.8.1280. [DOI] [PubMed] [Google Scholar]
- Haiat G, Sasso M, Naili S, Matsukawa M. Ultrasonic velocity dispersion in bovine cortical bone: an experimental study. Journal of the Acoustical Society of America. 2008;124:1811–1821. doi: 10.1121/1.2950091. [DOI] [PubMed] [Google Scholar]
- Han SM, Rho JY. Dependence of broadband ultrasound attenuation on the elastic anisotropy of trabecular bone. Proceedings of the Institution of Mechanical Engineers Part H. Journal of Engineering in Medicine. 1998;212:223–227. doi: 10.1243/0954411981534006. [DOI] [PubMed] [Google Scholar]
- Hosokawa A. Ultrasonic pulse waves in cancellous bone analyzed by finite-difference time-domain methods. Ultrasonics 44 Suppl. 2006;1:e227–231. doi: 10.1016/j.ultras.2006.06.020. [DOI] [PubMed] [Google Scholar]
- Hosokawa A. Numerical analysis of variability in ultrasound propagation properties induced by trabecular microstructure in cancellous bone. IEEE transactions on ultrasonics, ferroelectrics, and frequency control. 2009;56:738–747. doi: 10.1109/TUFFC.2009.1096. [DOI] [PubMed] [Google Scholar]
- Hosokawa A. Effect of porosity distribution in the propagation direction on ultrasound waves through cancellous bone. IEEE transactions on ultrasonics, ferroelectrics, and frequency control. 2010;57:1320–1328. doi: 10.1109/TUFFC.2010.1552. [DOI] [PubMed] [Google Scholar]
- Hosokawa A. Numerical investigation of ultrasound refraction caused by oblique orientation of trabecular network in cancellous bone. IEEE Trans Ultrason Ferroelectr Freq Control. 2011a;58:1389–1396. doi: 10.1109/TUFFC.2011.1958. [DOI] [PubMed] [Google Scholar]
- Hosokawa A. Numerical investigation of ultrasound refraction caused by oblique orientation of trabecular network in cancellous bone. IEEE Transactions on Ultrasonics, Ferroelectrics, and Frequency Control. 2011b;58:1389–1396. doi: 10.1109/TUFFC.2011.1958. [DOI] [PubMed] [Google Scholar]
- Hosokawa A, Otani T. Ultrasonic wave propagation in bovine cancellous bone. The Journal of the Acoustical Society of America. 1997;101:558–562. doi: 10.1121/1.418118. [DOI] [PubMed] [Google Scholar]
- Hosokawa A, Otani T. Acoustic anisotropy in bovine cancellous bone. The Journal of the Acoustical Society of America. 1998;103:2718–2722. doi: 10.1121/1.422790. [DOI] [PubMed] [Google Scholar]
- Isaksson H, Nagao S, MaŁkiewicz M, Julkunen P, Nowak R, Jurvelin JS. Precision of nanoindentation protocols for measurement of viscoelasticity in cortical and trabecular bone. Journal of Biomechanics. 2010;43:2410–2417. doi: 10.1016/j.jbiomech.2010.04.017. [DOI] [PubMed] [Google Scholar]
- Keaveny TM. Biomechanical computed tomography—noninvasive bone strength analysis using clinical computed tomography scans. Annals of the New York Academy of Sciences. 2010;1192:57–65. doi: 10.1111/j.1749-6632.2009.05348.x. [DOI] [PubMed] [Google Scholar]
- Kim D-G, Hunt C, Zauel R, Fyhrie D, Yeni Y. The Effect of Regional Variations of the Trabecular Bone Properties on the Compressive Strength of Human Vertebral Bodies. Annals of Biomedical Engineering. 2007;35:1907–1913. doi: 10.1007/s10439-007-9363-1. [DOI] [PubMed] [Google Scholar]
- Krug R, Burghardt AJ, Majumdar S, Link TM. High-resolution imaging techniques for the assessment of osteoporosis. Radiologic clinics of North America. 2010;48:601–621. doi: 10.1016/j.rcl.2010.02.015. [DOI] [PMC free article] [PubMed] [Google Scholar]
- Langton CM, Palmer SB, Porter RW. The measurement of broadband ultrasonic attenuation in cancellous bone. Engineering in medicine. 1984;13:89–91. doi: 10.1243/emed_jour_1984_013_022_02. [DOI] [PubMed] [Google Scholar]
- Lee KI, Hughes ER, Humphrey VF, Leighton TG, Choi MJ. Empirical angle-dependent Biot and MBA models for acoustic anisotropy in cancellous bone. Physics in Medicine and Biology. 2007;52:59–73. doi: 10.1088/0031-9155/52/1/005. [DOI] [PubMed] [Google Scholar]
- Lin L, Cheng J, Lin W, Qin YX. Prediction of trabecular bone principal structural orientation using quantitative ultrasound scanning. Journal of Biomechanics. 2012;45:1790–1795. doi: 10.1016/j.jbiomech.2012.04.022. [DOI] [PMC free article] [PubMed] [Google Scholar]
- Lin W, Mittra E, Qin YX. Determination of ultrasound phase velocity in trabecular bone using time dependent phase tracking technique. Journal of Biomechanical Engineering. 2006;128:24–29. doi: 10.1115/1.2132369. [DOI] [PubMed] [Google Scholar]
- Link TM. Osteoporosis imaging: state of the art and advanced imaging. Radiology. 2012;263:3–17. doi: 10.1148/radiol.12110462. [DOI] [PMC free article] [PubMed] [Google Scholar]
- Liu XS, Bevill G, Keaveny TM, Sajda P, Guo XE. Micromechanical analyses of vertebral trabecular bone based on individual trabeculae segmentation of plates and rods. Journal of Biomechanics. 2009;42:249–256. doi: 10.1016/j.jbiomech.2008.10.035. [DOI] [PMC free article] [PubMed] [Google Scholar]
- Martin RB, Burr DB, Sharkey NA. Skeletal tissue mechanics. Springer; New York: 1998. [Google Scholar]
- Mizuno K, Matsukawa M, Otani T, Laugier P, Padilla F. Propagation of two longitudinal waves in human cancellous bone: an in vitro study. The Journal of the Acoustical Society of America. 2009;125:3460–3466. doi: 10.1121/1.3111107. [DOI] [PubMed] [Google Scholar]
- Mizuno K, Matsukawa M, Otani T, Takada M, Mano I, Tsujimoto T. Effects of structural anisotropy of cancellous bone on speed of ultrasonic fast waves in the bovine femur. IEEE Transactions on Ultrasonics, Ferroelectrics, and Frequency Control. 2008;55:1480–1487. doi: 10.1109/TUFFC.2008.823. [DOI] [PubMed] [Google Scholar]
- Mizuno K, Somiya H, Kubo T, Matsukawa M, Otani T, Tsujimoto T. Influence of cancellous bone microstructure on two ultrasonic wave propagations in bovine femur: an in vitro study. The Journal of the Acoustical Society of America. 2010;128:3181–3189. doi: 10.1121/1.3493444. [DOI] [PubMed] [Google Scholar]
- NIH Osteoporosis prevention, diagnosis, and therapy. NIH consensus statement. 2000;17:1–45. [PubMed] [Google Scholar]
- Njeh CF, Boivin CM, Langton CM. The role of ultrasound in the assessment of osteoporosis: a review. Osteoporosis International. 1997;7:7–22. doi: 10.1007/BF01623454. [DOI] [PubMed] [Google Scholar]
- Pidaparti RM, Turner CH. Cancellous bone architecture: advantages of nonorthogonal trabecular alignment under multidirectional joint loading. J Biomech. 1997;30:979–983. doi: 10.1016/s0021-9290(97)00052-3. [DOI] [PubMed] [Google Scholar]
- Qin Y-X, Xia Y, Lin W, Mittra E, Rubin C, Gruber B. Noninvasive Ultrasound Imaging for Bone Quality Assessment Using Scanning Confocal Acoustic Diagnosis, μCT, DXA Measurements, and Mechanical Testing. In: Zhang D, editor. Medical Biometrics. Springer; Berlin / Heidelberg: 2007. pp. 216–223. [Google Scholar]
- Rubin CT, Lanyon LE. Dynamic strain similarity in vertebrates; an alternative to allometric limb bone scaling. Journal of theoretical biology. 1984;107:321–327. doi: 10.1016/s0022-5193(84)80031-4. [DOI] [PubMed] [Google Scholar]
- Serra-Hsu F, Cheng J, Lynch T, Qin YX. Evaluation of a pulsed phase-locked loop system for noninvasive tracking of bone deformation under loading with finite element and strain analysis. Physiological measurement. 2011;32:1301–1313. doi: 10.1088/0967-3334/32/8/019. [DOI] [PMC free article] [PubMed] [Google Scholar]
- Tommasini SM, Trinward A, Acerbo AS, De Carlo F, Miller LM, Judex S. Changes in intracortical microporosities induced by pharmaceutical treatment of osteoporosis as detected by high resolution micro-CT. Bone. 2012;50:596–604. doi: 10.1016/j.bone.2011.12.012. [DOI] [PMC free article] [PubMed] [Google Scholar]
- Wald MJ, Magland JF, Rajapakse CS, Bhagat YA, Wehrli FW. Predicting trabecular bone elastic properties from measures of bone volume fraction and fabric on the basis of micromagnetic resonance images. Magnetic Resonance in Medicine. 2011 doi: 10.1002/mrm.23253. n/a-n/a. [DOI] [PMC free article] [PubMed] [Google Scholar]
- Whitehouse WJ. The quantitative morphology of anisotropic trabecular bone. Journal of Microscopy. 1974;101:153–168. doi: 10.1111/j.1365-2818.1974.tb03878.x. [DOI] [PubMed] [Google Scholar]
- Wirtz DC, Schiffers N, Pandorf T, Radermacher K, Weichert D, Forst R. Critical evaluation of known bone material properties to realize anisotropic FE-simulation of the proximal femur. Journal of Biomechanics. 2000;33:1325–1330. doi: 10.1016/s0021-9290(00)00069-5. [DOI] [PubMed] [Google Scholar]
- Wolff J. The Law of Bone Remodeling. Springer; Berlin Heidelberg New York: 1896. [Google Scholar]
- Xia Y, Lin W, Qin YX. Bone surface topology mapping and its role in trabecular bone quality assessment using scanning confocal ultrasound. Osteoporosis International. 2007;18:905–913. doi: 10.1007/s00198-007-0324-1. [DOI] [PubMed] [Google Scholar]
- Yamamoto T, Otani T, Hagino H, Katagiri H, Okano T, Mano I, Teshima R. Measurement of human trabecular bone by novel ultrasonic bone densitometry based on fast and slow waves. Osteoporosis International. 2009;20:1215–1224. doi: 10.1007/s00198-008-0774-0. [DOI] [PubMed] [Google Scholar]
- Yeni YN, Zelman EA, Divine GW, Kim D-G, Fyhrie DP. Trabecular shear stress amplification and variability in human vertebral cancellous bone: Relationship with age, gender, spine level and trabecular architecture. Bone. 2008;42:591–596. doi: 10.1016/j.bone.2007.11.011. [DOI] [PMC free article] [PubMed] [Google Scholar]


