

I. Introduction
In this chapter we describe the development of a high-resolution, multimode digital imaging system based on a wide-field epifluorescent and transmitted light microscope and a cooled charge-coupled device (CCD) camera. Taylor and colleagues (Farkas et al., 1993; Taylor et al., 1992) have reviewed the advantages of using multiple optical modes to obtain quantitative information about cellular processes and described instrumentation they have developed for multimode digital imaging. The instrument described here is somewhat specialized for our microtubule and mitosis studies, but it is also applicable to a variety of problems in cellular imaging including tracking proteins fused to the green fluorescent protein (GFP) in live cells (Cubitt et al., 1995; Heim and Tsien, 1996; Olson et al., 1995). For example, the instrument has been valuable for correlating the assembly dynamics of individual cytoplasmic microtubules (labeled by conjugating X-rhodamine to tubulin) with the dynamics of membranes of the endoplasmic reticulum (ER, labeled with DiOC6) and the dynamics of the cell cortex [by differential interference contrast (DIC)] in migrating vertebrate epithelial cells (Waterman-Storer and Salmon, 1997). The instrument has also been important in the analysis of mitotic mutants in the powerful yeast genetic system Saccharo-myces cerevisiae. Yeast cells are a major challenge for high-resolution imaging of nuclear or microtubule dynamics because the preanaphase nucleus is only about 2 μm wide in a cell about 6 μm wide. We have developed methods for visualizing nuclear and spindle dynamics during the cell cycle using high-resolution digitally enhanced DIC (DE-DIC) imaging (Yang et al., 1997; Yeh et al., 1995). Using genetic and molecular techniques. Bloom and coworkers (Shaw et al., 1997a,b) have been able to label the cytoplasmic astral microtubules in dividing yeast cells by expression of cytoplasmic dynein fused to GFP. Overlays of GFP and DIC images of dividing cells have provided the opportunity to see for the first time the dynamics of cytoplasmic microtubules in live yeast cells and how these dynamics and microtubule interactions with the cell cortex change with mitotic cell cycle events in wild-type and in mutant strains (Shaw et al., 1997a,b).
Our high-resolution multimode digital imaging system is shown in Fig. 1 and diagrammed in Fig. 2. The legend to Fig. 2 provides model numbers and sources of the key components of the instrument. There are three main parts to the system: a Nikon FXA microscope, a Hamamatsu C4880 cooled CCD camera, and a MetaMorph digital imaging system. First we will consider our design criteria for the instrument, then consider separately the major features of the microscope components, the cooled CCD camera, and the MetaMorph digital imaging system. The reader is referred to other sources for general aspects of microscope optics (Inoué and Oldenbourg, 1993; Keller, 1995; Spencer, 1982); DIC microscopy (Salmon, 1998); fluorescence microscopy (Taylor and Salmon, 1989); video cameras, slow-scan cameras, and video microscopy (Aikens et al., 1989; CLMIB staff, 1995; Inoué, 1986; Inoué and Spring, 1997; Shotten, 1995) and 3D imaging methods (Carrington et al., 1995; Hiroka et al., 1991; Pawley, 1995).
Fig. 1.

Photograph of the multimode digital imaging system including the Nikon FXA upright microscope sitting on an air table (Newport Corp., Irvine, CA, VW-3660 with 4-inch-high tabletop). Images are captured with a Hamamatsu C4880 cooled CCD camera. Image acquisition, storage, processing, analysis, and display are controlled by MetaMorph Digital Imaging software in a Pentium-based computer.
Fig. 2.

Component parts are L1, 100-watt quartz halogen lamp; S1, Uniblitz shutter (No. 225L2A1Z523398, Vincent Associates, Rochester, NY); G, ground glass diffuser: FBI, manual filter changers including KG4 heat cut and green interference filters; I1, field iris diaphragm; I2, condenser iris diaphragm; P and A, high transmission Nikon polaroid polarizer and removable analyzer; WC, and WO, Wollaston prisms for condenser and objective: C. Nikon NA = 1.4 CON A. Achr-Apl condenser; ST, rotatable stage with focus position controlled by z-axis stepper motor (Mac2000, Ludl Electronic Products, LTD., Hawthorne, NY); OB, 20X/NA = .75 or 60X/NA = 1.4 Nikon objectives; MBPDEF, epifilter block with multiple bandpass dichromatic mirror and emission filter (Nos. 83101 and 83100. Chroma Technology Corp., Brattleboro, VT); L2, 100-watt HBO mercury lamp; F, KG4 heat cut filter; S2 shutter; DFW, dual 8-position filter wheel (Metaltek, Raleigh, NC), one wheel containing neutral density filters (No. FNQ011, Melles Griot, Irvine, CA) and the other a series of narrow bandpass excitation filters (Nos. 83360, 83490, and 83570, Chroma Technology Corp.); FB2, manual filter changer; I3, epicondenser iris diaphragm; I4, epifield diaphragm slider; SL, slit (25 μm width. No. 04PAS004, Melles Griot, Irvine, CA) cemented to Nikon pinhole slider (No. 84060) for photoactivation; FS, filter slider; M, optivar magnification changer, 1 – 2 × OC, oculars; AFW, 4-position filter wheel (Biopoint filter wheel No. 99B100, Ludl Electronic Products, LTD., Hawthorne, NY) with one position containing a Nikon high transmission polarizer for the analyzer and another position an optical glass flat of the same thickness as the analyzer; CCD, cooled CCD camera (No. C4880, Hamamatsu Photonics, Bridgewater, NJ); DD, 1024 × 768-pixel, 20-inch digital graphics display monitor (No. 2082, Viewsonic); VD, RGB video display monitor (No. PVM1271Q, Sony); MetaMorph digital imaging system (Universal Imaging Corp., West Chester, PA) with a 166-MHz Pentium computer having both EISA and PCI bus. 128-MByte RAM memory, Imaging Technology AFG digital and video image processing card, Hamamatsu C4880 CCD controller card, Matrox MGA Melenimum 4-M RAM graphics display card, SVGA graphics display to S-VHS converter card (Hyperconverter, PC Video Conversion Corp., San Jose, CA). 1.4-MByte floppy drive, 2-GByte hard drive, 1-Gbyte Iomega Jaz drive, Hewlett Packard SureStore CD Writer 40201, ethernet card, and parallel port cards for controlling shutter S1 and driving laser printer; 8–serial port card for controlling MetalTek filter wheel, Ludl z-axis stepper, CCD camera, and OMDR: OD, Pinnacle Micro 1.3-GByte optical drive; TBC, time-base corrector; OMDR, Panasonic 2028 Optical Memory Disk Recorder. Video is also recorded on a Panasonic AG-1980P S-VHS recorder and a Panasonic AG-6750A time-lapse S-VHS recorder. Modified from Salmon et al. (1994).
II. Design Criteria
A. Fluorescence Considerations
When we began building our instrument 4 years ago, our primary objective was to obtain quantitative time-lapse records of spindle microtubule dynamics and chromosome movements for mitosis in live tissue culture cells and in in vitro assembled spindles in Xenopus egg extracts. Fluorescence optical components were chosen, in part, based on the fluorophores that were available for labeling microtubules, chromosomes, and other microtubule- or spindle-associated components. Microtubules could be fluorescently labeled along their lengths by incorporating X-rhodamine-labeled tubulin into the cytoplasmic tubulin pool (Fig. 3; Murray et al., 1996; Salmon et al., 1994). In addition, we needed to use fluorescence photoactivation methods to produce local marks on spindle microtubules to study the dynamics of their assembly (Mitchison and Salmon, 1993; Waters et al., 1996). This is accomplished by the addition of a cagedfluorescein-labeled tubulin to the cytoplasmic pool and fluorescence photoactivation with a 360-nm microbeam as described by Mitchison and coworkers (Mitchison, 1989; Sawin and Mitchison, 1991; Sawin et al., 1992). In extracts and some living cells, chromosomes can be vitally stained with the DNA intercalating dyes DAPI or Hoescht 33342 (Murray et al., 1996; Sawin and Mitchison, 1991). Thus, in fluorescence modes, we needed to be able to obtain images in a “red channel” for X-rhodamine microtubules, a “green channel” for photoactivated fluorescein marks, and a “blue channel” for chromosomes.
Fig. 3.

Views of a living, dividing yeast, Saccharomyces cerevisiae, by (A) fluorescence of GFP protein bound to nuclear histones and (B) DIC.* (C) Images in DIC of the 0.24-μm spacing between rows of surface pores of the diatom Amphipleura illuminated with green light.* Images of a spindle undergoing in vitro anaphase in Xenopus cytoplasmic egg extracts: (D) DAPI-stained chromosomes, (E) X-rhodamine-tubulin-labeled spindle and aster microtubules, and (F) phase contrast (Nikon 20X/NA = 0.75 Fluar Phase 3 objective). See Murray et al. (1996) for details. Stereo-pair images (G) of DAPI-stained chromosomes generated from a stack of 0.5-μm optical sections through a Xenopus spindle fixed in the extracts in midanaphase.* (*, Nikon 60X/NA = 1.4 Plan Apo DIC objective and NA = 1.4 condenser illumination for DIC.) With permission from Salmon et al. (1994).
B. Live Cell Considerations
Photobleaching and photodamage are a major concern during time-lapse imaging of fluorescently tagged molecules in live cells or in in vitro extracts. Minimizing these problems requires that the specimen be illuminated by light shuttered between camera exposures, that the imaging optics have high transmission efficiencies, that the camera detectors have high quantum efficiency at the imaging wavelengths, and that light can be integrated on the detector to reduce illumination intensity and allow longer imaging sessions without photo-damage. This later point is true not only for epifluorescence but also for transmitted light (phase-contrast or DIC) imaging. In our studies, the detector also needed a high dynamic range (12 bits = 4096 gray levels), as we wanted to be able to quantitate the fluorescence of a single microtubule or the whole mitotic spindle, which could have 1000 or more microtubules. In addition, the red, green, and blue images needed to be in focus at the same position on the detector so that the fluorophores within the specimen could be accurately correlated.
C. Phase Contrast and DIC Imaging
Phase contrast or DIC-transmitted light images allow the localization of fluorescently tagged molecules in the cells to be correlated with overall cell structure or the positions of the chromosomes, nucleus, cell cortex, and so on (Fig. 3). DIC has much better resolution than phase contrast (Inoué and Oldenbourg, 1993) and excellent optical sectioning abilities (Inoué, 1989), but unlike phase contrast, an analyzer must be placed in the light path after the objective. Conventional analyzers typically transmit 35% or less of incident unpolarized light, and thus for sensitive fluorescence methods, the analyzer must be removed from the light path for fluorescence imaging and inserted for DIC imaging.
D. The Need for Optical Sections
In some of our studies, three dimensional images from “z-axis” series of images or four dimensional microscopy where a z-axis image series is recorded at each time point in a time-lapse series have been required. For example, proteins localized to the kinetochore of one chromosome may be 5 μm out of focus with the kinetochore of another chromosome in the same cell. To see all of the kinetochores in the cell, several focal planes are acquired along the z-axis and projected into a single two dimensional representation of the three dimensional data.
III. Microscope Design
The Nikon FXA upright microscope (Figs. 1 and 2) can produce high-resolution images for both epifluorescent and transmitted light illumination without switching the objective or moving the specimen. The functional aspects of the microscope set-up can be considered in terms of the imaging optics, the epiillumination optics, the transillumination optics, the focus control, and the vibration isolation table.
A. Imaging Optics
Light collected by the objective passes through the body tube, the filter cube holder of the epifluorescence illuminator, a magnification changer, then either straight to the camera or by a prism into the binocular tube for viewing by eye. The cooled CCD camera is mounted at the primary image plane of the microscope.
1. Objectives and Matching Condenser
In epifluorescence microscopy, the intensity of the image varies as the fourth power of objective numerical aperture (NA) and inversely with the square of the magnification (M) between the objective and the detector (Taylor and Salmon, 1989):
| (1) |
where Iil is the intensity of the epiillumination light entering the objective aperture. For high-resolution work, we typically use the highest NA possible (NA = 1.4) to maximize fluorescence intensity. Most of our specimens are less than 10/μm thick, so that lower-NA objectives or water-immersion objectives that have better performance for thicker specimens (Keller, 1995) have not been necessary. For high-resolution work, we use a Nikon 60X/NA = 1.4 Plan-Apochromatic objective, either the one designed for phase-contrast or the one designed for DIC. The specimen is illuminated in the transmitted light mode through a Nikon NA = 1.4 condenser containing a turret for selecting matching phase annulus or DIC Nomarski prism and a polarizer for DIC. For the highest-resolution work, immersion oil must be used with the condenser as well as the objective. For lower-resolution work and magnification, we have also found the Nikon Fluar 20X/NA = 0.6 and 40X/NA = 1.3 to be very useful lenses. The Fluar lenses have better transmission efficiency, at 360 nm, in comparison to the PlanApochromat lenses, so they are better for photoactivation experiments.
2. Magnification
The magnification changer is an important feature of the imaging path because the camera is fixed in position at the primary image plane above the objective, and different specimens often require different magnifications. It provides 1.0, 1.25, 1.5, and 2.0 × selectable intermediate magnifications to the camera detector. The body tube above the objective provides additional magnification of 1.25×. Therefore, for the 60X objective, the final possible magnifications to the detector are 75, 93.75, 112.5, and 150×.
How much magnification is necessary so that resolution is not limited by the pixel size of the cooled CCD detector? As discussed below, the Hamamatsu cooled CCD detector uses a chip with a pixel size of 12 × 12 μm. To resolve two adjacent specimen points as distinct points, their images at the detector must be at least two pixel elements apart, or 24 μm (Fig. 4). With the specimen points separated by three pixel elements, or 36 μm, the problem of aliasing (Inoué and Spring, 1997) is avoided. The diffraction limited lateral resolution, r, of two adjacent points in the specimen for the Nikon 60X/NA = 1.4 objective is about:
| (2) |
for λ = 550 nm green light. The magnifications needed so that 0.24 μm in the specimen is magnified to 24 or 36 μm on the detector is 24/.24 = 100 × or 36/.24 = 150×. Thus, for resolution limited by the objective and not the detector we must use at least the 1.5× setting of the magnification changer and the 2× setting for the best resolution. Magnifications less than 100× produces brighter images as predicted by Eq. (1), but resolution in these images is limited by the resolution of the detector.
Fig. 4.
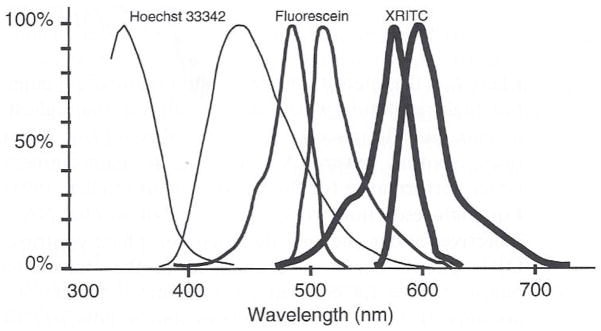
Excitation and emission spectra for the blue, green, and red fluorophores we commonly use. The excitation and emission spectra for S65TGFP is similar to the fluorescein spectrum and we have had great success using the multiband pass filter (Fig. 5) and the fluorescein excitation filter.
3. Determining Focus
We have found that an effective way to focus the specimen image on the camera is with dark-adapted eyes. Adjustments are available on the FXA microscope so that the oculars can be made parfocal with the camera. During an experiment, the specimen is viewed by eye and quickly brought into focus. Then the light is switched to the camera for recording. The Hamamatsu C4880 camera has a fast-scan mode that can produce displayed video images as fast as 10 Hz. We have also used this camera feature for achieving focus, but for most situations, we have found that achieving focus with the dark-adapted eye is quicker than switching the camera’s mode of operation back and forth between the fast-scan mode of focusing and the slow-scan mode for image recording.
4. Phase Contrast
When phase images are recorded along with fluorescent images, we use the phase objective and the matching phase annulus on the condenser turret. The DIC objective Nomarski prism and the DIC analyzers are removed from the imaging path. The phase ring in the back aperture of the objective produces some loss of fluorescent image brightness, but it has not proven significant.
5. DIC and the Analyzer Filter Wheel
For DIC, a Normarski prism is inserted just above the objective, and the condenser turret is switched to the Nomarski prism that matches the objective. The Nikon polarizer beneath the condenser uses high-transmission (35%) Polaroid materials mounted between optical glass flats.
For focusing by eye, a high-transmission DIC analyzer is slid temporarily into the light just above the objective Normarski prism. For the best DIC image contrast, the bias retardation of the objective Nomarski prism is typically adjusted to about 1/15th to 1/10th the wavelength of light (see Salmon et al., 1998) by the following procedure. First, the prism is adjusted to extinguish the background light. Then it is translated further, brightening the background and making one side of the structure of interest maximally dark. At this position, this side of the structure will be darker than the background whereas the other side of the structure will be brighter than the background, producing the “shadowed” appearance of the DIC image (Fig. 3).
For DIC image recording, the focusing analyzer is removed from the light path. A filter wheel just beneath the camera (Fig. 2) is used to insert a high-transmission DIC analyzer into the light path. For fluorescence imaging, the filter wheel is rotated to an adjacent position that contains an optical glass flat of equivalent optical thickness to the analyzer. The Ludl filter wheel was chosen in part because it was sufficiently thin to fit between the top of the microscope and the camera without changing the position of focus of the primary image on the detector. It was also selected because it can change filter positions without inducing noticeable vibration of the objective. This filter wheel is relatively slow, requiring about 1 second to change filter positions; a time that has not proven a problem for our applications. Finally, the filter wheel is rotated by a stepping motor. There are 4000 steps between adjacent filter positions, and the ability of the filter wheel to repeatedly bring the analyzer back to the exact same position (crossed with the polarizer) is excellent.
B. Epiillumination Optics
There are a number of important features of the epiillumination pathway for our multimode microscope, including the mercury lamp housing, dual filter wheel, condenser, condenser diaphragm, field stop (diaphragm or slit), optical flat slider, and filter cubes.
1. Mercury Lamp and Housing
The lamp housing contains a mirror in the back so that both the direct light from the arc and the reflected light from the mirror pass through the lamp collector lens and become projected into the objective aperture by the epiillumination optics. The mirror image helps obtain a more intense and even illumination of the objective aperture.
2. Heat Reflection Filter
This filter prevents harmful infrared light from heating the shutters, filters, or the specimen. Many conventional fluorescence filter sets do not block infrared light, which shows up as a hot spot on cameras though it is invisible to the eye.
3. Köhler Illumination
Nikon has a mirror within an objective mount that can be used for focusing and aligning the images of the arc lamp centered and in focus at the position of the objective back aperture. This is the procedure for Köhler illumination, the alignment that gives the most even illumination of the specimen. See the microscope manual for detailed alignment procedures.
4. Dual Filter Wheel and Epishutter
There are two eight-position filter wheels mounted near the lamp collector lens where the illumination light is out of focus. The wheels hold 1-inch-diameter filters. The filter wheel assembly includes a 1-inch electronic shutter. The sides of the blades facing the lamp are silvered to reflect the light when the shutter is closed and to prevent overheating of the shutter mechanism. The filter wheel position and the shutter are under computer control.
The first wheel has a series of neutral density filters including 0, 0.3, 0.5, 1.0, 1.3, 2.0, 2.3, and 3.0 O.D. The second filter wheel has one open position, and the rest contain a series of band-pass filters. The open position is used with conventional filter cubes. Three of the band-pass filters are excitation filters used to excite the blue, green, and red fluorophores (Fig. 4) through a multiple band-pass dichromatic filter cube (Fig. 5). These have central wavelengths of 360, 480, and 570 nm. Other filter positions contain filters for 340, 408, and 546 nm.
Fig. 5.

The quantum efficiency of the TC-215 CCD chip in the Hamamatsu C4880 camera compared to the spectra of the Chroma excitation filters, multiple band pass dichromatic mirror, and multiple band pass emission filter. For the filters, the y-axis is percentage transmission. The thin line in the curves for the three-pass dichromatic mirror is produced by a coating on the backside for reflecting 360-nm excitation light.
5. Condenser Diaphragm
The epiillumination condenser diaphragm is often useful for making manual “on-the-fly” adjustments of illumination intensity. Closing this diaphragm can reduce illumination intensity by about 1 O.D.
6. Field Stops
We use two field stops. One is a diaphragm that is used during fluorescence imaging to restrict the field of illumination to only the region of interest. As this diaphragm is closed down, the amount of fluorescent scattered light from the specimen decreases, which can significantly enhance the contrast in fluorescence images. Thus, we take care to adjust this diaphragm for each specimen.
The other field stop that can be exchanged easily for the diaphragm is a strip of slits and spots that we use for fluorescence photoactivation. There are translation screws for centering the position of the field stops.
7. Correction for Longitudinal Chromatic Aberration
Between the field stop and the filter cube holder is a slider for 1.5-cm filters. For fluorescence imaging we use an open position. For photoactivation at 360 nm, we insert a 3-mm-thick optical glass flat to make the 360-nm excitation light image of the field spot or slit parfocal with the green or red light images we use for focusing the slit on the specimen, as described in the following photoactivation section.
8. Filter Cube Turret
The Nikon FXA epiilluminator has four positions for filter cubes. These filters must be rotated into position by hand. We usually leave one of these positions open for the highest- resolution DIC imaging when fluorescence images are not required. We use conventional filter cubes, or specialized cubes, in the other positions.
We initially tried to use a motor-controlled filter turret to select different filters. However, when different filter cubes were used, they had slightly different optical properties (tilted optical elements, nonparallel surfaces, etc.) so that the different-colored images were deflected to different positions on the CCD detector. Their alignment was often not repeatable each time a particular filter was rotated into place. Taylor and colleagues have had better repeatable position accuracy using a linear filter slider (Farkas et al., 1993; Taylor et al., 1992); however, this does not eliminate the problem of image registration on the detector.
9. Multiple Band-Pass Dichromatic Mirror and Emission Filter
This problem was solved by using a multiple band-pass dichromatic mirror and emission filter set manufactured by Chroma similar to one described by Sawin et al. (1992). In combination with the appropriate excitation filters, these have excitation and emission spectra similar to DAPI or Hoescht DNA intercalating dyes (360 ex/450 em), fluorescein and GFP (480 ex/510–530 em), and X-rhodamine (570 ex/620–650 em) (Fig. 5). This has been an important filter cube for our work because the image for the three different fluorophores project to the same focus on the detector. This is because they all use the same dichromatic mirror and emission filter.
Another important aspect of the Chroma filter set is the high transmission efficiency within each bandpass (Fig. 5). This is important for maximizing sensitivity and minimizing the effects of photobleaching and photodamage. The same principle applies to the selection of any filter cube for live-cell experiments.
C. Transillumination Optics
1. Quartz-Halogen Lamp and Housing
The 100-watt quartz-halogen lamp is mounted in a housing that contains a rear mirror. The combination of the primary filament image with the mirror filament image produces more even illumination of the condenser aperture than occurs for the primary image of the filament alone.
2. Heat-Reflecting Filter
As described for the epiillumination pathway, it is important to remove infrared light from the illumination beam. A 1.5-inch-diameter heat-reflecting filter is inserted in front of the lamp collector lens.
3. Thermal Isolation
We initially had considerable trouble with the stage drifting downward over time. Stage drift is a significant problem in time-lapse recording because the specimen continually goes out of focus. Stage drift was reduced substantially for the FXA stand by isolating the heat of the lamp from the base of the stand using a ceramic connector between the lamp housing and the base of the microscope stand.
4. Köhler Illumination and the Ground-Glass Diffuser
To achieve the highest resolution in DIC, it is essential that the objective aperture be uniformly illuminated (Inoué, 1989; Inoué and Oldenbourg, 1993), and the procedures outlined below are designed to achieve that goal:
Initially, the slide is oiled to the condenser (without air bubbles) and viewed with a low-power (10× or 20×) objective.
The condenser focus and horizontal position screws are adjusted so that the image of the field diaphragm in the transillumination light path is in focus and centered on the specimen when the specimen is in focus to the eye.
The objective is moved away and a small drop of oil (without air bubbles) is placed on the coverslip.
The 60X objective is rotated into place. The specimen is focused and the centration of focus of the field diaphragm readjusted. For best contrast, the field diaphragm should be closed till it just surrounds the specimen of interest.
The telescope (Bertrand lens) in the magnification changer is then used to focus on the objective back aperture. In that position the condenser diaphragm plane is also in focus. The condenser diaphragm is opened all the way, the ground-glass diffuser is removed from the light path, and the position controls for the bulb and the mirror are adjusted so that the primary and mirror filament images sit side by side in focus at the condenser diaphragm plane. The condenser diaphragm is adjusted to just be visible at the periphery of the objective aperture.
The ground-glass diffuser is then placed in the light path to produce more uniform illumination of the 1.4-NA condenser aperture.
5. Band-Pass Filters
The base of the FXA stand contains a filter changer. For live-cell illumination we use a wide-band (40-nm) green 546-nm band-pass filter.
6. Transshutter
Transillumination of the specimen is controlled by a 1-inch Vincent electronic shutter that is under computer control. The shutter sits on top of the base of the microscope underneath the condenser carrier.
D. Focus Control
Z-axis focus is controlled by a Ludl stepping motor attachment to the fine-focus knob. Coarse focus can be done by hand using the inner focus ring on the microscope. The stepping motor has a manual focus knob with three sensitivity positions: coarse, medium, and fine. The sensitivity is selected with a toggle switch on the knob box. We use the coarse setting for focusing at low magnification and the fine setting for focusing at the highest resolution.
During image recording, focus can be controlled by the computer system to yield a stack of images at equal z-axis steps through the specimen (0.1-μm steps are possible, but we typically use either 0.5- or 1-μm intervals).
We also use the stepping motor to correct for the shift in focus as the stage drifts. Often stage drift occurs at a uniform rate in one direction. During time-lapse recordings, focus is stepped at each recording interval to compensate for the stage drift.
E. Vibration Isolation
To prevent vibration from destroying image fine structural detail, the FXA microscope is mounted on a Newport vibration isolation table (Fig. 1). An attractive feature of this table is that it provides arm rests and shelves for computer monitors and other equipment, which are supported independent of the air table.
IV. Cooled CCD Camera
A. Camera Features
Our current camera is a Hamamatsu C4880 dual mode cooled CCD. The CCD detector is a rectilinear array of photodetectors (photodiodes) deposited on a silicon substrate. When the shutter is opened, incoming photons at each photodiode are converted to electrons that are accumulated in potential wells created by an electrode array on the surface of the chip. Thermal motion also knocks electrons into the potential well, and the C4880 is cooled by a Peltier device to about −30°C to reduce “thermal noise.” At the end of a light exposure, the shutter is closed. The C4880 camera uses a Texas Instrument TC-215 CCD chip, which has a 1024 × 1024-pixel array in which each pixel element is 12 × 12 μm in size. The well capacity is 60,000 electrons; beyond this number, the electrons will flow into adjacent wells. CCD detectors are graded for quality and defects. A grade 1 chip like the one in the C4880 camera has few defective pixel elements and few “hot pixels.”
Both photons and thermally accumulated electrons in the rows and columns of the CCD array are “read out” by a combination of parallel and serial transfers of charge to a readout amplifier and analog-to-digital (AD) converter. The C4880 uses two readout amplifiers to increase readout speed. “Readout noise” depends on rate; the slower the better, and the C4880 uses a 500-KHz rate to readout pixel values in its precision slow-scan mode. The C4880 also has a fast-scan mode (7 frames/second), which is much (about 5×) noisier but is useful for imaging brighter light sources and for focusing.
The C4880 is not a conventional video-rate camera equipped with a Peltier cooler. Video-rate CCD chips readout at 30 frames/second, and the CCD chips are constructed differently from full-frame, slow-scan CCD chips like the TC-215 in the C4880 camera (CLMIB staff, 1995; Inoué and Spring, 1997; Shaw et al., 1995).
We use the slow-scan mode of the C4880 for most of our applications, and several significant features of its operation are described in more depth next. Details on the construction and properties of CCD chip cameras, including the various ways of obtaining images from slow-scan CCDs, are available elsewhere (Aikens et al., 1989; Inoué and Spring, 1997).
B. Quantum Efficiency
Quantum efficiency measures the percentage of incident photons that yield measurable photoelectrons in a pixel well. Quantum efficiency depends on wavelengths, as shown in Figs. 5 and 6D. The TC-215 chip has a peak quantum efficiency of 55% at 650 nm, the emission wavelength for the X-rhodamine fluorescence for our labeled microtubules in living cells. At 510 nm, the emission wavelengths for fluorescein and GFP, the quantum efficiency is about 35%. In general, CCD chips are more quantum efficient toward red and infrared wavelengths and significantly less toward the blue and violet wavelengths (Fig. 6D). Our chip has been coated with a fluorophore, which enhances the sensitivity in the blue-to-ultraviolet region of the spectrum (Fig. 6D).
Fig. 6.

Performance of the C4880 cooled camera with TC-215 CCD. (A) Measured linearity where 1 gray-level count equals 5 electrons read from the CCD. Light intensity was held constant, and integration time (sec) varied. (B) Measured average values of “dark” gray-level verses integration time (seconds) when the camera shutter is closed. The offset in converting electrons to gray-level is the intercept at zero time. (C) Measured values for camera noise obtained from the standard deviations (SDs) of the dark signal versus integration time (open diamonds) and the SD after pairs of images taken for the same time were subtracted from each other to remove the “hot pixel” contributions (open squares). (D) Comparison of the quantum efficiency of the TC-215 CCD to other types of detectors. Data taken from manufacturer’s specifications.
The quantum efficiency of the TC-215 CCD is 1.5 to 2 times better than most slow-scan, full-frame readout CCDs in the visible wavelengths and much better than conventional interline video-rate CCD cameras (Fig. 6D). In full-frame readout CCD arrays such as the T1215, the potential wells are illuminated through the metal electrode array, which reduces the quantum efficiency. Back-thinned, rear-illuminated CCD chips are much harder to manufacture, but they have become available for almost reasonable prices. These chips can have quantum efficiencies as high as 80% (Fig. 6D).
Video-rate CCD cameras that allow “on-chip integration” are very economical ($800–$2000) and useful for bright fluorescence applications like immunofluorescence, as reviewed by Shaw et al. (1995). Compared to the full-frame readout chips, the quantum efficiency of conventional interline transfer chips is poor (15% peak) in part because half of the chip is masked (Fig. 6D). Sony has developed more sensitive chips by fabricating microlenses over each pixel element that collect light hitting the masked regions and direct it into a pixel element. This technique was developed for the “hyperhad” or HAD (hole accumulation diode) video-rate CCD chips by Sony. The quantum efficiency is still only 30%) for most of these chips, and the readout noise is much higher than slow-scan, cooled CCD chips. A new Sony HAD chip exhibits 55% quantum efficiency near 510 nm (HAD ICX-061 in Fig. 6D), the peak emission wavelength for GFP fluorescence imaging. For longer-wavelength probes, these chips are much less sensitive than the conventional full-frame transfer chips. Because it is an interline chip, the Sony supports video or near-video readout rates and does not need a shutter. The pixel detectors are about 9 μm in size with a well capacity of 15,000 electrons. The readout and thermal noise are remarkably low and comparable to the high-quality slow-scan full-frame transfer devices. Hence, the gap between slow-scan “scientific-grade” cameras and more commercial-grade videorate cameras continues to narrow.
C. Readout
The C4880 has two readout modes: slow scan and fast scan. In either mode, a shutter is used to control light exposure to the CCD chip. We mainly use the slow-scan mode because it has much better signal-to-noise and higher dynamic range (4096 versus 1024 gray levels). Potentially, the fast-scan mode is useful for focusing, as it can run as fast as 10 frames/second. In practice, however, we have found it easier to focus using the dark-adapted eye as described earlier. The following describes the operation of the camera in the slow-scan mode.
1. AD Conversion
The number of accumulated electrons generates a voltage that is scaled and converted into a digital signal. The analog-to-digital converter is 12 bits or 4096 gray levels, and the pixel value is transferred and stored in the computer as a 16-bit or 2-byte (1 byte = 8 bits) value. There are three gain factors (GFs) selectable with this camera. One gray level equals 25, 5, and 1 accumulated electrons at low, high, and super-high values of GF, respectively. We use the high gain setting normally because 5 × 4096 = 20,480, about a third of the full-well capacity for the TI-215 detector.
2. Transfer Time
It takes about 4.5 seconds after the chip is exposed to transfer a 1024 × 1024-pixel image into the computer display. About 4 seconds is the time of the slow-scan readout from the chip at a rate of 500,000 bytes/sec. The other 0.5 seconds is the time required to move the image from the frame buffer in the Imaging Technology AFG card in the computer to the computer’s own RAM memory. This later delay can now be greatly eliminated using PCI bus adapter cards. Transfer time can be substantially shortened by reducing image size, now the time needed depends on the number of pixels in the image.
3. Size
In most of our applications, we do not need the full-chip image. The time taken for image acquisition depends on the size of the image transferred, and this time can be substantially reduced by transferring a smaller region of the chip. For example, we often use a 300 × 300-pixel image size in our mitosis studies. The total number of pixels for these images is about 1/10th the number for the full chip, and the rate of transfer is proportionately faster.
The other big advantage of smaller-sized images is that they take less memory in RAM or disk recording. For example, a 300 × 300-pixel image requires 1/10th the storage capacity as the full-chip image. We often record 500 images or more in time lapse. A 300 × 300-pixel image requires 90,000 pixels × 2 bytes = 0.18 M bytes of memory or disk space. A full-chip image requires 1,048,576 pixels × 2 bytes = 2.1 M bytes of storage, 23 times more than the 300 × 300-pixel image.
4. Binning
During readout, the C4880 camera controller can combine adjacent pixel values into one value. This “binning” increases the sensitivity of the camera and reduces the image size in proportion to the number of binned pixels. Binning of 2 × 2, 4 × 4, or 8 × 8 produces increases in sensitivity and reduces image size by factors of 4-, 16-, or 64-fold, respectively. The enhanced sensitivity is shown in Fig. 7 for a field of immunofluorescently stained microtubules, where the excitation light intensity is reduced by insertion of neutral density filters as binning is increased. Note that binning also reduces resolution in proportion to the binned pixels in each direction. We often use 2 × 2 or 4 × 4 binning in our fluorescence applications where resolution is limited not by optical limitations, but by too few photons. The 4- or 16-fold gain in sensitivity by binning can make substantial improvements in image quality.
Fig. 7.

Binning increases sensitivity, reduces image size, and reduces resolution. Images of a field of microtubules in a cell fixed and stained with fluorescent antibodies to tubulin. Images were taken with N x N binning at constant integration time and excitation light intensity. Image brightness increased as N2. The final images were scaled to the same maximum brightness in the print.
D. Linearity, Noise Sources, and the Advantages of Cooling
CCD detectors are ideal for quantitative two-dimensional intensity measurements and position measurements because the signal (S) for each pixel is proportional to light intensity over a wide range and there is no geometrical distortion. Fig. 6A shows the output linearity of the C4880 camera measured for a region of a fluorescent specimen in which the light intensity was held constant, but the exposure time was varied from 20 ms to 5 seconds.
Essentially, the CCD detector is a geometrical array of pixel detectors, where the pixel gray-level value (0–4096 gray levels for 12-bit digitization) acquired by the computer, Pi,j, for a single readout of the chip is:
| (3) |
where Ii,j is the light intensity, Qi,j is the quantum efficiency, NTi,j is the thermally generated electrons/second, t is the exposure time, NRi,j is the electron equivalent error in the readout process, and GF is the gain factor in the conversion of accumulated electrons to gray level.
Thermal noise NT is usually specified as the number of electrons per second at a given temperature. This number decreases by about 50% for each 8° of cooling (Fig. 8). So, for example, if a detector element accumulates 400 thermal electrons/second at 20°C (about room temperature), there will be only 6 at −28°C. Our C4880 camera has a specified average value of NT = .1 electrons/pixel/per second at −40°C (Fig. 6B). Some pixel elements on the chip are much worse than most, and these are termed “hot” pixels. For a chip cooled to −30°C these hot pixels only become apparent for exposures longer than several seconds, as seen in Fig. 8. For uncooled chips, these hot pixels are not apparent at video rates (1/30-second exposures), but they can become very apparent even for exposures of .1 to 1 second (Shaw et al., 1995). The new HAD Sony chips, however, have remarkably low thermal noise and few hot pixels.
Fig. 8.
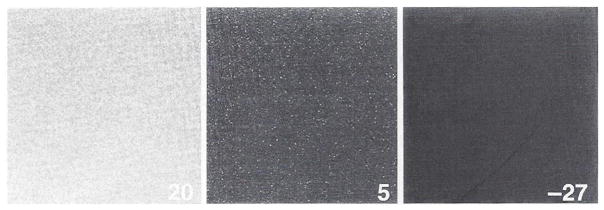
Dark images from the C4880 camera as a function of temperature of the CCD chip. Exposures were for 5 seconds, and temperature in degrees centigrade is indicated on each frame.
The other major source of noise is readout noise, NR. Unlike the photon and thermal noise, it does not depend on integration time, but occurs once when the chip is readout to the computer. NR depends on how fast and on the way readout is achieved (Aikens et al., 1989; Inoué and Spring, 1997).
We measured the thermal and readout noises by measuring the standard deviations (SDs) of “dark” images obtained by capping the camera and recording for durations between 20 ms to 40 second when the camera was cooled to −30°C (Fig. 6B). Both thermal and readout noise are governed by random number statistics, where SD is a measure of their noise contributions. For exposures less than 5 seconds, readout noise dominates (Fig. 6C). Readout noise is constant, independent of exposure time, at NR = 2.6 gray levels or 5 (electrons per gray level) x 2.6 = 11.3 electrons. Thermal noise increases with exposure time and begins to be more significant than readout noise for exposures longer than 5 seconds, mainly because of the “hot pixels.”
E. Dark and Background Reference Image Subtraction
The average values of the contributions of thermal and readout noise can be subtracted from a specimen image by subtracting a “dark” reference image. The dark reference image is obtained by blocking light to the camera for the same exposure time t used for the specimen image, and their difference is given from Eq. (3) by:
| (4) |
where ΔNTi,j and ΔNRi,j represent the random noise in the thermal and readout contributions. For bright specimens, these noise values are small and insignificant. For low-intensity specimens near the “noise floor” of the camera, these values are significant and generate poor image quality and large uncertainty in image measurements. Dark image subtraction reduces substantially the dark image noise from hot pixels (Fig. 6C), and this subtraction is essential for good image quality for weakly fluorescent specimens.
There are other sources of noise from the microscope, including out-of-focus fluorescence, reflections from the coverslip and optical components, and fluorescence from the optical components. The average values of these contributions to the specimen image can be subtracted out by obtaining a “reference” image from a region of the slide lacking the specimen or by focusing up or down so the specimen is out of focus.
F. Shading
Quantum efficiency is remarkably constant between different pixel elements for the highest-quality CCD chips and does not have to be corrected except in the most critical applications. Variation in sensitivity between different pixels is termed “shading.” This shading can be corrected for any signal by multiplying each pixel value with a scaling factor (SFi,j). SFi,j is obtained by acquiring a bright image (B) with constant light intensity (I) across the detector and acquiring a dark image (D) with the shutter closed on the camera. In the computer, the average values for all the pixels in the bright image (Bavg) and the dark image (Davg) are calculated, and the scale factor for each pixel (SFi,j) is obtained from the ratio
| (5) |
G. Signal-to-Noise
The ratio of signal (S) to noise (N) is a measure of image quality, and the reciprocal (N/S) represents the uncertainly in making an image measurement. After background subtraction and shading correction, the ability to see image detail and the uncertainty of intensity measurement depends on random sources of noise in the integrated signal (Ii,j Qi,j t) as well as from thermal noise (ΔNT) and readout noise (ΔNR). Noise in the specimen signal (called photon noise or shot noise) depends on random-number statistics just as do the other sources of noise in the camera. For S photon-produced electrons, the SD (ΔS) is a measure of the noise of S, just as the SDs are a measure of thermal and readout noise. For example, if the other sources of noise are neglected and the average number of signal electrons recorded for one pixel is 100, then the ΔS is the square root of 100, or 10. S/N = 10, and the uncertainty in measurement = 10%. There is a 63% chance of measuring S ± square root of S electrons in a subsequent measurement made the same way.
In general, the more photoelectrons accumulated by photon absorption by silicon in the CCD chip the better the image quality. This is shown in Fig. 9. An image of a fluorescent specimen was acquired for 20-, 200-, and 2000-ms exposure time at constant illumination intensity then scaled to the same peak brightness for printing. At 20-ms exposure, the image is very “grainy,” and the fluorescent actin filament bundles in the cell are indistinct and poorly resolved because of too few photons. The image is much better at 200 ms and beautiful at 2 seconds. Quantitatively, signal-to-noise in the camera is given by:
| (6) |
Fig. 9.
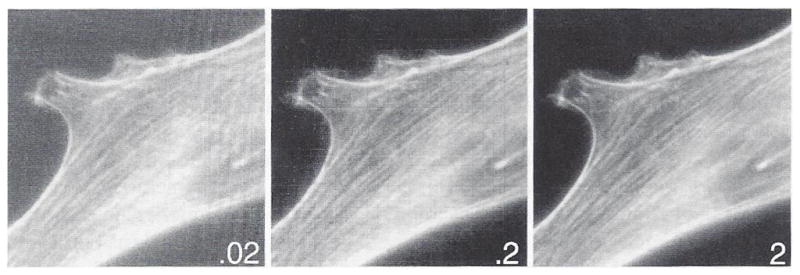
Images of actin filaments in a cell that was fixed and stained with rhodamine-labeled phaloidin, taken at the same illumination light intensity but different integration times, as indicated in seconds on each frame. Too few photons makes a noisy image.
Note from Fig. 6B that at short exposure times (less than 2 seconds), thermal noise is insignificant in the C4880 camera and image quality is determined by photon statistics and readout noise.
V. Digital Imaging System
A. Microscope Automation and Camera Control
I. Computer Control of the Microscope
Essential to using the multimode microscope system is a flexible software package that allows control of the microscope components. Commercial software packages operating on Windows, Macintosh, and UNIX platforms are now available. We have selected the MetaMorph software package from Universal Imaging Corporation running under Windows95 for the majority of our image acquisition and processing. Figure 2 details the hardware components that run the software to control the illumination, focus, and camera.
The software contains instructions (drivers) for controlling auxiliary devices attached to the microscope. As an example, a driver within MetaMorph controls the dual eight-position filter wheels containing O.D. and fluorescence excitation filters. An excitation wavelength and light intensity can be selected from a pull-down menu for a dim rhodamine-labeled specimen and a second set of filters chosen for brighter DAPI staining. The two sets of selections are saved as preset filter combinations and are automatically selected during time-lapse experiments when rhodamine and DAPI images are taken sequentially. In addition to filter wheels, the MetaMorph software contains drivers for controlling the focusing motor, epi- and transillumination shutters, and output to devices such as an optical memory disk recorder.
The MetaMorph camera driver allows us to take advantage of several properties specific to the Hamamatsu C4880 CCD camera. The time of exposure, area of CCD chip readout, binning of pixels, and camera gain and offset can all be saved as a preset file. Having these variables saved affords us the ability to obtain images of a specimen brightly illuminated for DIC or dimly illuminated for fluorescence without manually reconfiguring the camera.
Critical to our use of the software is a scripting language (or journaling) for customized control of the parameters, sequence, and timing of image acquisition. Journals are a sequence of instructions to the MetaMorph imaging software generated by recording a sequence of selections from the program menus. For example, to take phase contrast, DAPI, and rhodamine images of the same spindle in time lapse, journals are recorded that control image acquisition for each optical mode. For phase contrast, the transmitted shutter is opened and the CCD camera instructed to open its shutter for 600 ms, close the camera shutter, and then transfer the 12-bit image to computer memory. Similarly, journals are written to control image acquisition for DAPI and rhodamine epifluorescence that specify the exposure time of the camera, the neutral density filter, the excitation filter, and the opening and closing of the epifluorescence light shutter. A time-lapse journal then calls the phase contrast, DAPI, and rhodamine journals in sequence at a specified time interval.
2. Image Processing and Analysis
In addition to automated control of the microscope, the software contains routines for manipulating the size, scale, and contrast of images and allows handling of multiimage stacks. Image stacks are created in circumstances such as multimode time-lapse experiments where all DAPI images in a series remain in the DAPI stack and all rhodamine or DIC images remain in their respective stack. The ability to perform contrast enhancements or arithmetic (such as background image subtraction) on all images in a stack rather than performing the function on each image individually saves tremendous amounts of labor. Our camera and digital-to-analog converter generate images with greater than 4000 gray levels (12 bits). The MetaMorph software has tools for linear and nonlinear modification of image contrast as well as scaling from 12 bits to 10- or 8-bit images. The contrast enhancement allows presentation of very bright specimen information in the same image as very dim information, as is often the case when microtubules in a spindle are shown next to astral microtubules (Fig. 3E).
The software has excellent routines for creating 24-bit RGB image stacks and for overlaying fluorescent colors onto grayscale DIC or phase-contrast images. For example, an RGB stack can be easily obtained from three stacks taken in a time-lapse series where one stack is the rhodamine image, another a fluorescein or GFP image, and the third a DAPI or DIC or phase-contrast image. Separate gain and contrast adjustment controls are available for each channel of the RGB image. The RGB image stack can be treated like any other image stack and displayed by a movie player.
Many of our experiments require quantitative analysis of images for relative fluorescence intensity or for motion. Analysis is helped tremendously by the use of calibration files. The MetaMorph software package contains routines for saving distance measurements, made from images of a stage micrometer, and intensity measurements from florescence standards. These measurements can be called on to provide calibrated values instantly. The time and date of image acquisition are contained in the header of all MetaMorph image files, allowing accurate rates to be calculated from distance measurements of time-lapsed images. The ability to couple image processing with analysis greatly increases the quantity and variety of measurements available. The journaling language described above for automating image acquisition can also be applied to image-processing routines to automatically link repetitive processes.
B. Other Useful Software and Devices
We have found several other software packages useful for image presentation and production of movies. These include Adobe Photoshop for making complicated montages of images generated in MetaMorph and saved as TIFF-formatted files and Adobe Premiere for making digital movies in .mov or .avi file formats. For making slides and labeling prints, images are copied into Microsoft Power-Point, where lettering and annotation of images is convenient. Black-and-white draft prints of images are obtained with a Hewlett Packard Laser Jet 4M printer, and photographic-quality prints are generated with a Tektronics Phaser SDXII Dye Sublimation printer. Other ways of image processing and presentation are described by Shaw et al. (1995) in a paper concerning a low-cost method of digital photography using NIH-Image software and a Macintosh computer.
VI. Example Applications
A. DE-DIC
Our DE-DIC images are recorded typically with 600-ms on-chip integration. The standard test specimen for high resolution in the light microscope is the frustrule pore lattice of the diatom Amphipleura. These pores in the silica shell are aligned with about 0.19-μm separation along rows and 0.25-μm separation between rows. As seen in Fig. 3C, the rows of pores are clearly resolved by our DE-DIC system, and the individual pores are almost resolvable with green light illumination. A major advantage of this system for living cells is the low illumination intensity and the computer control of shutter, which illuminates the specimen only during camera exposure. As a result, cells are viable for long periods of time-lapse recording.
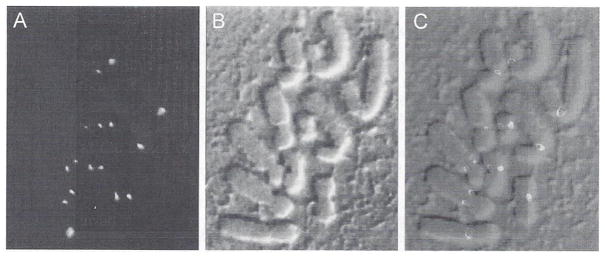
Using this system we have obtained high-resolution real-time images of yeast nuclear motion in the cell division cycle. In one series of experiments (Salmon et al., 1994), GFP histones were expressed to visualize the nucleus (Fig. 3A) and cellular structural detail recorded by DIC (Fig. 3B). The native GFP fluorescence excited at 490 nm was photoactivated using a several-second pulse of 360-nm light, then images were recorded using the fluorescein channel and excitation filter. In other studies (Yang et al., 1997; Yeh et al., 1995), we discovered that the cooled CCD camera produces high-contrast and high-resolution DE-DIC images, such that the positions of the spindle pole bodies and the anaphase elongation of the mitotic spindle within the 2-μm diameter preanaphase nucleus can be clearly seen (Fig. 10). To achieve the images shown in Fig. 10, it is necessary to reduce the refractive index mismatch between the cell wall and the media. This is achieved by embedding the cells in 25% gelatin-containing LPD yeast growth medium (Yeh et al., 1995). Slides are prepared with a 10-μm-thin film of the 25% gelatin, a 5-μL drop of cell suspension is added, a number 1.5 22 × 22-mm coverslip is pressed down on the preparation, and the preparations are then sealed with VALAP (1:1:1 vasoline, lanolin, and paraffin).
Fig. 10.

DE-DIC images of a dividing yeast Saccharomyces cerevisiae. The spindle extends through the center of the nucleus and is formed from an overlapping bundle of microtubules extending from opposite spindle pole bodies (arrows). (A) Preanaphase. (B–K) Anaphase. (L) Cytokines. The preanaphase nucleuse in A is about 2.5 μm in diameter. Modified from Yeh et al. (1995).
B. Multimode Imaging of Anaphase In Vitro
The multimode microscope system has also been particularly useful for recording anaphase spindle dynamics and chromosome segregation for the first time in vitro (Murray et al., 1996; Salmon et al., 1994) by reconstituting mitosis in a test tube from sperm nuclei and cytoplasmic extracts prepared from Xenopus eggs (Holloway et al., 1993; Shamu and Murray, 1992) (Fig. 3D–F). Here phase DAPI fluorescence image stacks record chromosome movements while X-rhodamine-labeled tubulin fluorescence shows spindle microtubule assembly dynamics. The spindles in cytoplasmic extracts are held in a chamber between a slide and a coverslip separated by 12-μm latex beads and sealed with halocarbon oil and VALAP. For time lapse, sequential 600-ms exposures of rhodamine and DAPI or phase images are recorded to their respective image stacks at either 30- or 60-second intervals. The Xenopus egg cytoplasm is very optically dense, making the rhodamine and DAPI fluorescent images the most useful for recording spindle and chromosome dynamics. Three-dimensional images derived from a single time-point stack of optical sections have also proved very useful for determining the behavior of all of the chromosomes and their kinetochore regions within the spindle (Murray et al., 1996; Salmon et al., 1994) (Fig. 3G). Figure 11 shows frames from an RGB digital movie of in vitro anaphase in which the DAPI blue chromosome images are overlaid on the rhodamine tubulin red image of the spindle microtubules (Murray et al., 1996).
Fig. 11.
Anaphase recorded for mitotic spindles assembled in the test tube from Xenopus egg extracts as described (Murray et al., 1996). At 30-second intervals, an X-rhodamine-tubulin image and a DA PI-stained chromosome image were recorded. Red and blue image stacks were overlaid with MetaMorph and printed in Adobe Photoshop. Time in minutes is indicated on each frame taken from the time-lapse sequence. (See Plate 9 in the color insert section.)
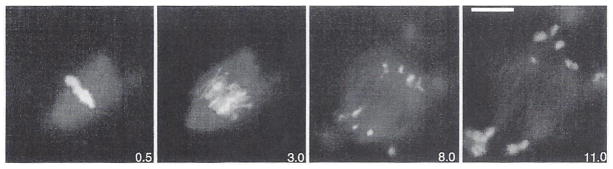
C. Fluorescence Photoactivation
Another application of our multimode system has been in the analysis of the dynamics of kinetochore microtubules within mitotic tissue cells using fluorescence photoactivation methods (Mitchison and Salmon, 1993; Waters et al., 1996). Figure 12 shows a metaphase newt lung epithelial cell that has been microinjected with X-rhodamine-labeled tubulin to label all the spindle microtubules and C2CF caged-fluorescein-labeled tubulin for photoactivation of tubulins within the spindle fiber microtubules as developed by Mitchison (1989). For photoactivation, the field diaphragm in the epiilluminator is replaced with a 25-μm slit cemented to a Nikon pinhole slider (Fig. 2). The spindle is marked with 350-nm illumination for 2 seconds using the Chroma DAPI exciter filter within the excitation filter wheel and no neutral density filters. Image stacks for rhodamine, fluorescein, and phase are acquired at 30-second intervals. The exposures are 600 ms, using two OD-neutral filters in front of the 100-watt Hg lamp and using a 2 × 2-pixel binning of pixels in the Hamamatsu Cooled CCD detector. The 2×2-pixel binning reduces the 300 × 300 central image capture area to 150 × 150 pixels and increases image sensitivity fourfold. This has proven to be important in allowing lower excitation light intensity, which reduces photobleaching and has not significantly reduced useful resolution in these low-light-level images. The images in Fig. 12 show that photoactivated marks on the kinetochore fibers flux poleward, demonstrating that at metaphase, the kinetochore microtubules that connect the chromosomes to the poles have a net addition of tubulin subunits at their kinetochore ends and a net disassembly of subunits at their polar ends. In anaphase, this poleward flux of kinetochore microtubules persists as chromosomes move poleward (Mitchison and Salmon, 1993; Waters et al., 1996; Zhai et al., 1995). Photoactivation has also been used to show that poleward flux of spindle microtubules occurs in other cell types (Sawin and Mitchison, 1991). This has important implications for how kinetochore microtubule dynamics are coupled to force generation-for-chromosome movement and proper alignment of the chromosomes for accurate segregation during mitosis (Mitchison and Salmon, 1993; Waters et al., 1996).
Fig. 12.
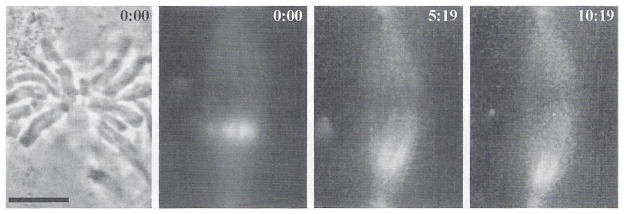
Multimode imaging and local fluorescence photoactivation to see the dynamics of kinetochore fiber microtubules in metaphase newt lung epithelial cells. Cells were injected in early mitosis with X-rhodamine-labeled tubulin and C2CF caged-fluorescein-labeled tubulin. At each time point, a phase image showed chromosome position, an X-rhodamine image showed spindle microtubule assembly, and the C2CF fluorescein image recorded the poleward flux and turnover of photoactivated fluorescent tubulin within the kinetochore fiber microtubules. In the color frames, the green photoactivated C2CF fluorescein fluorescence is overlaid on the red image of the X-rhodamine tubulin in the spindle fiber microtubules. Time is given in minutes after photoactivation. See Waters et al. (1996) for details. Scale = 10 μm. (See Plate 10 in the color insert section.)
D. Microtubule and ER Dynamics in Migrating Tissue Cells
The sensitivity of the imaging system has made it possible to track with great clarity the assembly dynamics of individual microtubules and ER in migrating epithelial cells (Waterman-Storer and Salmon, 1997). Microtubules are fluorescently labeled red by microinjecting X-rhodamine-labeled tubulin into cells. Endoplasmic reticulum is fluorescently labeled green using the membrane-intercalating dye DiOC6 (Waterman-Storer et al., 1993), and the leading edge lamellopodia and the lamella of the cell are recorded by DIC. Sets of image stacks are recorded every 7 seconds. Figure 13A–C show a pair of images, one from the rhodamine channel showing the microtubules and the other by DIC showing the leading edge of the lamella. Figure 13D–F show a pair of images, one from the rhodamine channel and the other from the DiOC6 channel. One significant advance in the prevention of photobleaching in a sealed slide–coverslip preparation is the oxygen-scavenging enzyme system Oxyrase (Waterman-Storer et al., 1993), used in these experiments.
Fig. 13.

Microtubules in the lamella of a live migrating newt lung epithelial cell. Microtubules are fluorescently labeled by microinjection of X-rhodamine-labeled tubulin into the cytoplasm and ER-labeled with DiOC6 (A) DIC image of leading edge of lamella. (B) X-rhodamine microtubule image. (C) RGB color overlay of A and B. (D) X-rhodamine tubulin image of another cell. (E) DiOC6 image of the ER. (F) RGB color overlay of E and F. See text for details. (See Plate 11 in the color insert section.)
E. GFP-Dynein-Labeled Microtubules in Yeast
Shaw et al. (1997a), imaged the dynamics and organization of the cytoplasmic microtubules in live budding yeast (Fig. 14). GFP dynein expressed in yeast binds all along the lengths of the cytoplasmic but not the nuclear microtubules. The fluorescence is barely detectable with the dark-adapted eye with no attenuation of the Hg illumination to the specimen. Images with distinct astral microtubules are recorded using exposures of 3 seconds. 1 OD illumination attenuation, and the field diaphragm closed down around the specimen to reduce the out-of-focus fluorescence from the gelatin layer that holds the yeast against the coverslip surface. We found that a single optical section was not sufficient to see the organization of astral microtubules in these small cells, which are about 5 μm in diameter. As a result, we developed an image acquisition procedure where for each time-lapse point (1-minute intervals), a series of five fluorescent optical sections is taken through the yeast at 1-μm intervals along the z-axis (Shaw et al., 1997b). In the position of the middle section, a DIC image is taken by inserting the analyzer before the camera with the emission filter controller described earlier. After the completion of the time lapse over the yeast cell cycle of about 90 minutes, the fluorescent image stack is processed so that at each time interval, the fluorescent microtubule images in each five-plane stack are projected onto one plane. This projected image can then be displayed side by side or overlaid with the corresponding DIC image (Fig. 14). Movies of these images show the organization and dynamics of astral microtubules relative to the cell nucleus and other structural features of the cell visible by DIC.
Fig. 14.

(A) Fluorescent image of GFP-dynein bound to astral microtubules and (B) the corresponding DIC image of an anaphase yeast Saccharomyces cerevisiae. The elongated nucleus is mostly out of focus in the DIC image. See text for details.
F. Immunofluorescent Specimens
We have found that the cooled CCD image acquisition system produces images of immunofluorescent-stained specimens with great clarity. Often our specimens do not have high levels of out-of-focus fluorescence, and the advantages of confocal imaging are not required. Figure 15 shows an example where mammalian PtK1 tissue cells are stained with antibodies for a protein implicated in the control of the anaphase onset during mitosis. MAD2 (Chen et al., 1996). The hypothesis is that when bound to kinetochores. MAD2 signals the cell to “stop” the cell cycle. When kinetochores become properly attached to microtubules emanating from opposite poles, MAD2 antibody staining of kinetochores disappears (all the “red stop lights” are off) and the cell enters anaphase.
Fig. 15.
The mitotic arrest protein MAD2 localizes to kinetochores on chromosomes in mitotic PtK1 cells when they are unattached from spindle microtubules. The cell was treated with nocodazole to induce spindle microtubule disassembly and then lysed and fixed for immunofluorescence staining with antibodies to the MAD2 protein (Chen et al., 1996). (A) A single optical fluorescence section. (B) The corresponding DIC image. (C) The fluorescent MAD2 image and the DIC image combined in an RGB image to show the localization of MAD2 on either side of the centomeric constriction of the chromosomes where the sister kinetochore are located. Some kinetochores are above or below the plane of focus and not visible. (See Plate 12 in the color insert section.)
References
- Aikens RS, Agard D, Sedat JW. Methods in Cell Biology. Vol. 29. Academic Press; San Diego: 1989. pp. 292–313. [DOI] [PubMed] [Google Scholar]
- Carrington WA, Lynch RM, Moore EDW, Isenberg G, Forarty KE, Fay ES. Science. 1995;268:1483–1487. doi: 10.1126/science.7770772. [DOI] [PubMed] [Google Scholar]
- Chen RH, Waters JC, Salmon ED, Murray AW. Science. 1996;274:242–246. doi: 10.1126/science.274.5285.242. [DOI] [PubMed] [Google Scholar]
- CLMIB staff. Am Lab. 1995. Apr, pp. 25–40. [Google Scholar]
- Cubitt AB, Heim R, Adams SR, Boyd AE, Gross LA, Tsien RY. Trends Biochem Sci. 1995;20:448–455. doi: 10.1016/s0968-0004(00)89099-4. [DOI] [PubMed] [Google Scholar]
- Farkas D, Baxter G, DeBiasio R, Gough A, Nederlof M, Pane D, Pane J, Patek D, Ryan K, Taylor D. Annu Rev Phys. 1993;55:785. doi: 10.1146/annurev.ph.55.030193.004033. [DOI] [PubMed] [Google Scholar]
- Heim R, Tsien R. Curr Biol. 1996;6:178–182. doi: 10.1016/s0960-9822(02)00450-5. [DOI] [PubMed] [Google Scholar]
- Hiroka Y, Sedlow JR, Paddy MR, Agard D, Sedat JW. Semin Cell Biol. 1991;2:153–165. [PubMed] [Google Scholar]
- Holloway SL, Glotzer M, King RW, Murray AW. Cell. 1993;73:1393. doi: 10.1016/0092-8674(93)90364-v. [DOI] [PubMed] [Google Scholar]
- Inoué S. Video Microscopy. Plenum; New York: 1986. [Google Scholar]
- Inoué S. Methods in Cell Biology. Vol. 30. Academic Press; San Diego: 1989. p. 112. [DOI] [PubMed] [Google Scholar]
- Inoué S, Oldenbourg R. Optical Society of America, editor. Handbook of Optics. 2. McGraw-Hill; New York: 1993. [Google Scholar]
- Inoué S, Spring K. Video Microscopy. 2. Plenum; New York: 1997. [Google Scholar]
- Keller HE. In: Handbook of Biological Confocal Microscopy. Pawley JB, editor. Plenum; New York: 1995. pp. 111–126. [Google Scholar]
- Mitchison TJ. J Cell Biol. 1989;109:637. doi: 10.1083/jcb.109.2.637. [DOI] [PMC free article] [PubMed] [Google Scholar]
- Mitchison TJ, Salmon ED. J Cell Biol. 1993;119:569. doi: 10.1083/jcb.119.3.569. [DOI] [PMC free article] [PubMed] [Google Scholar]
- Murray AW, Desai A, Salmon ED. Proc Nat Acad Sci USA. 1996;93:12327–12332. doi: 10.1073/pnas.93.22.12327. [DOI] [PMC free article] [PubMed] [Google Scholar]
- Olson K, McIntosh JR, Olmsted JB. J Cell Biol. 1995;130:639. doi: 10.1083/jcb.130.3.639. [DOI] [PMC free article] [PubMed] [Google Scholar]
- Pawley J, editor. Handbook of Biological Confocal Microscopy. 2. Plenum; New York: 1995. [Google Scholar]
- Salmon ED, Inoué T, Desai A, Murray AW. Biol Bull. 1994;187:231–232. doi: 10.1086/BBLv187n2p231. [DOI] [PubMed] [Google Scholar]
- Sawin KE, Theriot JA, Mitchison TJ. Fluorescent Probes for Biological Activity in Living Cells. Academic Press; San Diego: 1992. [Google Scholar]
- Sawin KE, Mitchison TJ. J Cell Biol. 1991;112:941. doi: 10.1083/jcb.112.5.941. [DOI] [PMC free article] [PubMed] [Google Scholar]
- Shamu CE, Murray AW. J Cell Biol. 1992;117:921. doi: 10.1083/jcb.117.5.921. [DOI] [PMC free article] [PubMed] [Google Scholar]
- Shaw SL, Salmon ED, Quatrano RS. Bio Techniques. 1995;19:946–955. [PubMed] [Google Scholar]
- Shaw SL, Yeh E, Maddox P, Salman ED, Bloom K. J Cell Biol. 1997a:139. doi: 10.1083/jcb.139.4.985. [DOI] [PMC free article] [PubMed] [Google Scholar]
- Shaw SL, Yeh E, Bloom K, Salman ED. Curr Biol. 1997b;7:701–704. doi: 10.1016/s0960-9822(06)00299-5. [DOI] [PubMed] [Google Scholar]
- Shotten DM. Histochem Cell Biol. 1995;104:97–137. doi: 10.1007/BF01451571. [DOI] [PubMed] [Google Scholar]
- Spencer M. Fundamentals of Light Microscopy. Cambridge University Press; London: 1982. [Google Scholar]
- Taylor DL, Salmon ED. Methods in Cell Biology. Vol. 29. Academic Press; San Diego: 1989. pp. 207–237. [PubMed] [Google Scholar]
- Taylor DL, Nederhof M, Lanni F, Waggoner AS. Am Sci. 1992;80:322–335. [Google Scholar]
- Waterman-Storer CM, Salmon ED. J Cell Biol. 1997;139:417–434. doi: 10.1083/jcb.139.2.417. [DOI] [PMC free article] [PubMed] [Google Scholar]
- Waterman-Storer CM, Sanger JW, Sanger JM. Cell Motil Cytoskel. 1993;26:19. doi: 10.1002/cm.970260104. [DOI] [PubMed] [Google Scholar]
- Waters JC, Mitchison TJ, Rieder CL, Salmon ED. Molec Biol Cell. 1996;7:1547–1558. doi: 10.1091/mbc.7.10.1547. [DOI] [PMC free article] [PubMed] [Google Scholar]
- Yang SS, Yeh E, Salmon ED, Bloom K. J Cell Biol. 1997;136:1–10. doi: 10.1083/jcb.136.2.345. [DOI] [PMC free article] [PubMed] [Google Scholar]
- Yeh E, Skibbens RV, Cheng JW, Salmon ED, Bloom K. J Cell Biol. 1995;130:687–700. doi: 10.1083/jcb.130.3.687. [DOI] [PMC free article] [PubMed] [Google Scholar]
- Zhai Y, Kronebusch P, Borisy G. J Cell Biol. 1995;131:721. doi: 10.1083/jcb.131.3.721. [DOI] [PMC free article] [PubMed] [Google Scholar]
Further Reading
- Inoué S, Salmon ED. Mol Biol Cell. 1995;6:1619–1640. doi: 10.1091/mbc.6.12.1619. [DOI] [PMC free article] [PubMed] [Google Scholar]
- Schotten D. Electronic Light Microscopy. Wiley-Liss; New York: 1993. [Google Scholar]