Abstract
Zoonotic infectious diseases such as influenza continue to pose a grave threat to human health1. However, the factors that mediate the emergence of RNA viruses like influenza A virus (IVA) remain incompletely understood2,3. Phylogenetic inference is crucial to reconstructing the origins and tracing the flow of influenza A virus within and between hosts3-8. Here, we show that explicitly allowing IVA host lineages to have independent rates of molecular evolution is necessary for reliable phylogenetic inference of IVA and that methods that do not do so, including ‘relaxed’ molecular clock models9, can positively mislead. A phylogenomic analysis using a host-specific local clock model recovers extremely consistent evolutionary histories across all genomic segments and demonstrates that the equine H7N7 lineage is a sister clade to strains from birds—as well as those from humans, swine, and the equine H3N8 lineage— sharing an ancestor with them in the mid- to late-1800s. Moreover, major Western and Eastern Hemisphere avian influenza lineages inferred for each gene coalesce in the late 1800s. Based on these phylogenies and the synchrony of these key nodes, we infer that the internal genes of avian influenza virus (AIV) underwent a global selective sweep beginning in the late 1800s, a process that continued throughout the 20th century and up to the present. The resulting western hemispheric AIV lineage subsequently contributed most of the genomic segments to the 1918 pandemic virus and, independently, the 1963 equine H3N8 panzootic lineage. This approach provides a surprisingly clear resolution of IVA evolutionary patterns and processes, including the flow of viral genes and genomes within and between host lineages.
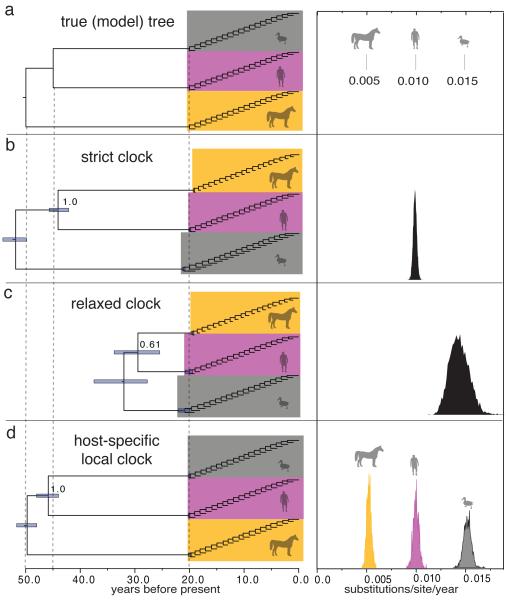
We hypothesize that distinct evolutionary rates in IVA lineages of different host species have compromised the accuracy of phylogenetic analyses with regard to inferring the timing and direction of the key movements of the virus between hosts over the last several centuries. To resolve this we have employed a model that allows IVA in individual host types to have different rates of molecular evolution, which we refer to as the host-specific local clock (HSLC) model. To evaluate its performance we generated synthetic nucleotide sequences along the model tree in Fig. 1a using substitution model parameters and host-specific rates representative of real IVA data sets. Simulated ‘equine’, ‘human’, and ‘avian’ host clades were assigned relative rates of 1:2:3, respectively, to cover the empirically observed range of rates (Fig. 2).
Figure 1. Performance of different clock models on simulated data.
a, Model tree used to simulate nucleotide data, with branch lengths depicted in units of time. The host-specific rates of the ‘equine’, ‘human’, and ‘avian’ lineages are shown to the right of the tree. b, MCC tree for simulation replicate #1 under a strict clock model. The 95% credibility interval for each node time is shown with a bar, and the posterior probability of the ingroup node is indicated. c, MCC tree under a relaxed clock model. d, MCC tree under the HSLC model. The posterior density of the clock rate inferred under each model is shown at right. Summaries of the results for all 100 replicates are shown in Extended Data Fig. 1.
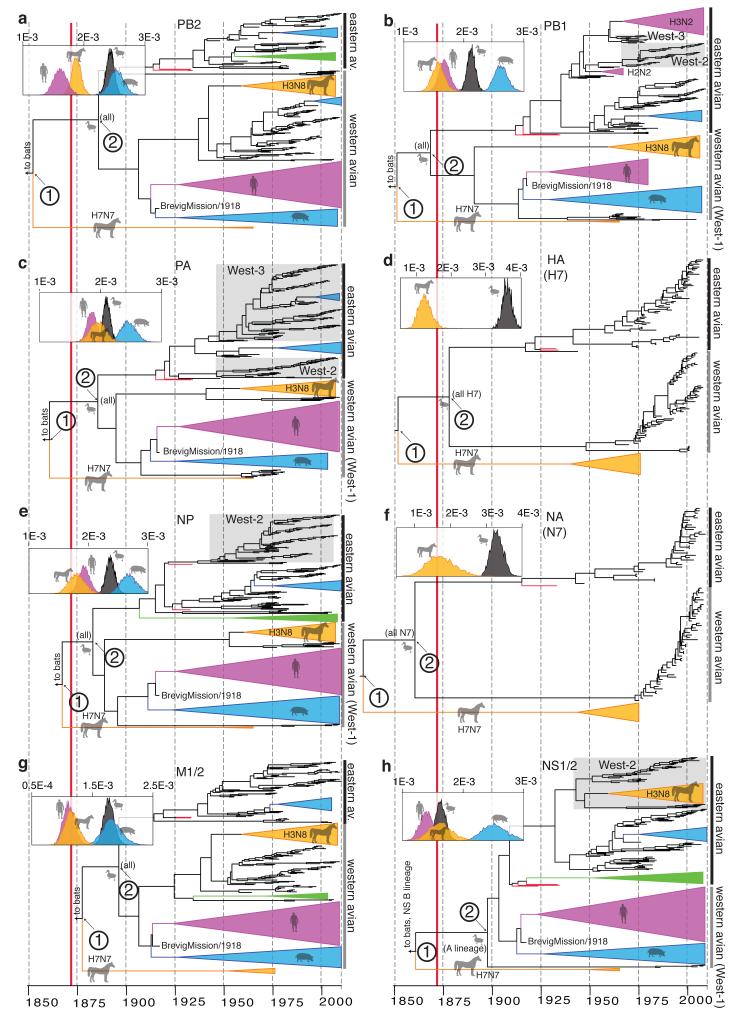
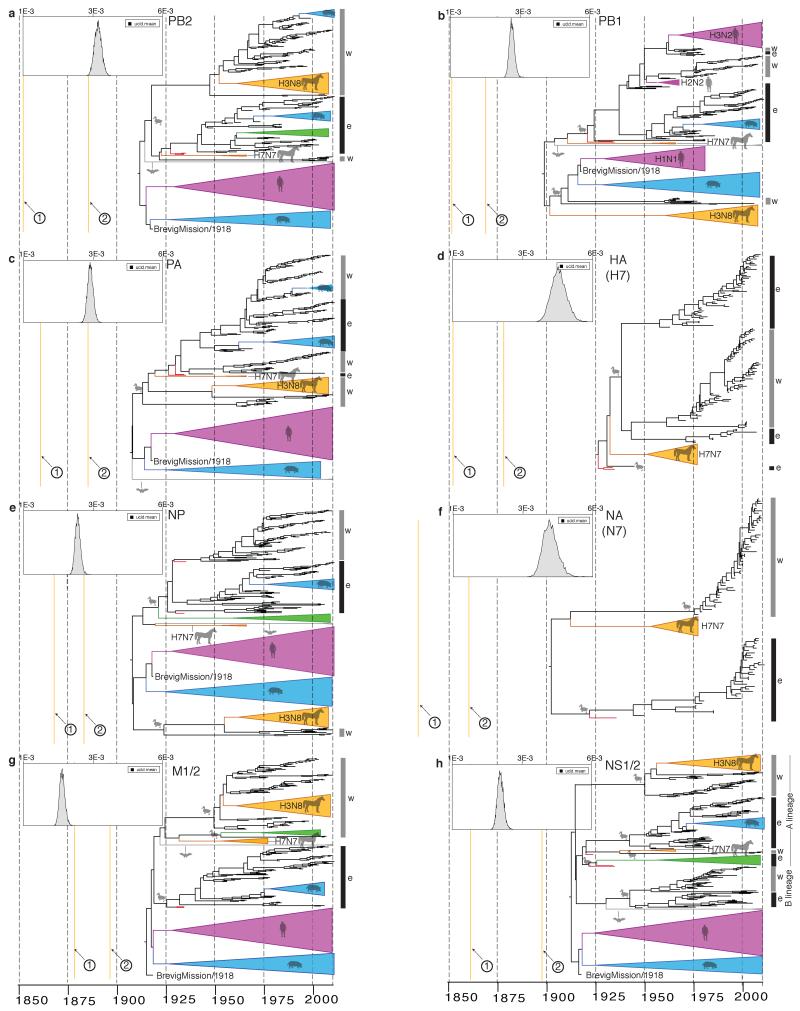
Figure 2. Host-specific local clock model results.
a-h, respectively: MCC trees and host-specific rate distributions (inset at top left) inferred under the HSLC model. Trees are drawn to the same scale, with branch lengths in years. The epizootic of 1872-73 is indicated with a solid red line. The major Eastern and Western Hemisphere AIV lineages are highlighted with black and gray vertical bars, respectively. The green triangles represent gull/shorebird clades (order Charadriiformes) allowed their own rate separate from other AIV. In some cases (e.g. NS1/2) there is clear evidence of Charadriiformes AIV descending from domestic avian HPAI viruses of the 1920s and 1930s (which are highlighted in red). Fully resolved trees including posterior probabilities for each node and 95% CIs on node dates are depicted in Fig. S1. Data, input, and full MCC tree files are available from http://dx.doi.org/10.5061/dryad.m04j9.
Fig. 1 shows detailed results for the first replicate, but the patterns were almost identical across all replicates: a strict clock roots the tree incorrectly, resulting in the wrong maximum clade credibility (MCC) topology (posterior support=1.0) and spurious timing estimates. A widely-used relaxed clock model9 also gets the topology wrong and very seriously underestimates the time to the most recent common ancestors (TMRCAs) at the deepest nodes. These models recovered the model tree topology in 0% of runs; the HSLC model did so in 100% of the simulations (Extended Data Fig. 1). Moreover, the relaxed clock’s 95% credible interval (CI) for the TMRCA never included the real root node date; the HSLC model did in 91% of the simulations.
Hence, misspecified molecular clock models are likely to generate profoundly misleading results with IVA data sets encompassing multiple host species. They are prone to severe systematic errors in topology and timing estimation, and erroneous conclusions can exhibit strong statistical support. This is a serious problem given that such results are widely used to infer when, where, and how pandemic and panzootic viruses have emerged.
Analyses of alignments of full-length segments encoding the IVA polymerase proteins (PB2, PB1, PA); the hemagglutinin (HA) surface glycoprotein subtypes H1, H3, and H7; the nucleocapsid protein (NP); the neuraminidase (NA) surface glycoprotein subtypes N1, N8, and N7; the matrix proteins (M1/2); and the nonstructural proteins (NS1/2) show how the HSLC model can outperform those assuming a single distribution of rates across hosts. In contrast to the conflicting topologies and timings inferred using a relaxed clock (Extended Data Fig. 2), the HSLC model revealed an underlying conformity and simplicity to IVA phylogenies (Fig. 2). A single pattern emerged, segment-by-segment: the equine H7N7 lineage4,10 is positioned basal to all avian, human, swine, and equine H3N8 strains (except for the NS1/2 ‘B’ lineage, discussed below). The timelines of the trees are also similar, with the most recent common ancestor (MRCA) of the equine H7N7 and avian lineages (node 1) dated between the 1830s and 1870s, and the MRCA of all avian strains (node 2) dated between the 1860s and 1890s.
Distinct western and eastern hemispheric avian clades are apparent, diverging at node 2, with more recent east-to-west introductions of the ‘West-2′ and ‘West-3′ clades in PB1, PA, NP, and NS1/2 (Fig. 2). Both node 1 and node 2 are supported by posterior probabilities of 1.0 in nearly every case (Fig. S1). The results are robust to different substitution models and sampling regimes (Extended Data Table 1), while analyses of 3rd codon position sites (Extended Data Table 1) and tests for episodic diversifying selection (Extended Data Fig. 3) suggest they are unlikely to be biased by adaptive evolution.
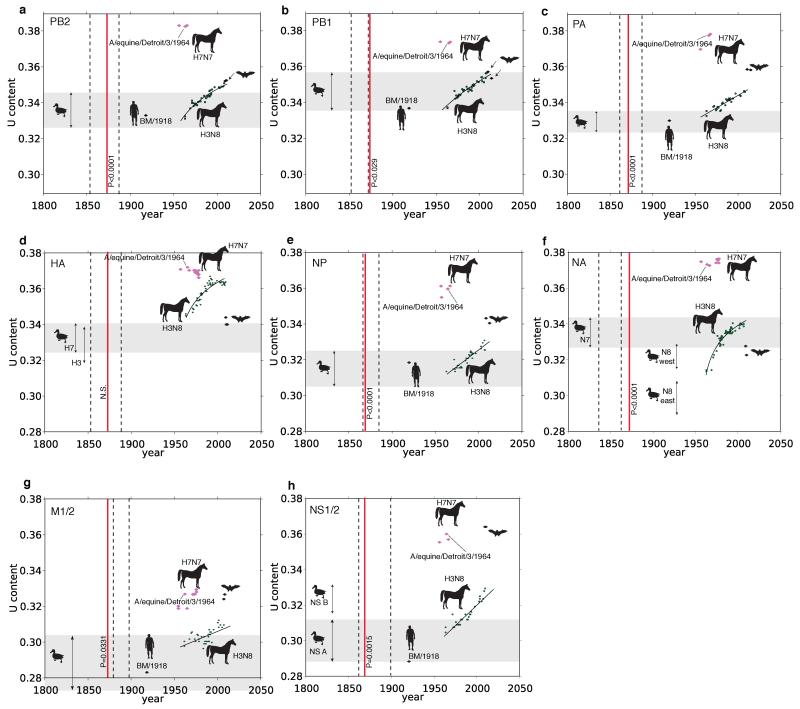
For the branch between nodes 1 and 2 (Fig. 2) the period of overlap shared across all eight segments, accounting for uncertainty in node dates, is 1866-1878. This period is of interest since it encompasses one of the most extraordinary recorded outbreaks of influenza in animals, the severe Western Hemisphere panzootic of equine influenza in 1872-73 (refs 11, 12), which was also occasioned by widespread reports of influenza in domestic birds in the wake of local equine outbreaks13. The equine H7N7 lineage exhibits extraordinarily high uracil (U) content in all genes. The U content of the IVA genome tends to increase steadily in mammalian hosts14 so this is consistent with continuous circulation in horses from 1872 or perhaps even earlier (Extended Data Figs. 4 & 5). We speculate that there may have been some epidemiological event possibly associated with the 1872 epizootic that precipitated a global sweep of AIV internal genes, which we infer commenced around this time. The 1870s, moreover, saw the first scientific description of highly pathogenic avian influenza (HPAI) (in chickens in northern Italy15), which coincided with a transition to high-production, high-flock-size poultry farms16.
Unlike previous approaches17 (Extended Data Fig. 2), the HSLC model provides consistent, statistically strong evidence that the 1918 pandemic virus’s PB2, PB1, PA, NP, M1/2, and perhaps NS1/2 arose from the Western Hemisphere AIV lineage (Figs. 2 & S1). U content values are consistent with a recent avian origin of these internal genes, with none lying above the avian range in 1918 (Extended Data Fig. 4). The sampling of PB1 and PA AIV sequences includes particularly close relatives of the 1918 virus, with which they shared a common ancestor just a few years prior to 1918 (Fig. 2). These suggest a North American origin of its internal genes, with domestic and wild birds equally likely sources (Fig. S1). These results mean that the hypothesis that several genes of the 1918 pandemic virus originated via reassortment between human and swine lineages, circulating for decades in mammalian hosts17, likely arises erroneously from a failure to accommodate differences in rates amongst hosts.
The internal proteins of the 1963 panzootic H3N8 equine virus also appear to have a western hemispheric avian origin (independent of the 1918 virus) (Fig. 2, Extended Data Fig. 4). The best-resolved genes, PA, NP, and NS1/2, show that this lineage shared an MRCA shortly before its emergence with avian strains from Argentina, Bolivia, Chile, and Brazil (e.g. NP avian/equine TMRCA: 1954 [1951-1957)]). These findings are in striking agreement with the evidence that the virus, though first described in the U.S., entered Miami, Florida in 1963 via thoroughbred horses imported by air from Argentina18.
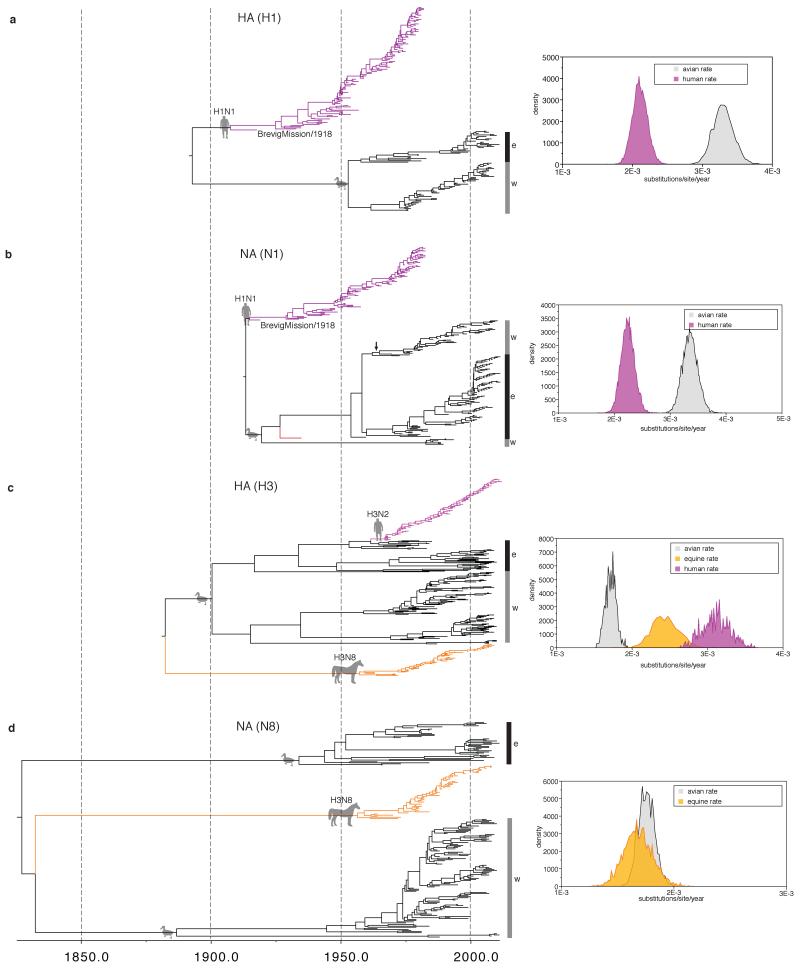
When compared to the other genomic segments, the external antigenic genes HA and NA exhibit considerably higher diversity in wild birds (Fig. 3) and no correlation in phylogenetic structure; for example, see the H1, N1, H3, and N8 phylogenies in Extended Data Fig. 6. This has been attributed to a much higher rate of evolution in these genes driven by antigenic adaptation, combined with free reassortment of the internal gene segments7. Our results suggest an intriguing alternative evolutionary scenario in which an avian virus, possibly an H7N7 from domestic birds, initiated a global selective sweep of its internal gene segments across the standing diversity of AIV, with the replacement of almost all previous AIV internal gene diversity. The exception is the NS1/2 gene segment that was incompletely swept leaving a rump of ancestral diversity (Fig. S1h) designated the ‘B’ lineage19. We suspect the sweep took several decades; an analysis of more recent succession dynamics in AIV (Extended Data Table 2; Figs. 2 & S1) suggests that large geographic replacements are an ongoing process and that several decades typically elapse between the emergence of a new variant and the completion of a global or hemispheric sweep.
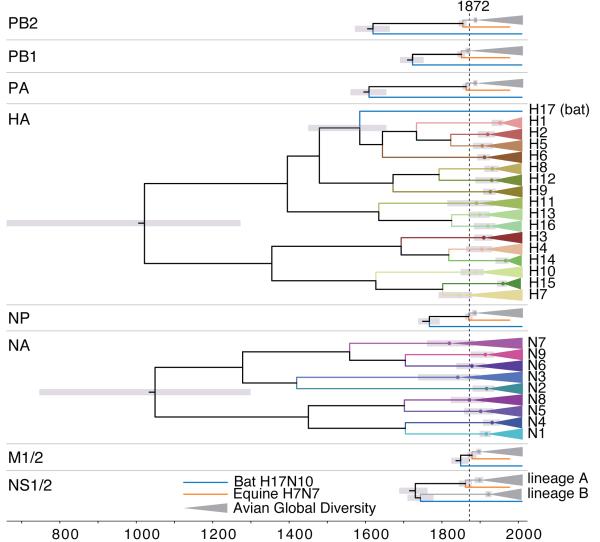
Figure 3. HA, NA, and internal gene diversity.
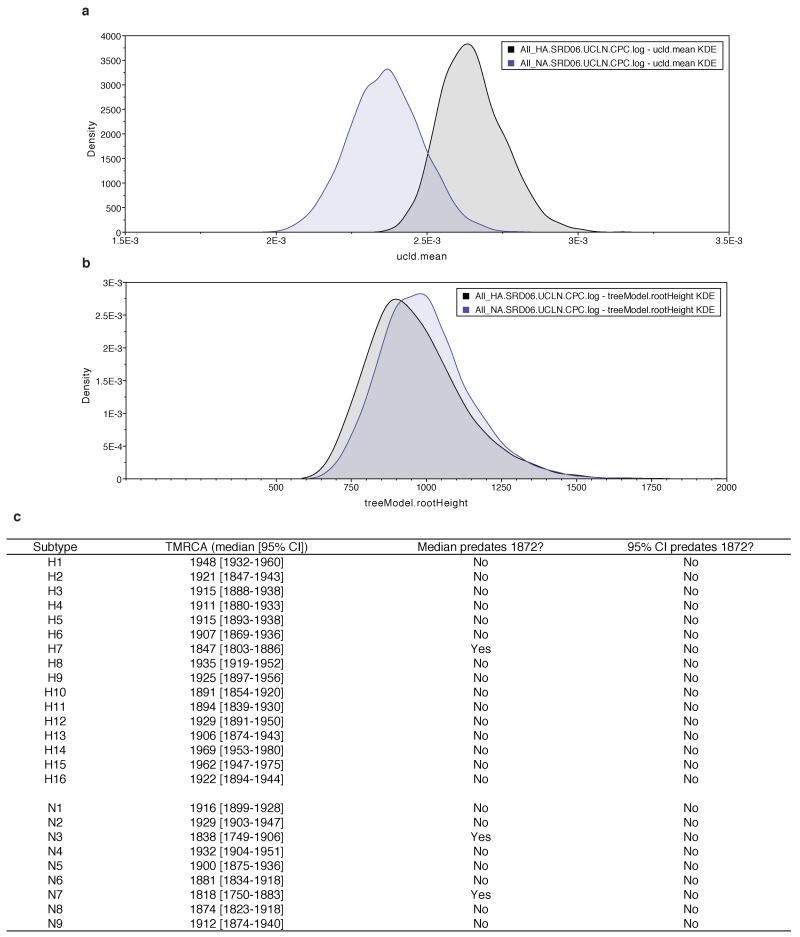
Summarized time-calibrated phylogenetic trees of known IVA viruses for each genomic segment. Each triangle represents global AIV diversity for internal genes (in grey) and each subtype of HA and NA (in colour). Grey bars represent 95% CIs for the dates of divergence of nodes of interest. The MRCA of each HA and NA subtype and the global avian diversity of every internal gene corresponds to or post-dates 1872 (dashed line). Dates of divergence are shown in Extended Data Fig. 7c.
Chen and Holmes8 posited a sweep as a possible explanation for the markedly restricted diversity of the internal genes in avian hosts (evident in Fig. 3) but dismissed that hypothesis in favour of a scenario in which the internal genes are repeatedly hitchhiking on selective sweeps of the antigenic genes HA and NA. However, such a process could not have consistently removed all the diversity in the hitchhiked genes without the fixation of the selected gene as well. Indeed, genetic hitchhiking by definition involves a reduction of diversity in the locus that is the focus of selection20 whereas here we observe HA and NA maintaining their diversity.
We hypothesize that the global sweep of internal genes left some of the pre-existing diversity of HA and NA in place because immunity in previously exposed bird populations selects for antigenically novel viruses sufficiently to maintain multiple subtypes. Accordingly, phylogenies of HA and NA reveal the much older diversity of these gene segments: although evolving at different rates, HA and NA have indistinguishable TMRCAs of ~1000 years ago (Fig. 3, Extended Data Fig. 7). Interestingly, the TMRCA within each subtype is statistically compatible with a date of ~1870 or later, a result expected if the internal genes swept across standing diversity in HA and NA but difficult to explain otherwise. The current global diversity of AIV may thus descend from reassortment between these internal genes and pre-existing HA, NA, and NS B lineage variants from as few as 16 avian viruses in the decades following initiation of the sweep (Fig. 3).
One lineage that did not receive this internal genome constellation is that found in fruit bats20,21, presumably because avian-adapted genes did not confer sufficient fitness advantages or because the bat viruses are ecologically isolated. Under the scenario that the internal gene segment diversity was swept from avian (but not bat) influenza, the current position of the bat viruses as a basal lineage to the avian diversity in all genes but HA20,21 and NS1/2 (Fig. S1) is readily explained without a reassortment event with an avian HA.
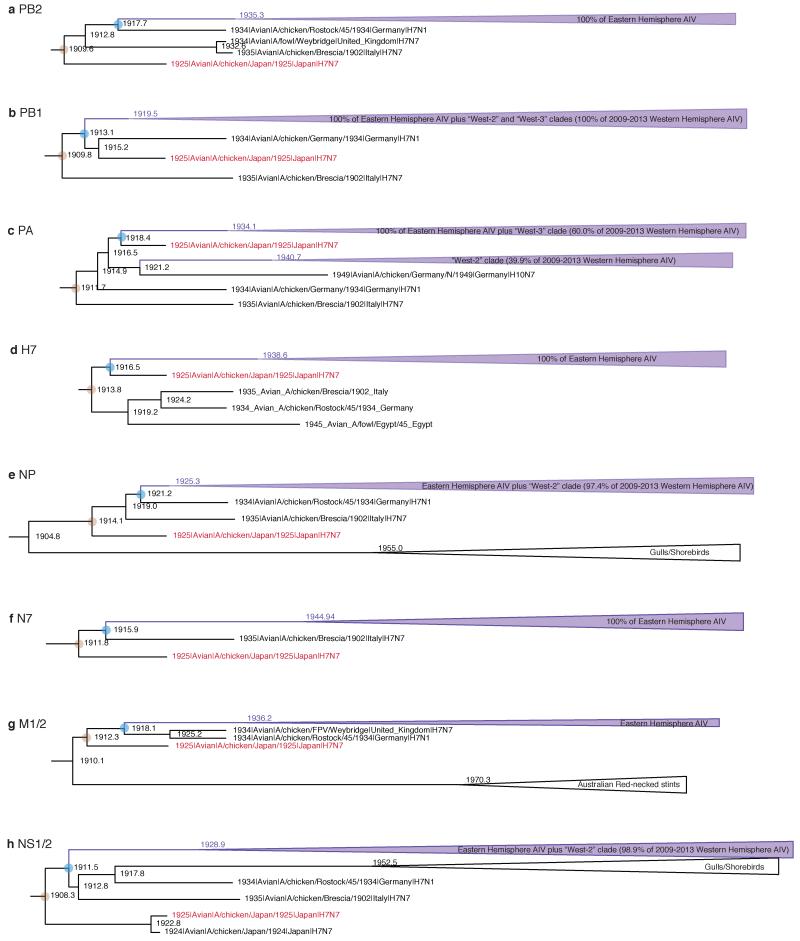
Descendants of 1920s-1930s H7 AIV from Eurasian domestic birds16 account for virtually all Eastern Hemisphere AIV internal gene diversity (Fig. 2, Extended Data Fig. 8). Moreover, they were the source of PB1, PA, NP, and NS lineages that migrated between the 1930s and 1960s from the Eastern to Western Hemisphere (‘West-2′ and ‘West-3′; see Extended Data Table 2). By 2009-2013 these lineages had swept across the hemisphere, nearly displacing the older ‘West-1′ lineages (Figs. 2 & S1). Global sweeps are thus still unfolding, and domestic avian influenza genes can displace previous variants—evidently even in wild hosts, and even on a hemispheric or global scale—over the course of decades. We suspect that domestic ducks may be a crucial nexus in the bidirectional (domestic/wild) gene flow of AIV worldwide (see Supplementary Information).
Influenza A viruses in humans exhibit global selective sweeps frequently, with the entire H3N2 and H1N1 genomic diversity being replaced every few years5,6. During both the pandemics of the mid-20th Century, new variants swept to fixation within months, completely replacing existing strains. In humans such dynamics are driven primarily by the fitness advantages the virus obtains from antigenic novelty. However, the global avian selective sweep we have posited here was evidently driven by other selective advantages conferred by mutations in one or more of the internal genes. Characterizing the nature of these host-specific adaptations may be crucial in understanding the risk of future emergence of avian influenza in humans.
METHODS SUMMARY
We implemented the HSLC model in BEAST23, allowing an arbitrary number of distinct clades to have rates inferred separately and simultaneously within a single Bayesian MCMC analysis. We constructed sequence alignments using all available full-segment IVA sequences encoding PB2, PB1, PA, HA (H1, H3, H7), NP, NA (N1, N7, N8), M1/2, and NS1/2 from birds, horses, pigs, humans, and fruit bats. A subset of sequences of a size amenable to molecular clock analyses (~300 sequences per segment) was sampled, preserving all major lineages and all the most basal sequences in major clades. Each major host group was allowed its own rate in the HSLC model. We inferred the rate of increase of U content through time for equine H3N8 by fitting a two-dimensional Scaled Log Transform: U content = a * ln(b * year + c). Age estimates for equine H7N7 were calculated assuming these rates and were then compared to the timing of the 1872 epizootic to test whether the high U content in equine H7N7 is consistent with continuous equine transmission from this period.
METHODS(ON-LINE)
The host-specific local clock model and simulations
The HSLC model is conceptually a ‘local clock’ model as described previously24-26, although in most implementations of this model the tree topology is fixed. Here, the host-specific clades are specified a priori and these clades are enforced to remain monophyletic, but phylogenetic relationships internal to each host clade and the relationships between the clades are estimated.
We implemented the HSLC model in BEAST v1.8.0 (ref 23, available from http://beast.bio.ed.ac.uk/), allowing an arbitrary number of distinct clades to have their rates inferred separately and simultaneously within a single Bayesian MCMC analysis. Data, BEAST XML input files, and MCC trees are available from the Dryad Digital Repository: http://dx.doi.org/10.5061/dryad.m04j9.
To investigate the consequences of model misspecification (a key issue in phylogenetic inference), and to compare the performance of the HSLC model and the commonly used strict and uncorrelated relaxed clock models9, we generated 100 synthetic nucleotide sequence data sets along the model tree in Extended Data Figure 1a. We used substitution model parameters and host-specific rate ratios representative of real multi-host IVA data sets. ‘Equine’, ‘human’, and ‘avian’ clades were set to evolve at relative rates of 1:2:3, respectively, to cover the empirically observed range of rates in real IVA data sets (see Fig. 2). Simulated data sets were generated in Seq-Gen v1.3.2 (ref 27) (command line: -mGTR -l10000 -f0.336 0.185 0.241 0.236 -n100 -a0.33 -g4 -r1.82 11.4 0.809 0.24 15.4 1.0). (The transition rates and base frequencies were taken from the real HA data set in Fig. 2d).
To test whether the substitution model affected the performance of any of the three clock models we simulated an additional ten data sets along the same tree but under the JC69 substitution model. We also created data sets with unequal sampling density among the clades evolving at different rates. We used BEAST for all the clock analyses of the simulated data. In all cases we used a GTR28 + gamma29 substitution model, and a GMRF Bayesian skyride coalescent tree prior30.
IVA sequence data preparation
A total of >80,000 influenza A virus full-length genome segment nucleotide sequences encoding PB2, PB1, PA, HA (H1, H3, H7), NP, NA (N1, N7, N8), M1/2, and NS1/2 were retrieved from the NCBI Influenza Virus Resource31. Sequences representing significant circulating IVA clades from humans, birds, horses, pigs, and bats were included in our data sets. Sequences from other hosts represent sporadic recent host jumping events32 and were not included. For the segments encoding one protein, the nucleotides in the gene coding regions were extracted. For the segments encoding more than one protein, the nucleotides in the regions spanning all the open reading frames were extracted. The sequences were aligned using MUSCLE v3.6 (ref 33) and then refined manually. To reduce the computational cost, identical sequences were removed from each data set.
Preliminary phylogenetic trees were inferred using the neighbor-joining method available in MEGA 5.0 (ref 34). Since artificial recombination has been frequently reported in influenza A virus35, RDP3 (ref 36) was used to detect significant recombination signals. Apparent recombinants and other problematic sequences possibly resulting from laboratory contamination were excluded from the final data sets. For each gene a subset of sequences of a size amenable to molecular clock analyses (~300 sequences) was sampled, preserving all major lineages and, crucially, all the most basal sequences in major clades. Not included were mammalian viral lineages nested within other mammalian lineages, since the current HSLC model is unable to calculate independent rates for such nested clades. For example, the 2009 pH1N1 human lineage, which emerged from swine37, was not included. Nor was the canine H3N8 lineage38, which is nested within the equine H3N8 clade. We believe none of our conclusions could have been importantly affected by the absence of such lineages. Because the effective sampling time of post-1977-pre-2009 human H1N1 is 27 years earlier that the actual sampling date39, we shifted the dates accordingly for our clock analyses. The taxon labels of those sequences end with an asterisk, and the year in the first field of the label is the corrected year, not actual year of sampling (see Fig. S1).
Phylogenetic analyses
We analyzed these IVA alignments with both the HSLC model and, for comparison, an uncorrelated lognormal distribution (UCLD) relaxed clock model9, using in both cases a GMRF Bayesian skyride coalescent tree prior30. Each major host group was allowed its own rate in the HSLC model. Essentially, for each monophyletic clade that gets its own local clock, one makes an a priori decision either to give the stem branch leading to the clade the local clock rate, or to exclude it and give it the background rate (i.e. the avian rate in our analyses). In our analyses, for most clades there was clear a priori information (epidemiological, U content, or both) for assigning stem branches either the local or background rate. For example, the stem branch of the seasonal H1N1 clade of human viruses (starting with 1930s strains) and the stem branch of the classical swine influenza clade (also starting with 1930s strains), clearly evolved at the respective human and swine rates, not the avian rate, based on the epidemiology. (They both trace back to the time of the 1918 pandemic.) On the other hand, the equine H3N8 outbreak is thought to have emerged close to 1963 and the U content of the internal genes also suggests the stem branch of this clade should be assigned the avian rate. The assignments can be seen in the XML input files available from http://dx.doi.org/10.5061/dryad.m04j9 and in Fig. S1. (The coloured rectangles indicate whether the stem branch for each local clock clade was included or excluded). For equine H3 HA and N8 NA, it was not clear how the equine stem branches should be assigned so we ran analyses with both the avian rate and the equine rate for each one, which led to very similar topologies and timing estimates.
For the UCLD relaxed clock analysis we used an SRD06 (ref 40) substitution model. For the HSLC analyses in Fig. 2 we used a GTR28 + gamma29 substitution model. (The HSLC analyses were also repeated using the SRD06 model with no discernible effect on the results.) Multiple, separate swine clades in all internal protein encoding segments and separate human H1N1, H2N2, and H3N2 clades in PB1 were allowed separate clock rates. In PB2, NP, M1/2, and NS1/2, the sizeable, distinct viral clades from hosts in the order Charadriiformes (gulls, shorebirds, and relatives) were allowed a distinct clock rate. For the internal genes the equine H7N7 rate was linked to the equine H3N8 rate because there were not enough sequences to calibrate H7N7 on its own. The similarity between the results for the internal gene analyses to the results for H7 and N7, where there were enough equine H7N7 sequences to calibrate the rate, suggests that linking H7N7 to the H3N8 rates in those segments was a valid approach. We ran analyses for 100M steps in most cases and used Tracer v1.5 to ensure ESS values >200. We used TreeAnnotator to infer and annotate MCC trees.
To test for sensitivity to substitution model and for whether potential host-switch related adaptation affected the results we performed additional analyses (Extended Table 1). The SRD06 substitution model was used and galliform AIV clades of eight or more sequences were given their own rate separate from other birds. The results were not significantly different and our conclusions appeared robust to this issue. Host-switch related adaptations may be important in phenotype but in the phylogenetic models they appear to be completely outweighed by the large amount of synonymous and nearly neutral mutations across each segment, while insertions and deletions (e.g. in HA and NA proteins adapted to gallinaceous poultry) are treated as missing data and are thus not influential).
To test for sensitivity of our results to sampling of sequences we took two approaches: First, we subsampled half of the sequences in the alignments for the internal gene data sets reported in Fig. 2. Second, we constructed new alignments, randomly sampling (if available) one sequence per year per host lineage. For most segments this resulted in alignments of about 200 sequences. The results with these alignments closely mirror the other results (http://dx.doi.org/10.5061/dryad.m04j9).
For the HA and NA diversity analyses in Fig. 3, 8258 avian influenza complete HA sequences from all 16 subtypes, and 7343 NA sequences from all 9 subtypes were downloaded. We conducted filtering for lab contaminants, mislabeled sequences, and other possible artefacts; then the sequences were sampled down to contain only one virus from a given location in a given year, resulting in 1335 and 1173 sequences for HA and NA, respectively. Further random sampling was used to give no more than 20 viruses per subtype resulting in a final count of 454 and 335 sequences, respectively. The sequences were aligned using MUSCLE v3.6 (ref 33) and refined by hand. The phylogenies were then reconstructed using BEAST v1.7.5 (ref 23) under the SRD06 (ref 40) + UCLN9 + Skyride30 models, (constant size coalescent, 100M steps each). Exact dates were used when known, while those only known to the year were assigned the midpoint of the year.
Uracil content analyses
U content values were assessed using PAUP* 4.0b10 (ref 41). Curve fitting for the rate of increase of U content through time for equine H3N8 was performed with the ZunZun.com online curve fitting resource using a two-dimensional Scaled Log Transform: U content = a * ln(b * year + c), which was amenable for both effectively linear and asymptotic curves. These rates were than applied to the H7N7 lineage (for which meaningful estimates of the rate of change in U content are not possible to calculate given that they were already at a stable equilibrium U content by the earliest sampling date).
An estimate of the within-equine age of each equine H7N7 gene was determined by calculating how long a sequence starting at the average U content observed among avian strains would take to increase to the U content value observed in the equine lineage in 1956, assuming the H3N8 rate. The upper and lower range estimates were determined using the upper and lower 95% confidence interval values for the avian U content distribution. In other words, these values reflect the minimum equine H7N7 age if the avian virus segment that putatively gave rise to the equine lineage had an extremely high, or low, U content at the time of transmission. In Extended Data Fig. 4, the segments that only show 3 or 4 equine H7N7 sequences are those for which the post-1966 H7N7 viruses have had several internal genes replaced by those of the equine H3N8 lineage.
The resulting age estimates of the equine H7N7 genes were then compared to the timing of the 1872 epizootic. P values were calculated in the software package Numbers, for each segment, as follows: A year was drawn from the distribution of the minimum age of equine H7N7 calculated as described above. For the test of whether the equine H7N7 lineage predated 1872, a P value was calculated as the proportion, out of 10,000 replicates, in which the year drawn was greater than (i.e. postdated) 1872. We emphasize that these estimates rest on the assumption that the rates of U content change are equivalent in the H3N8 and H7N7 equine IVA clades. While it seems reasonable to conclude that the high U content of the H7N7 lineage is consistent with equine transmission from around the time of the 1872 equine epizootic, this assumption of equal rates, though plausible, is unconfirmable and thus precludes a robust test of the directionality of movement of the virus from birds to horses or vice versa at or after node 1 in Fig. 2.
Tests for adaptive evolution
We employed the random effects branch-site model43 for detecting bursts of episodic diversifying selection (EDS) at a subset of sites and/or a subset of branches in the phylogenies. The method allowed us to systematically investigate whether bursts of adaptive evolution might be occurring at host jumps and influencing our overall results. For each gene we included two sequences from each mammalian IVA clade (the earliest available, plus a later one). For each mammalian clade we then added the closest phylogenetic relatives amongst the avian sequences to permit a search for evidence of EDS on the branch between each host, and within each host after putative host jumps.
Next, we took the alignments from Fig. 2 and eliminated all except 3rd codon position sites. With this partition of sites, in which most substitutions are synonymous with respect to amino acids, the dating estimates remained essentially the same as those inferred using all the data. This is a strong indication that adaptive bursts of amino acid substitutions do not underlie our phylogenetic results, since those substitutions are largely absent in this data partition.
Sequencing of additional viruses
In additional to the published sequences used for the analyses we sequenced the complete genome of an equine H7N7 virus, A/equine/Detroit/3/1964(H7N7); the oldest complete genome to date of an avian influenza virus isolate from the Western Hemisphere, A/duck/Manitoba/1953(H10N7); and the oldest complete genome to date of any AIV A/chicken/Japan/1925(H7N7). RNA was extracted as described44. First strand synthesis was completed using Superscript III First Strand System (Invitrogen) with the MBTuni-13 primer [5′-ACGCGTGATCAGTAGAAACAAGG] previously described45 according to the gene specific primer protocol. dsDNA was generated with NEBNext Second Strand Synthesis Module (New England BioLabs). DNA from the samples was sheared to 400 bp using a Covaris focused ultrasonicator (Covaris). Libraries were constructed using the Ovation Ultralow DR multiplex system (NuGen). Pooled libraries were sequenced on an Illumina MiSeq with 2x150 bp paired end reads using the MiSeq v1 300 cycle kit (Illumina). Reads were trimmed and mapped to equine or avian references in CLC Genomics Workbench 6.0.2 (CLC bio) with the following parameters changed from default: mismatch cost=1 and ignore non-specific match handling. The consensus was reported for each gene.
More recent global or hemispheric sweeps of AIV internal genes
To investigate the succession dynamics of internal genes during more recent time periods, we downloaded all available complete PB1, PA, NP, and NS AIV sequences from the Western Hemisphere from 2009-2013 (approximately 1000 for each). These are the four genes for which other analyses (Fig. 2) revealed the presence of relatively recent migration of Eastern Hemisphere gene variants to the Western Hemisphere, and we wanted to examine the fate of these dispersals through time. We designated these relatively recent imports from Eurasia as ‘West-2′ and ‘West-3′ to distinguish them from the older Western Hemisphere lineage in each gene (‘West-1′) (see Figs. 2 & S1 and Extended Data Table 2).
Extended Data
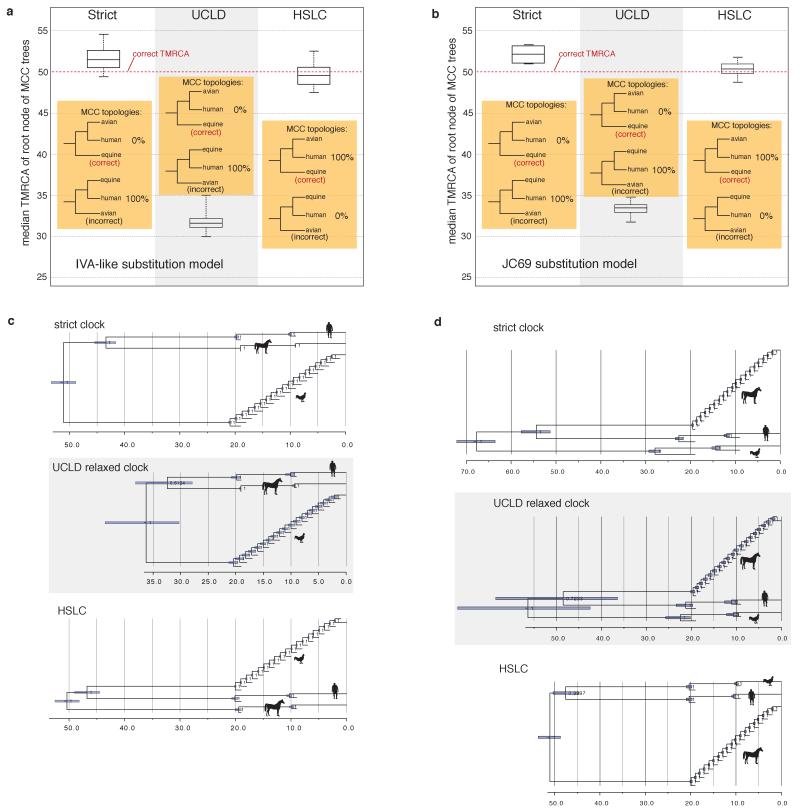
Extended Data Figure 1. Performance of different clock models on simulated data.
a, Summary of the 100 replicates corresponding to Fig. 1 (IVA-like substitution model). The box plots represent the median, Q1, Q3, minimum, and maximum of the 100 median TMRCA estimates. The HSLC model recovered the ‘correct’ (model) tree topology in 100% of the simulations; the other models did so in 0%. With the relaxed clock the 95% CI for the TMRCA never included the real root node date, while the HSLC model did in 91% of the simulations. b, Summary of 10 otherwise similar replicates, but simulated under a JC69 substitution model. c, Simulation with unequal sampling across clades, with ‘fast’ clade (‘avian’) sequences over-represented. (The model tree was identical to that in Fig. 1a except for the unequal number of sequences from the different clades as shown.) d, Simulation with ‘slow’ clade (‘equine’) sequences over-represented. Unlike the HSLC model, root date estimates are systematically biased under both strict and relaxed clock models and are strongly influenced by the balance of ‘fast-clade’ and ‘slow-clade’ sequences sampled.
Extended Data Figure 2. Relaxed molecular clock results.
a-h, respectively: MCC trees inferred under a UCLD relaxed molecular clock model. Host-specific rate distributions in substitutions/site/year are inset at top left. Trees are drawn to the same time scale, with branch lengths in years. Eastern (“e”) and Western (“w”) Hemisphere AIV lineages are highlighted with black and gray vertical bars, respectively. Colouring of branches and clades follows the pattern in Fig. 2. The median date of node 1 and node 2 from the HSLC analyses depicted in Fig. 2 are shown here for comparison. As with the synthetic data sets (Fig. 1, Extended Data Fig. 1), the topologies and timing estimated under a relaxed clock model appear to be compromised by a failure to account for host-specific rates. It is not readily apparent from these trees, for example, that the equine H7N7 lineage is basal to the AIV diversity or that the 1918 pandemic virus is nested within a Western Hemisphere AIV lineage. The root node in each tree is also severely biased toward more recent dates, similar to the results with simulated sequences. Data, input, and full MCC tree files are available from http://dx.doi.org/10.5061/dryad.m04j9.
Extended Data Figure 3. Branch-site REL analyses to test for episodic diversifying selection.
The branches are coloured to depict the proportion of substitutions along each branch that are under purifying selection (with dN/dS < 1: blue), the proportion evolving neutrally (with dN/dS = 1: gray), or under diversifying selection (with dN/dS > 1: red). In every gene, almost every site in every branch evidently evolved under purifying selection. In a few branches, a small proportion of sites show evidence of positive selection (e.g. the branch between AIV and equine H7N7 in NS1/2). However, the proportion is so small that there seems to be no conceivable way that episodic diversifying selection occasioned by host jumps could be driving the overall dating estimates. Even for HA and NA, purifying selection overwhelmingly dominates.
Extended Data Figure 4. Uracil content patterns.
a-h, U content patterns for PB2, PB1, PA, HA, NP, NA, M1/2, and NS1/2, respectively. The 95% CI of avian U content is shown for each segment with a gray rectangle. U content versus year of sampling is shown by black diamond symbols for human H1N1 and bat H17N10, magenta diamonds for equine H7N7, and solid green circles for equine H3N8. The curves fitted to the H3N8 data are shown. The equine panzootic of 1872-1873 is depicted with a vertical red line. The left dashed line corresponds to node 1 from Fig. 2, the right dashed line, node 2. P values beside the red lines reflect the tests of whether the equine H7N7 age estimates predate 1872; for HA, NA, and NS1/2 the gray rectangle depicts the 95% confidence interval for the ingroup avian data (H7, N7, and NS1/2 A lineage, respectively). Avian H3, N8, and NS1/2 lineage B U content distributions are indicated with separate arrow lines. The estimated origin dates of the equine H7N7 genes based on U content values were: PB2 1548[1533-1574]; PB1 1842[1816-1877]; PA 1819[1795-1842]; H7 1880[1878-1884]; NP 1785[1747-1823]; N7 1387[1373-1413]; M1/2 1801[1724-1879]; NS1/2 1835[1810-1861]).
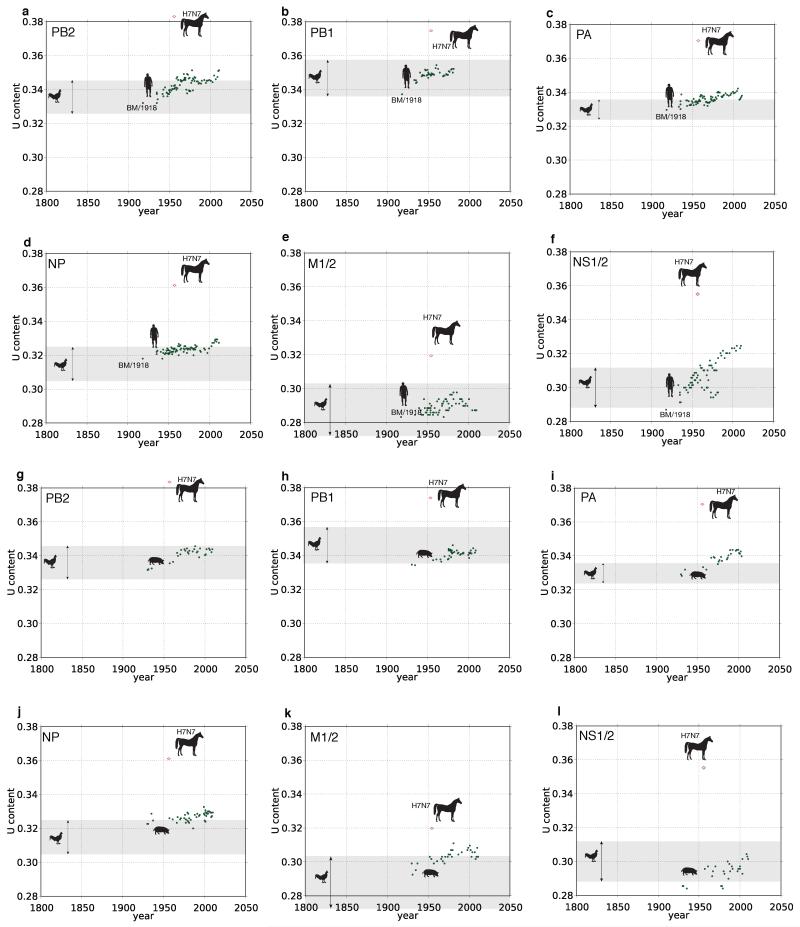
Extended Data Figure 5. Uracil content patterns for human and swine IVA internal genes.
a-f, respectively: human PB2, PB1, PA, NP, M1/2, NS1/2. g-l, respectively: swine PB2, PB1, PA, NP, M1/2, NS1/2. After nearly a century of steadily increasing U content in each of these mammalian hosts, these genes still exhibit considerably lower U content than the corresponding equine H7N7 genes.
Extended Data Figure 6. HSLC results for H1, N1, H3, and N8.
a-d, respectively: MCC trees inferred under the HSLC model and host-specific rate distributions (to the right of each tree). Trees are drawn to the same scale, with branch lengths in years. Eastern and Western Hemisphere AIV lineages are highlighted with black and gray vertical bars, respectively. Fully resolved trees including posterior probabilities for each node and 95% CIs on node dates are depicted in Fig. S1 i through l. These results suggest an avian origin of the H1 HA and N1 NA of the 1918 human pandemic virus, sometime after the human/avian MRCA in ~1893 for HA and the human/avian MRCA in ~1914 for NA. For H1, the available sample of AIV sequences coalesces in ~1952. Hence, the H1 Western and Eastern Hemisphere lineages were established very recently compared to the internal genes (Fig. 2). This means that current sampling can provide no information about the geographic origin of the HA gene of the 1918 virus. Similarly, for N1, a deep Western Hemisphere lineage shares an MRCA with the Eastern Hemisphere lineage in ~1919 (with a subsequent east-to-west dispersal in the early 1960s, indicated by a vertical arrow). Again, these data offer no insights into the geographical origin of the 1918 pandemic virus’s NA gene since the 1918 sequence is not nested within either a Western or Eastern hemisphere AIV clade as with the internal genes. If archival AIV sequences from closer to 1918 could be recovered they might resolve these geographical questions. For H3 and N8 distinct equine lineages are apparent; however, when and where they crossed from the AIV reservoir remains unclear (see the Supplementary Information for additional discussion).
Extended Data Figure 7. HA and NA genetic diversity analysis rates and dates (from Fig. 3).
a, Posterior density of substitution rates of HA and NA. b, Posterior density of TMRCA of all HA subtype and all NA subtypes. c, Within-subtype TMRCAs for each HA and NA subtype.
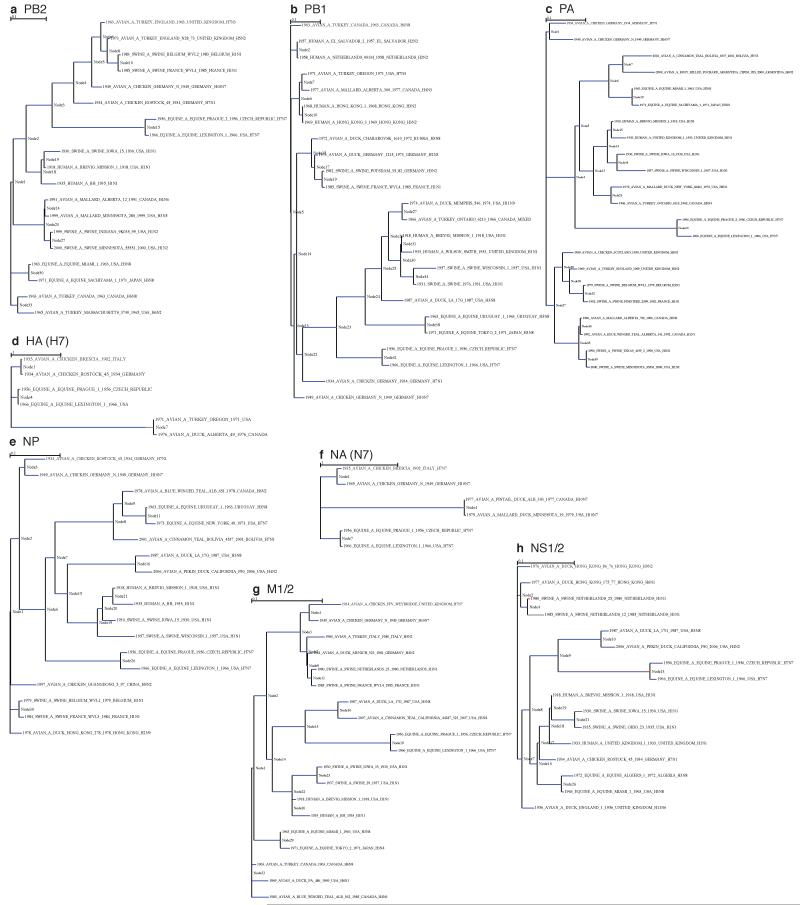
Extended Data Figure 8. Phylogenetic evidence of AIV gene flow from domestic to wild birds.
a-h, Subtrees highlighting the observation that most of the post-1940s genetic diversity within Eastern Hemisphere AIV (as well as several West-2 and West-3 lineages in the Western Hemisphere) descends from within the clade of 1920s/30s ‘fowl plague’ (HPAI) and 1940s low pathogenicity avian influenza (LPAI) avian influenza viruses from domestic birds. The major Eastern Hemisphere avian clades are collapsed for clarity and depicted as purple triangles. The brown circle depicts the MRCA of the 1920s/30s sequences from domestic birds. The blue circle represents the MRCA of the major Eastern Hemisphere AIV clade and the closest 1920s/30s virus for each gene. The A/chicken/Japan/1925 HPAI strain, which was newly sequenced for this study, is highlighted in red. These results are subtrees taken from an analysis of the Fig. 2 data set, but with the addition of the three newly-sequenced complete genomes (A/chicken/Japan/1925, A/duck/Manitoba/1953, and A/equine/Detroit/3/1964), as well as several additional South American PB1 sequences, and using an SRD06 substitution model (full trees available from http://dx.doi.org/10.5061/dryad.m04j9).
Extended Data Table 1. Dating estimates for key nodes on Figure 2 with different substitution models, subsamples of sequences, and data partitions.
| Node 1* | Node 2* | |
|---|---|---|
|
|
||
| Data set from Figure 2 (GTR model) | ||
| PB2 | 1854 [1843-1864] | 1888 [1883-1892] |
| PB1 | 1851 [1840-1860] | 1868 [1861-1875] |
| PA | 1862 [1853-1873] | 1887 [1881-1892] |
| H7 | 1854 [1839-1867] | 1880 [1868-1890] |
| NP | 1869 [1860-1879] | 1885 [1879-1891] |
| N7 | 1836 [1811-1860] | 1863 [1842-1878] |
| M1/2 | 1879 [1866-1890] | 1897 [1890-1904] |
| NS1/2 | 1862 [1845-1878] | 1899 [1886-1908] |
| Data set from Figure 2 (SRD + galliform clock) | ||
|
| ||
| PB2 | 1851 [1840-1862] | 1887 [1882-1891] |
| PB1 | 1849 [1839-1859] | 1866 [1859-1873] |
| PA | 1858 [1847-1866] | 1886 [1881-1891] |
| H7 | 1853 [1839-1867] | 1881 [1870-1891] |
| NP | 1868 [1857-1877] | 1883 [1877-1890] |
| N7 | 1843 [1819-1866] | 1866 [1848-1881] |
| M1/2 | 1876 [1863-1887] | 1897 [1891-1905] |
| NS1/2 | 1858 [1839-1874] | 1893 [1880-1905] |
| Subsampled sequences from Figure 2 data (internal genes, SRD) | ||
|
| ||
| PB2 | 1856 [1844-1868] | 1886 [1880-1892] |
| PB1 | 1853 [1842-1862] | N/A† |
| PA | 1865 [1853-1876] | 1881 [1874-1888] |
| NP | 1872 [1864-1879] | 1875 [1868-1882] |
| M1/2 | 1876 [1860-1889] | 1886 [1874-1896] |
| NS1/2 | 1846 [1821-1867] | 1886 [1870-1898] |
| Same data set as Figure 2, except using 3rd codon position sites only (SRD + galliform clock) | ||
|
| ||
| PB2 | 1856 [1848-1863] | 1881 [1873-1887] |
| PB1 | 1854 [1844-1865] | N/A† |
| PA | 1857 [1844-1869] | 1884 [1879-1890] |
| H7 | 1851 [1831-1868] | 1866 [1848-1881] |
| NP | 1870 [1861-1879] | 1883 [1875-1890] |
| N7 | 1836 [1806-1860] | 1852 [1828-1875] |
| M1/2 | 1887 [1875-1898] | 1899 [1891-1906] |
| NS1/2 | 1859 [1840-1877] | 1899 [1886-1907] |
See Fig. 2
Node not present on MCC tree
Extended Data Table 2. Complete or partial sweeps of Eastern Hemisphere-origin AIV internal genes across Western Hemisphere AIV in recent decades.
| Total No. of Western Hemisphere AIV full-length sequences, 2009-2013 |
No. in West-1 clade* | No. in West-2 clade | No. in West-3 clade | |
|---|---|---|---|---|
| PB1 | 1059 | 0 (0 %)* | 1059 (100%)† | 0 (0%)‡ |
| PA | 1052 | 1 (0.1%)* | 420 (39.9%)§ | 631 (60.0%)∥ |
| NP | 886 | 12 (1.4%)* | 863 (97.4%)¶ | N/A |
| NS1/2 | 560☆ | 6 (1.1%)* | 554 (98.9%)# | N/A |
This is the pre-20th century Western Hemisphere AIV lineage (see Fig. 2 for clade designations).
Migrated from Eastern Hemisphere after ~1945 and before ~1955.
Migrated from Eastern Hemisphere after ~1945 and before ~1960.
Migrated from Eastern Hemisphere after ~1921 and before ~1940.
Migrated from Eastern Hemisphere after ~1965 and before ~1969.
Migrated from Eastern Hemisphere after ~1940 and before ~1945.
Migrated from Eastern Hemisphere after ~1928 and before ~1940.
NS A lineage sequences only; there were an additional 262 NS B lineage sequences (30% of 822 total NS sequences).
Supplementary Material
Acknowledgements
For generous assistance in locating and sequencing A/equine/Detroit/3/1964(H7N7), A/chicken/Japan/1925(H7N7), and A/duck/Manitoba/1953(H10N7) we thank John Barnes, Sarah Meno, Michael Shaw, Ruben Donis, Scott Krauss, Kimberly Friedman, Robert Webster, Yukiko Muramoto, and Yoshihiro Kawaoka. We thank Mike Sanderson for comments on the HSLC model, Siamak Zohari for discussions of the NS A and B lineages, and Michael Nachman, Yoshihiro Kawaoka, Tom Watts, Jim Cox, Douglas Gill and three anonymous reviewers for comments. This work was supported by grants from the NIH/NIAID (R01AI084691) and the David and Lucile Packard Foundation to M.W., and the Wellcome Trust (grant no. 092807) to A.R. The research leading to these results has received funding from the European Union Seventh Framework Programme [FP7/2007-2013] under Grant Agreement no. 278433-PREDEMICS and ERC Grant agreement no. 260864.
Footnotes
The authors declare no competing financial interests.
Author Contributions M.W., G.-Z.H., and A.R. designed the study. M.W. and A.R. conceived the analytical approach, and A.R. developed the software. G.-Z.H., M.W., and A.R. prepared the data sets. M.W., G.-Z.H., and A.R. performed the phylogenetic analyses. M.W. conducted the U content analyses. M.W. and A.R wrote the paper. All authors discussed all the results and commented on the manuscript.
Author Information Gene sequences of A/equine/Detroit/3/1964(H7N7), A/chicken/Japan/1925(H7N7), and A/duck/Manitoba/1953(H10N7) have been deposited in GenBank under accession numbers KF435047-KF435062 and KF619244-KF619250.
Supplementary Information is linked to the online version of the paper at www.nature.com/nature.
REFERENCES
- 1.Morens DM, Folkers GK, Fauci AS. The challenge of emerging and re-emerging infectious diseases. Nature. 2004;430:242–249. doi: 10.1038/nature02759. [DOI] [PMC free article] [PubMed] [Google Scholar]
- 2.Parrish CR, et al. Cross-species virus transmission and the emergence of new epidemic diseases. Microbiol. Mol. Biol. Rev. 2008;72:457–470. doi: 10.1128/MMBR.00004-08. [DOI] [PMC free article] [PubMed] [Google Scholar]
- 3.Holmes EC. The Evolution and Emergence of RNA Viruses. Oxford University Press; New York: 2009. [Google Scholar]
- 4.Webster RG, Bean WJ, Gorman OT, Chambers TM, Kawaoka Y. Evolution and ecology of influenza A viruses. Microbiol. Rev. 1992;56:152–179. doi: 10.1128/mr.56.1.152-179.1992. [DOI] [PMC free article] [PubMed] [Google Scholar]
- 5.Fitch WM, Bush RM, Bender CA, Cox NJ. Long term trends in the evolution of H(3) HA1 human influenza type A. Proc. Natl Acad. Sci. USA. 1997;94:7712–7718. doi: 10.1073/pnas.94.15.7712. [DOI] [PMC free article] [PubMed] [Google Scholar]
- 6.Rambaut A, et al. The genomic and epidemiological dynamics of human influenza A virus. Nature. 2008;453:615–619. doi: 10.1038/nature06945. [DOI] [PMC free article] [PubMed] [Google Scholar]
- 7.Dugan VG, et al. The evolutionary genetics and emergence of avian influenza viruses in wild birds. PLoS Pathog. 2008;4:e1000076. doi: 10.1371/journal.ppat.1000076. [DOI] [PMC free article] [PubMed] [Google Scholar]
- 8.Chen R, Holmes EC. Hitchhiking and the population genetic structure of avian influenza virus. J. Mol. Evol. 2010;70:98–105. doi: 10.1007/s00239-009-9312-8. [DOI] [PMC free article] [PubMed] [Google Scholar]
- 9.Drummond AJ, Ho SYW, Phillips MJ, Rambaut A. Relaxed Phylogenetics and Dating with Confidence. PLoS Biol. 2006;4:e88. doi: 10.1371/journal.pbio.0040088. [DOI] [PMC free article] [PubMed] [Google Scholar]
- 10.Sovinova O, Tumova B, Poutska F, Nemec J. Isolation of a virus causing respiratory disease in horses. Acta Virol. 1958;2:52–61. [PubMed] [Google Scholar]
- 11.Morens DM, Taubenberger JK. Historical thoughts on influenza viral ecosystems, or behold a pale horse, dead dogs, failing fowl, and sick swine. Influenza Other Respi. Viruses. 2010;4:327–337. doi: 10.1111/j.1750-2659.2010.00148.x. [DOI] [PMC free article] [PubMed] [Google Scholar]
- 12.Judson AB. History and Course of the Epizoötic among Horses upon the North American Continent in 1872-73. Public Health Pap. Rep. 1873;1:88–109. [PMC free article] [PubMed] [Google Scholar]
- 13.Morens DM, Taubenberger JK. An avian outbreak associated with panzootic equine influenza in 1872: an early example of highly pathogenic avian influenza? Influenza Other Respi. Viruses. 2010;4:373–377. doi: 10.1111/j.1750-2659.2010.00181.x. [DOI] [PMC free article] [PubMed] [Google Scholar]
- 14.Rabadan R, Levine AJ, Robins H. Comparison of avian and human influenza A viruses reveals a mutational bias on the viral genomes. J. Virol. 2006;80:11887–11891. doi: 10.1128/JVI.01414-06. [DOI] [PMC free article] [PubMed] [Google Scholar]
- 15.Perroncito E. Epizoozia tifoide nei gallinacei. Annali della Reale Accademia d’Agricoltura di Torino. 1878;21:87–126. [Google Scholar]
- 16.Kaleta EF, Rülke CPA. The beginning and spread of fowl plague (H7 high pathogenicity avian influenza) across Europe and Asia (1878-1955) In: Swayne DE, editor. Avian Influenza. Blackwell Publishing; Iowa: 2008. [Google Scholar]
- 17.Smith GJD, et al. Dating the emergence of pandemic influenza viruses. Proc. Natl. Acad. Sci. USA. 2009;106:11709–11712. doi: 10.1073/pnas.0904991106. [DOI] [PMC free article] [PubMed] [Google Scholar]
- 18.Scholtens RG, Steele JH. U.S. epizootic of equine influenza, 1963: Epizootiology. Public Health Rep. 1964;79:393–398. [PMC free article] [PubMed] [Google Scholar]
- 19.Treanor JJ, Snyder MH,, London WT, Murphy BR. The B allele of the NS gene of avian influenza viruses, but not the A allele, attenuates a human influenza A virus for squirrel monkeys. Virology. 1989;171:1–9. doi: 10.1016/0042-6822(89)90504-7. [DOI] [PubMed] [Google Scholar]
- 20.Barton NH. Genetic hitchhiking. Phil. Trans.R. Soc. Lond. B. 2000;355:1553–1562. doi: 10.1098/rstb.2000.0716. [DOI] [PMC free article] [PubMed] [Google Scholar]
- 21.Tong S, et al. A distinct lineage of influenza A virus from bats. Proc. Natl. Acad. Sci. USA. 2012;109:4269–4274. doi: 10.1073/pnas.1116200109. [DOI] [PMC free article] [PubMed] [Google Scholar]
- 22.Tong S, et al. New World bats harbor diverse influenza A viruses. PLoS Pathog. 2013;9:e1003657. doi: 10.1371/journal.ppat.1003657. [DOI] [PMC free article] [PubMed] [Google Scholar]
- 23.Drummond AJ, Suchard MA, Xie D, Rambaut A. Bayesian phylogenetics with BEAUti and the BEAST 1.7. Mol. Biol. Evol. 2012;29:1969–1973. doi: 10.1093/molbev/mss075. [DOI] [PMC free article] [PubMed] [Google Scholar]
- 24.Hasegawa M, Kishino H, Yano T. Estimation of branching dates among primates by molecular clocks of nuclear DNA which slowed down in Hominoidea. J. Hum. Evol. 1989;18:461–476. [Google Scholar]
- 25.Rambaut A, Bromham L. Estimating divergence dates from molecular sequences. Mol. Biol. Evol. 1998;15:442–448. doi: 10.1093/oxfordjournals.molbev.a025940. [DOI] [PubMed] [Google Scholar]
- 26.Yoder AD, Yang Z. Estimation of primate speciation dates using local molecular clocks. Mol. Biol. Evol. 2000;17:1081–1090. doi: 10.1093/oxfordjournals.molbev.a026389. [DOI] [PubMed] [Google Scholar]
- 27.Rambaut A, Grassly NC. Seq-Gen: An application for the Monte Carlo simulation of DNA sequence evolution along phylogenetic trees. Comput. Appl. Biosci. 1997;13L:235–238. doi: 10.1093/bioinformatics/13.3.235. [DOI] [PubMed] [Google Scholar]
- 28.Tavaré S. Some Probabilistic and Statistical Problems in the Analysis of DNA Sequences. Lect. Math. Life Sci. 1986;17:57–86. [Google Scholar]
- 29.Yang Z. Maximum-likelihood estimation of phylogeny from DNA sequences when substitution rates differ over sites. Mol. Biol. Evol. 1993;10:1396–401. doi: 10.1093/oxfordjournals.molbev.a040082. [DOI] [PubMed] [Google Scholar]
- 30.Minin VN, Bloomquist EW, Suchard MA. Smooth skyride through a rough skyline: Bayesian coalescent-based inference of population dynamics. Mol. Biol. Evol. 2008;25:1459–1471. doi: 10.1093/molbev/msn090. [DOI] [PMC free article] [PubMed] [Google Scholar]
- 31.Bao Y, et al. The influenza virus resource at the National Center for Biotechnology Information. J. Virol. 2008;82:596–601. doi: 10.1128/JVI.02005-07. http://www.ncbi.nlm.nih.gov/genomes/FLU/ [DOI] [PMC free article] [PubMed] [Google Scholar]
- 32.Keawcharoen J, et al. Avian influenza H5N1 in tigers and leopards. Emerg. Infect. Dis. 2004;10:2189–2191. doi: 10.3201/eid1012.040759. [DOI] [PMC free article] [PubMed] [Google Scholar]
- 33.Edgar RC. MUSCLE: multiple sequence alignment with high accuracy and high throughput. Nucleic. Acids. Res. 2004;32:1792–1797. doi: 10.1093/nar/gkh340. [DOI] [PMC free article] [PubMed] [Google Scholar]
- 34.Tamura K, et al. MEGA5: molecular evolutionary genetics analysis using maximum likelihood, evolutionary distance, and maximum parsimony methods. Mol. Biol. Evol. 2011;28:2731–2739. doi: 10.1093/molbev/msr121. [DOI] [PMC free article] [PubMed] [Google Scholar]
- 35.Han GZ, Worobey M. Homologous recombination in negative sense RNA viruses. Viruses. 2011;3:1358–1373. doi: 10.3390/v3081358. [DOI] [PMC free article] [PubMed] [Google Scholar]
- 36.Martin DP, et al. RDP3: a flexible and fast computer program for analyzing recombination. Bioinformatics. 2010;26:2462–2463. doi: 10.1093/bioinformatics/btq467. [DOI] [PMC free article] [PubMed] [Google Scholar]
- 37.Smith GJD, et al. Origins and evolutionary genomics of the 2009 swine-origin H1N1 influenza A epidemic. Nature. 2009;459:1122–1126. doi: 10.1038/nature08182. [DOI] [PubMed] [Google Scholar]
- 38.Crawford PC, et al. Transmission of equine influenza virus to dogs. Science. 2005;310:482–5. doi: 10.1126/science.1117950. [DOI] [PubMed] [Google Scholar]
- 39.Palese P, Nakajima K, Desselberger U. Recent human influenza A (H1N1) viruses are closely related genetically to strains isolated in 1950. Nature. 1978;274:334–339. doi: 10.1038/274334a0. [DOI] [PubMed] [Google Scholar]
- 40.Shapiro B, Rambaut A, Drummond AJ. Choosing appropriate substitution models for the phylogenetic analysis of protein-coding sequences. Mol. Biol. Evol. 2006;23:7–9. doi: 10.1093/molbev/msj021. [DOI] [PubMed] [Google Scholar]
- 41.Swofford DL. PAUP*. Phylogenetic Analysis Using Parsimony (*and Other Methods). Version 4. Sinauer Associates; Massachusetts: 2003. [Google Scholar]
- 42.Drummond AJ, et al. Geneious v5.4. 2011 Available from http://www.geneious.com.
- 43.Pond SLK, et al. A random effects branch-site model for detecting episodic diversifying selection. Mol. Biol. Evol. 2011;28:3033–3043. doi: 10.1093/molbev/msr125. [DOI] [PMC free article] [PubMed] [Google Scholar]
- 44.Fries AC, et al. Evidence for the circulation and inter-hemispheric movement of the H14 subtype influenza A virus. PLoS ONE. 2013;8:e59216. doi: 10.1371/journal.pone.0059216. [DOI] [PMC free article] [PubMed] [Google Scholar]
- 45.Zhou B, et al. Single-reaction genomic amplification accelerates sequencing and vaccine production for classical and Swine origin human influenza a viruses. J. Virol. 2009;83:10309–10313. doi: 10.1128/JVI.01109-09. [DOI] [PMC free article] [PubMed] [Google Scholar]
Associated Data
This section collects any data citations, data availability statements, or supplementary materials included in this article.


