

Abstract
Study Objectives:
Sleep has been hypothesized to globally reduce synaptic strength. However, recent findings suggest that in the context of learning and memory consolidation, sleep may promote synaptic potentiation. We tested the requirement for sleep in a naturally occurring form of experience-dependent synaptic potentiation in the adult mouse visual cortex (V1), which is initiated by patterned visual experience.
Design:
Visual responses were recorded in individual V1 neurons before and after presentation of an oriented grating stimulus, and after subsequent sleep or sleep deprivation.
Measurements and Results:
We find that V1 response potentiation—associated with a shift in orientation preference in favor of the presented stimulus—occurs only after sleep and only during the entrained circadian sleep phase, and is blocked by sleep deprivation. Induction of plasticity following stimulus presentation is associated with an increase in principal neuron firing in V1, which is present in all behavioral states and occurs regardless of time of day. Sleep dependent potentiation is proportional to phase-locking of neuronal activity with thalamocortical spindle oscillations.
Conclusions:
Our results suggest that sleep can promote cortical synaptic potentiation in vivo, and that this potentiation may be mediated by slow wave sleep spindles.
Citation:
Aton SJ, Suresh A, Broussard C, Frank MG. Sleep promotes cortical response potentiation following visual experience. SLEEP 2014;37(7):1163-1170.
Keywords: in vivo recording, sleep, synaptic plasticity, thalamocortical oscillations, visual system
INTRODUCTION
Data from humans and animals support a role for sleep in synaptic plasticity and cognitive function.1,2 One influential hypothesis is that sleep globally reduces synaptic strength to offset net synaptic potentiation induced by waking experience,3 and abundant recent data support synaptic weakening during sleep.4–6 This mechanism has been widely proposed as a cellular substrate for sleep dependent learning and memory consolidation7,8; however, such reductions in synaptic strength have not been demonstrated in the context of active sleep dependent memory consolidation or experience-dependent circuit plasticity. Recent in vivo studies have shown that, counter to this hypothesis, cortical somatosensory responses are enhanced after sleep,9 and that synaptic potentiation in the developing visual cortex occurs specifically during sleep.10 Thus in some contexts, sleep appears to strengthen synapses, and this process may promote sleep dependent learning and memory consolidation. To further explore the role of sleep in experience-dependent synaptic remodeling, we examined a naturally occurring form of plasticity mediated by potentiation of cortical synapses in vivo. In adult mice, brief exposure to a visual stimulus (phase-reversing, oriented gratings) results in enhanced cortical (V1) responses to stimuli of the same orientation (orientation-specific response potentiation [OSRP]),11 OSRP is considered an in vivo form of long-term potentiation (LTP) of glutamatergic synapses in V1; it requires the same cellular mechanisms as LTP.11 OSRP and thalamocortical LTP (induced by tetanus in vivo) are mutually occluding; induction of OSRP leads to a reduction in the magnitude of LTP that can be induced subsequently, and vice versa.12 Taken together, these data suggest that the two phenomena (OSRP and thalamocortical LTP) share the same mechanistic basis (namely, strengthening of thalamocortical synapses within V1). Although the orientation preference changes induced by stimulus presentation are not immediately measurable, but rather are consolidated over subsequent hours,11 it is unclear whether OSRP consolidation, like some forms of memory consolidation,1 relies on sleep behavior. Here we directly measured OSRP-associated response changes in individual V1 neurons in freely-behaving mice following presentation of a visual stimulus to induce OSRP, post-stimulus sleep, or sleep deprivation, and at different points in the daily rest/activity cycle. We also assessed how ongoing V1 neuronal firing and thalamocortical network activity were affected by visual experience and subsequent sleep.
MATERIALS AND METHODS
Housing Conditions and Animal Husbandry
All animal husbandry and surgical/experimental procedures were approved by the University of Pennsylvania Institutional Animal Care and Use Committee's board for animal care and use. Unless otherwise noted, mice were kept on a 12 h:12 h light:dark cycle (lights on at 07:00), and were given food and water ad libitum.
Implantation of Stereotrode Microdrives
At age 2-6 mo, male C57Bl/6j mice (Charles River) were implanted with custom-built, driveable headstages (EIB-36, Neuralynx) under isoflurane anesthesia, using previously described techniques.13 Each headstage was composed of two bundles (each approximately 200 mm in diameter, spaced 1-2 mm apart) of seven stereotrodes each (25-mm nichrome wire, California Fine Wire; Grover Beach, CA) placed within the right hemisphere primary visual cortex (contralateral to the visual hemifield in which stimuli were presented for OSRP induction). Reference and ground electrodes (silver-plated copper wire, Alpha Wire; Elizabeth, NJ) were placed over the left hemisphere primary visual cortex and cerebellum, respectively, and three electromyography (EMG) electrodes (braided stainless-steel wire, Cooner Wire; Chatsworth, CA) were placed deep in the nuchal muscle.
Recording Procedures
Chronic stereotrode recording was carried out using general procedures described previously.13 After 1-2 weeks of postoperative recovery, implanted mice were placed in a lightproof, illuminated sleep-recording chamber, and headstages were connected to a lightweight cable and commutator to record neural signals. Signals from each electrode were split and differentially filtered to obtain spike data (150 Hz to 9 kHz) and local field potential/electroencephalographic data (LFP/EEG; 0.1 Hz-300 Hz) at each recording site. Data were amplified in two stages (at 20× and 50×), digitized, and recorded at 40 kHz using Plexon MAP hardware and RASPUTIN software (Plexon Inc; Dallas, TX).
Stereotrode bundles were advanced into the cortex in 10-to 20-μm steps until stable neuronal recordings (with similar spike waveforms continuously present for > 24 h) could be maintained. Once stable recordings were obtained, the head-stages were no longer moved. Mice were habituated to gentle handling procedures associated with sleep deprivation14 and restraint procedures for visual stimulus presentation (see next paragraphs) for 3 days prior to recording.
Single-Unit Discrimination and Classification
Single-neuron data were discriminated offline using standard principle-component based procedures (Offline Sorter; Plexon, Inc; Figure 1). Neurons were classified as either fastspiking (FS) interneurons or non-fastspiking (putative principal) neurons using standard procedures,13 on the basis of their interspike interval (ISI) distribution and spike waveform durations (i.e., width at half-maximal amplitude).6,15 FS neurons were characterized by short spike duration (< 0.25 ms at half-maximal amplitude) and a highly regular ISI distribution (without repetitive bursting), peaking at ≤ 20 ms on average.6,16
Figure 1.
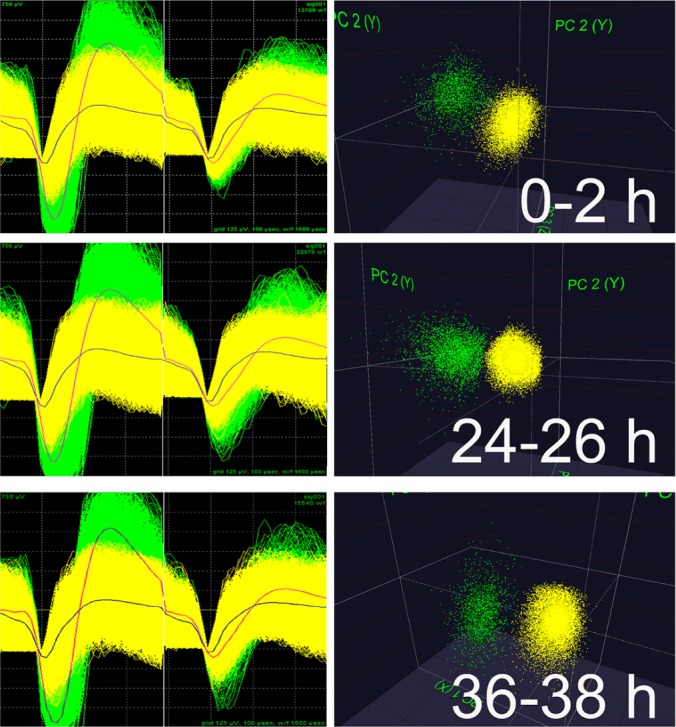
Spike data from continuously-recorded V1 neurons. Data are shown for two representative neurons recorded on the same stereotrode at baseline (0-2 h), following presentation of a stimulus to induce orientation-specific response potentiation (24-26 h) and following a 12-h poststimulus ad libitum sleep period (36-38 h). Spike waveform shape, relative spike amplitude on the two stereotrode wires, and clusters of spike data in three-dimensional principal component space are stable for the two neurons throughout the recording.
Individual neurons were tracked throughout each experiment on the basis of spike waveform, relative spike amplitude on the two stereotrode recording wires, and neuronal subclass (e.g., FS versus principal; Figure 1). Within each experiment, only those neurons that were verifiably recorded throughout the entire experiment (i.e., those that were recorded throughout baseline, visual experience, and subsequent sleep recording) were included in analyses of OSRP and ongoing network activity.
Experimental Design
In experiment 1, mice were randomly assigned to either sleeping or sleep deprivation conditions (n = 4 and 3 mice, respectively) as shown in Figure 2A. These numbers compare favorably with group sizes used in two recent studies using chronic recording techniques (which used groups of four and two animals, respectively).17,18 In experiment 2, mice were assigned to either morning or evening OSRP induction conditions (n = 4 mice/group) as shown in Figure 3A to (1) assess time-of-day effects on OSRP, and (2) control for nonspecific (e.g., stress-related) effects of experimental sleep deprivation in experiment 1. Additional mice in experiment 2 underwent sleep deprivation following morning OSRP induction (n = 4 and 3 mice, respectively, for sleep deprivation over the first or second half of the circadian day). As an additional control (to assess potential recovery of OSRP after additional postdeprivation recovery sleep), mice were sleep deprived over the first half of the circadian day, immediately following OSRP induction, and OSRP was assessed 24 h later (n = 3 mice per group—one with and one without sleep deprivation).
Figure 2.

Orientation-specific response potentiation (OSRP) is consolidated during poststimulus sleep. (A) V1 neurons were recorded across a baseline period of ad libitum sleep and wakefulness, a 1-h period of oriented grating stimulus presentation in the awake mouse (starting at lights-on), and a 6-h period of either ad libitum sleep or sleep deprivation in the dark. Visual responses were recorded during presentation of a series of gratings (four orientations plus a blank screen) in the contralateral visual field at the intervals indicated (arrows): timepoint A, after baseline recording; timepoint B, after stimulus presentation; and timepoint C, after subsequent ad libitum sleep or timepoint D, sleep deprivation. (B) Representative visual response data for two V1 neurons recorded the same experiment, in mice from either sleeping (left) or sleep deprived (right) groups. In each graph, mean firing rate responses of a single neuron are shown for each of the four stimulus orientations and for blank screen presentation, at each of three intervals (timepoints A, B, and either C or D). The orientation of the stimulus presented to induce OSRP for both neurons recorded from each experiment is indicated in the upper graphs (arrows). Relative firing rate responses increased for the orientation of the presented stimulus in sleeping mice (left, data shown in blue) but not in sleep deprived mice (right, data shown in red). These orientation-specific response changes were quantified as a measure of OSRP (see Materials and Methods). (C) Orientation preference for the presented stimulus did not change after 1-h stimulus presentation, but was enhanced after subsequent sleep in both non-fast spiking (principal) neurons and in fast spiking (FS) interneurons. OSRP was blocked by sleep deprivation. *P < 0.05, Holm-Sidak post hoc test. (D) OSRP was proportional to sleep time, and negatively correlated with wakefulness.
Figure 3.

Orientation-specific response potentiation (OSRP) occurs specifically during the entrained circadian sleep phase. (A) Grating stimuli were presented to induce OSRP at the time of either lights-on (AM) or lights-off (PM). Visual responses to oriented gratings were recorded just before stimulus presentation, and again 12 h later. In both cases, mice were entrained to a 12 h:12 h light:dark cycle prior to OSRP induction, but were kept in complete darkness over the next 12 h to eliminate effects of patterned vision on OSRP consolidation. OSRP consolidation was tested across the day/sleep phase (AM, blue) or across the night/active phase (PM, red). Two additional groups of mice had OSRP assessed across the sleep phase, with sleep deprivation during either the first (AM + early sleep dep, green) or second (AM + late sleep dep, yellow) half of the circadian day. (B) Firing rate response data for two V1 neurons recorded from representative mice in either AM or PM stimulus conditions. In each graph, mean firing rate responses of a single neuron are shown for each of the four stimulus orientations and for blank screen presentation, at two intervals: after baseline, and 12 h later (after ad libitum sleep). The orientation of the stimulus presented to induce OSRP for both neurons recorded from each experiment is indicated in the upper graphs (arrows). Relative firing rate responses increased for the orientation of the presented stimulus in AM mice (left, data shown in blue) but not in PM mice (right, data shown in red). (C) V1 neurons showed OSRP following AM stimulus presentation, but not PM stimulus presentation. Sleep deprivation during either half of the circadian day blocked OSRP. (D) Across the four experimental groups, OSRP was proportional to sleep time, and negatively correlated with wakefulness.
Visual Stimulus Presentation and Visual Response Testing
Mice were gently restrained during visual stimulus presentation, using a combination of head fixation and a commercial harness (Kent Scientific; Torrington, CT) for upper body restraint. Each mouse was habituated to handling and restraint procedures for a minimum of 3 days prior to experimental testing. Stimuli (composed of phase-reversing oriented gratings [0.05 cycles/degree, reversing at 1 Hz])11 were presented to the left eye (in the hemifield contralateral to the implanted visual cortex) on a 30-inch LED backlit monitor positioned 30 cm in front of the mouse. For each visual response test, phase reversing gratings of four orientations (plus a blank screen to assess spontaneous activity) were randomly presented 8 × 10 sec each, in an interleaved manner. The visual stimulus used to induce OSRP was a grating of a single orientation (chosen at random), presented continuously for 1 h.
For initial tests for sleep dependence, visual responses were tested at three intervals: after baseline recording, after 1-h visual stimulus presentation, and after 6 h of subsequent sleep or sleep deprivation. For subsequent tests assessing time-of-day effects on OSRP, visual responses were assessed 12 h apart, at lights on and lights off (07:00 and 19:00). In two additional control groups (to assess potential recovery of OSRP after additional postdeprivation recovery sleep), visual responses were assessed 24 h apart, at lights on.
Orientation preference for each neuron was quantified as the ratio of mean firing rate responses for stimulus blocks of the same orientation used to induce OSRP and for stimulus blocks of the orthogonal orientation (i.e., X°/[X + 90°]), as described previously.11 For analysis of the direction of changes in orientation preference (i.e., enhanced versus decreased preference for the stimulus orientation), changes in this measure from baseline were quantified after stimulus versus after poststimulus sleep or sleep deprivation (Table 1). The proportion of neurons expressing either a negative or positive change in orientation preference (i.e., a > 10% difference from baseline) was quantified at each interval. Any neurons showing a negative or positive change from baseline of < 10% were considered to have no change in orientation preference.
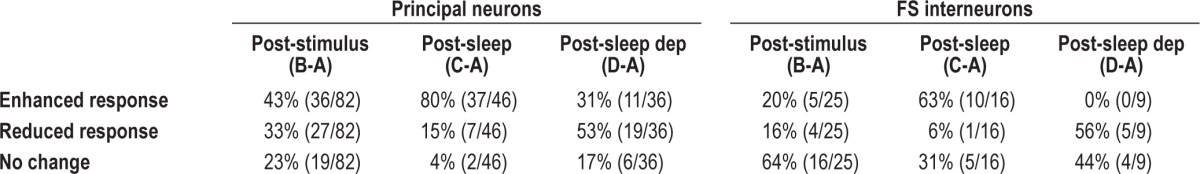
Table 1.
Distribution of response changes for principal neurons and FS interneurons recorded in experiments outlined in Figure 2
The magnitude of stimulus-evoked visual responsiveness was quantified as the evoked responsiveness index (ERI)10—the ratio of each neuron's maximal (i.e., preferred orientation) firing rate response versus spontaneous firing rate (during blank screen presentation). This value provided an additional measure of response changes initiated by visual stimulus presentation. Rather than quantifying orientation preference changes, the ERI provides a measure of the “dynamic range” of visual responses which can be evoked by stimuli at different time points.
Firing Rate and LFP Analysis
For each reliably discriminated neuron, mean firing rates were calculated separately within each behavioral state (rapid eye movement [REM], slow wave sleep [SWS], and wakefulness) across the 24-h baseline period. Firing rate changes after OSRP induction were then expressed as a percentage of baseline. LFP power in 0.5-4 Hz (delta), 7-14 Hz (spindle), or 20-50 Hz (gamma) frequency bands was quantified from raw LFP traces as a percent of total power across baseline; changes in LFP power following OSRP induction were expressed as a percent of baseline. For coherence analysis, LFP signals were band-pass filtered at either: 0.5-4 Hz (delta), 7-14 Hz (spindle), or 20-50 Hz (gamma). Mean spike-field coherence in each state was calculated using Neuroexplorer software (Plexon, Inc).
Sleep Recording, Sleep/Wake Analysis, and Sleep Deprivation
Behavioral states were recorded continuously over a 24-h baseline period (with mice maintained on a 12 h:12 h light:dark cycle) prior to the first (baseline) visual response test and subsequent stimulus presentation for OSRP induction. Following stimulus presentation, mice were kept in complete darkness over the next 6-12 h, to prevent further visual experience. Sleep deprivation during the circadian day was carried out in the dark (under infrared illumination) using a combination of gentle handling techniques such as cage-tapping, disruption of nest material, and if necessary, gently stroking mice with a cotton-tipped applicator to prevent sleep. This sleep deprivation technique has been shown previously to effectively reduce sleep behavior for up to 12 h without significantly increasing plasma corticosterone levels (a marker of the acute stress response in rodents).14,19
Intracortical LFP and nuchal EMG signals were used to assign polysomnographic data into periods of REM sleep, SWS, and waking states using NeuroExplorer software (Plexon, Inc) as described previously.13 The proportion of time spent in REM, SWS, and waking (and mean bout duration for each state) was calculated during the poststimulus period using standard conventions.13
Lesioning and Laminar Analysis of Recording Sites
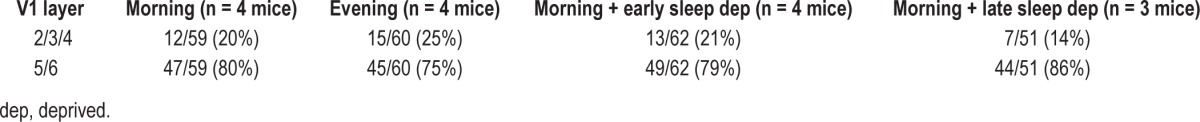
At the end of recordings, mice were anesthetized with isoflurane and all electrode sites were lesioned (2 mA, 3 sec per wire), after which mice were euthanized and perfused with formalin. The visual cortex was postfixed and sectioned at 50 μm for cresyl violet staining and reconstruction of electrode bundle recording sites, using previously described procedures.13 In all experimental groups, the majority of neurons were recorded from infragranular layers (i.e., 5/6; Tables 2 and 3). Proportions of neurons recorded at infragranular versus extragranular/granular layers (i.e., 2/3/4) were similar across experimental groups.
Table 2.
Laminar distribution of neurons recorded in experiments outlined in Figure 2
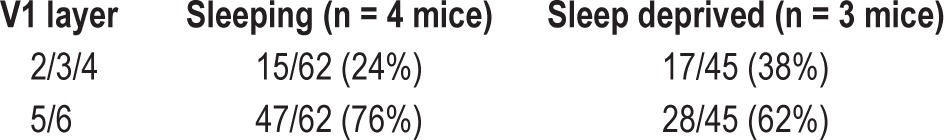
Table 3.
Laminar distribution of neurons recorded in experiments outlined in Figure 3
RESULTS
To test how OSRP is affected by sleep, we recorded visual responses and spontaneous activity longitudinally from individual V1 neurons in adult mice13 (Figure 1). For experiment 1, recordings spanned a 24-h baseline, 1 h of continuous stimulus presentation in the awake mouse to induce OSRP (beginning at lights on), and a subsequent 6-h consolidation interval in complete darkness, with either ad libitum sleep, or experimental sleep deprivation (Figure 2A). Orientation preference was assessed for each neuron at three time points: after baseline recording, immediately after stimulus presentation, and after the 6-h consolidation interval (Figure 2B). Changes in preference for the stimulus orientation (from baseline) were then calculated for each neuron as a measure of OSRP. For both principal neurons and FS interneurons, OSRP was only evident after subsequent sleep, and was blocked by sleep deprivation (Figure 2C). This was evident not only in comparing the average orientation preference changes across experiment 1, but also in comparing the distribution of neurons exhibiting increases versus decreases in preference for the presented stimulus (Table 1). For example, immediately after stimulus presentation, roughly equal proportions (43% versus 33%) of principal neurons showed enhancements versus reductions in preference for the presented stimulus orientation, and a sizable proportion (23%) showed no significant change in orientation preference. Following poststimulus sleep, the proportion of principal neurons with enhanced preference for the stimulus orientation had increased to 80%. In contrast, after sleep deprivation, only 31% of principal neurons showed an enhanced preference for the stimulus orientation, whereas 53% showed a reduced preference. Similar changes were seen among FS interneurons after sleep versus sleep deprivation (Table 1). Total OSRP (averaged across all neurons recorded from each mouse) correlated positively with the amount of time mice spent in SWS and REM sleep across the 6-h poststimulus period, and negatively with time spent in wakefulness (Figure 2D).
To further clarify the relationship between sleep and OSRP, in experiment 2 we carried out an additional set of recordings in which 1-h visual stimulus was presented to groups of mice at either lights-on (morning, AM) or lights-off (evening, PM), and orientation preference was assessed 12 h later (Figure 3A, 3B). This design took advantage of the natural daily rhythm in murine sleep behavior, allowing us to directly compare the effects of experimental sleep deprivation with the normal reductions in mouse sleep time that occurs during the night (active phase). Both principal neurons and FS interneurons showed significant OSRP across the sleep phase (after morning stimulus presentation), but showed no OSRP across the active phase (after evening presentation; Figure 3C). Thus controlling for any nonspecific (e.g., stress-related) effects associated with experimental sleep deprivation, OSRP consolidation was reduced when sleep behavior was reduced. To control for the acute effects of experimental sleep deprivation on OSRP expression, mice underwent 6-h sleep deprivation across either the first half or the second half of the sleep phase (after morning stimulus presentation; morning + early sleep deprivation or morning + late sleep deprivation, respectively). OSRP was blocked equally by sleep-depriving mice during either the first half or the second half of the day. Across these experimental groups, OSRP again correlated positively with time spent in sleep across the 12-h post-stimulus period, and negatively with time spent in wakefulness (Figure 3D).
As an additional control, mice were allowed additional recovery time following morning + early sleep deprivation treatment, with OSRP assessed 24 h following morning stimulus presentation. In mice allowed ad libitum sleep following morning stimulus, OSRP was measureable 24 h later, whereas in mice sleep deprived across the first half of the sleep phase, OSRP was blocked. Changes in orientation-specific response of 14.0 ± 3.7% (mean ± standard error of the mean) were recorded across a 24-h interval for neurons from freely sleeping mice (values comparable to OSRP seen across a 12-h interval after AM stimulus presentation; see Figure 3C). In contrast, neurons recorded from sleep deprived mice underwent orientation-specific response changes of -7.6 ± 6.7% (values comparable to changes seen after sleep deprivation followed by no, or more brief, recovery sleep; see Figure 2C and Figure 3C; P < 0.005 for sleeping versus sleep deprived mice, Student t-test).
Because OSRP is mediated by the same cellular mechanisms as LTP, we were interested in determining how neuronal activity was affected by visual stimulus presentation. We found that for several hours following either morning or evening stimulus presentation (but not presentation of a blank screen without oriented gratings Figure 4), firing rates among V1 principal neurons increased dramatically. Average firing rate increases of 40-60% were present in all states (SWS, REM, and wakefulness). In contrast, FS interneurons showed no significant firing rate changes.
Figure 4.
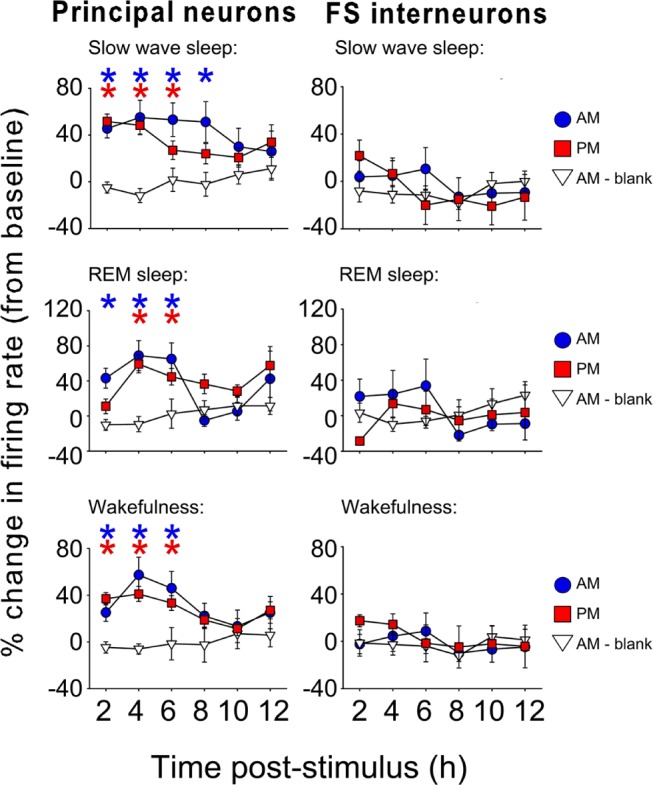
Principal neuron firing increases after orientation-specific response potentiation induction. For the first several hours after either lights-on or AM (blue circles) or lights-our or PM (red squares) stimulus presentation, firing rates among principal neurons were significantly increased (* P < 0.05 versus 24-h average across baseline recording, and versus control mice [white triangles] presented with a blank screen at lights on). There were no significant changes in fastspiking interneuron activity.
In the developing cat V1, sleep dependent plasticity encompasses not only shifts in visual tuning properties, but also enhanced evoked visual responsiveness. This measurement provides an additional metric of how neurons respond to stimuli (i.e., the “dynamic range” of response magnitudes they can generate) in addition to the changes in orientation preference described above (which assess what stimuli neurons respond to). Visual responsiveness is quantified as ERI—the ratio of the maximal firing rate response evoked by any stimulus vs. spontaneous firing rate among V1 neurons.10 We found that sleep dependent OSRP was associated with enhanced ERIs in V1 neurons (Figure 5A, 5B). ERI potentiation and other response changes in the cat visual system are proportional to synchronization of neuronal firing to local SWS oscillations.13 We therefore assessed whether OSRP and ERI potentiation are related to changes in the coherence of neuronal firing with SWS oscillations. We saw no change in neuronal firing coherence with SWS delta (0.5-4 Hz) oscillations after induction of OSRP, but significantly increased coherence with SWS spindle (7-14 Hz) oscillations (Figure 5C). Among V1 recording sites, both OSRP and ERI potentiation were proportional to the coherence of neuronal firing with local SWS spindle oscillations in the hours after stimulus presentation (Figure 5D). Firing coherence with other sleep oscillations (e.g., REM gamma oscillations or SWS delta oscillations) showed no relationship to OSRP or ERI changes.
Figure 5.
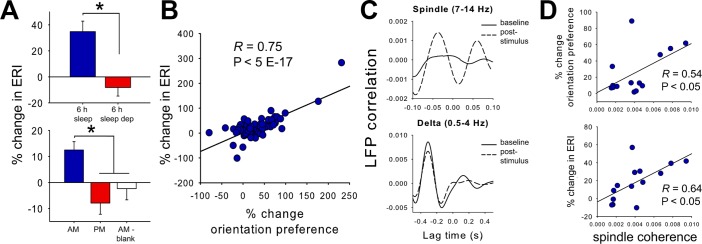
Potentiation of visual responsiveness during orientation-specific response potentiation (OSRP) is proportional to slow wave sleep (SWS) spindle spike-field coherence. (A) Visual responsiveness (expressed as the evoked responsiveness index [ERI]) was enhanced after poststimulus sleep and blocked by poststimulus sleep deprivation (top). ERI increases were present across lights-on or AM stimulus experiments, but not evening or lights out or PM or AM-blank screen experiments (bottom). Values indicate mean ± standard error of the mean for all neurons (fastspiking interneurons + principal neurons). (B) For all freely sleeping mice (in experiments shown in Figure 2A and Figure 3A), ERI changes were proportional to OSRP (% change from pre-stimulus baseline shown). (C) SWS spike-field correlations between firing in a representative V1 neuron and local field potential (LFP) spindle and delta oscillatory activity are shown at baseline (solid lines), and in the first 2 h following stimulus presentation (dashed lines). Although synchrony (coherence) of firing with delta oscillations was not significantly changed after OSRP induction, coherence with spindle oscillations increased significantly during OSRP consolidation. (D) Among freely sleeping mice, mean response changes at each recording site (i.e., stereotrode bundle) were proportional to mean SWS spindle coherence across the poststimulus recording period.
DISCUSSION
Our results show that, similar to mechanisms for hippocampal-based memory20–22 and ocular dominance plasticity in the developing cat cortex,10,13 V1 orientation-specific response potentiation (OSRP): (1) is associated with neuronal potentiation, (2) requires sleep, and (3) involves a transient (experience-dependent) increase in neuronal activity/excitability, and phase-locking of neuronal firing with thalamocortical oscillations.
Previous studies have shown that OSRP (as measured by orientation-specific increases in V1 visually evoked potentials) relies on the same synaptic mechanisms as LTP (i.e., kinasedependent delivery of glutamatergic receptors to the postsynaptic density), and occludes thalamocortical LTP in vivo.11,12 Our current data support the role of synaptic potentiation in OSRP. Increases in evoked responsiveness, i.e., increases in the magnitude of firing rate responses evoked by visual stimuli, are proportional to OSRP among individual V1 neurons (Figure 5). In studies of the developing cat visual system, we have found that similar increases in evoked responsiveness (measured as increased ERI) occur in the context of biochemical changes in V1 neurons which mimic LTP of glutamatergic synapses.10
Our data show that sleep is essential for OSRP consolidation. Sleep deprivation clearly impaired OSRP, regardless of time of day (Figures 2, 3). For several reasons, it seems unlikely that OSRP impairment is attributable to nonspecific effects of experimental sleep deprivation, such as activation of an acute stress response. First, the gentle handling techniques used here for sleep deprivation have been shown to decrease sleep time without either significantly increasing plasma corticosterone levels14,19 or having nonspecific effects on brain plasticity.14 Second, we find that when sleep behavior is naturally reduced in the absence of experimental sleep deprivation (i.e., in evening-tested mice, presented with a stimulus to initiate OSRP just prior to the active phase), OSRP consolidation is impaired to the same degree as in sleep-deprived mice (Figure 3). Third, we see no evidence that experimental sleep deprivation acutely affects OSRP measures, because 6 h of sleep deprivation impairs OSRP to the same degree regardless of whether it occurs immediately before testing, or is followed by 6 h of recovery sleep prior to testing. Finally, we find that sleep deprivation immediately following stimulus presentation impairs OSRP regardless of the duration of subsequent recovery, with equal impairment of OSRP seen across post-stimulus intervals of 12 versus 24 h.
We find that regardless of experimental manipulation, OSRP is proportional to time spent in both SWS and REM sleep, and is negatively correlated with time spent in wakefulness. There are several possibilities raised by these findings. For example, it is possible that both sleep states contribute mechanistically to OSRP, perhaps in unique ways. It is also possible that the state of wakefulness is fundamentally incompatible with consolidation of OSRP, and that both sleep states are permissive for OSRP. Thus, an important unanswered question is why and how sleep promotes OSRP. There are multiple features unique to sleeping brain states that are hypothesized to promote brain plasticity, including altered neuromodulator release profiles and state-specific activity patterns.1,2 Although future studies will be needed to fully understand the relationships between these three states and consolidation of V1 plasticity, our current findings offer some preliminary clues regarding state-specific network mechanisms of OSRP consolidation. Our data show that in the hours following visual experience, OSRP is associated with two changes in thalamocortical network activity. First, V1 principal neurons become more active. We have recently characterized a similar increase in hippocampal CA1 neuronal activity in the hours following single-trial contextual fear conditioning, over a period during which sleep behavior is essential for optimal memory consolidation.23 However, increased neuronal firing alone is not sufficient for OSRP; it occurs following stimulus presentation either at lights-on or lights-off, whereas OSRP is only detectible across the circadian day. Further, these activity changes are state-independent (Figure 4) whereas OSRP is clearly sleep-dependent (Figures 2, 3). A second network activity change associated with OSRP consolidation, one unique to SWS, is that V1 neurons synchronize their firing to thalamocortical spindle oscillations (Figure 5). We have recently shown that both of these network-level changes associated with OSRP (increased principal neuron activity and synchrony with SWS oscillations) are also associated with consolidation of ocular dominance plasticity in the developing cat cortex.13 Importantly, ocular dominance plasticity consolidation also relies on cellular mechanisms associated with LTP.10 Thus, one possibility is that in both the adult mouse and developing cat visual systems, synaptic potentiation is specifically promoted by increased neuronal firing in the context of thalamocortical oscillations unique to sleep; this synaptic potentiation underlies functional plastic changes, such as OSRP, occurring in response to novel visual experience. Similar mechanisms may promote sleep dependent plasticity throughout the cortex after learning. Support for this idea has come recently from human studies, where cortically mediated learning is associated with local increases in both blood oxygen-level dependent signal and SWS thalamocortical oscillations.24,25
Our current data provide direct evidence that sleep can promote potentiation in the adult cortex in vivo, and suggest that this process is promoted by SWS oscillations. Recently described sleep dependent plasticity in adult mouse hippo-campus21 and developing cat cortex10,13 are similar to OSRP, sharing a requirement for sleep and a basis in synaptic potentiation. A prominent hypothesis in the field (the “synaptic homeostasis hypothesis”) proposes that sleep facilitates synaptic weakening (i.e., downscaling) throughout the brain, to offset net synaptic strengthening during wakefulness.3 Although abundant evidence has accumulated in recent years that synaptic downscaling can occur during sleep,5,6 it remains unclear whether, or how, this downscaling contributes to cognitive functions promoted by sleep, such as memory consolidation. Our data support a growing body of evidence that after novel waking experiences (e.g., learning) adaptive remodeling in neural circuits occurs via sleep dependent mechanisms independent of synaptic downscaling.
DISCLOSURE STATEMENT
This was not an industry supported study. This work was supported by grants to Dr. Aton from the National Institutes of Health (DP2MH104119, R00EY021503), the Brain and Behavioral Research Foundation, and the Alfred P. Sloan Foundation, and a grant to Dr. Frank from the National Institutes of Health (R01EY019022). The authors have indicated no financial conflicts of interest.
Footnotes
A commentary on this article appears in this issue on page 1157.
REFERENCES
- 1.Aton SJ, Seibt J, Frank MG. Encyclopedia of life science. Chichester: John Wiley and Sons, Ltd.; 2009. Sleep and memory. [Google Scholar]
- 2.Aton SJ. Set and setting: how behavioral state regulates sensory function and plasticity. Neurobiol Learn Mem. 2013;106:1–10. doi: 10.1016/j.nlm.2013.06.007. [DOI] [PMC free article] [PubMed] [Google Scholar]
- 3.Tononi G, Cirelli C. Sleep and synaptic homeostasis: a hypothesis. Brain Res Bull. 2003;62:143–50. doi: 10.1016/j.brainresbull.2003.09.004. [DOI] [PubMed] [Google Scholar]
- 4.Cirelli C, Gutierrez CM, Tononi G. Extensive and divergent effects of sleep and wakefulness on brain gene expression. Neuron. 2004;41:35–43. doi: 10.1016/s0896-6273(03)00814-6. [DOI] [PubMed] [Google Scholar]
- 5.Vyazovskiy VV, Cirelli C, Pfister-Genskow M, Faraguna U, Tononi G. Molecular and electrophysiological evidence for net synaptic potentiation in wake and depression in sleep. 2009;63:865–78. doi: 10.1038/nn2035. [DOI] [PubMed] [Google Scholar]
- 6.Vyazovskiy VV, Olscese U, Lazimy YM, et al. Cortical firing and sleep homeostasis. Neuron. 2009;63:865–78. doi: 10.1016/j.neuron.2009.08.024. [DOI] [PMC free article] [PubMed] [Google Scholar]
- 7.Hashmi A, Nere A, Tononi G. Sleep-dependent synaptic down-selection (II): single-neuron level benefits for matching, selectivity, and specificity. Front Neurol. 2013;4:148. doi: 10.3389/fneur.2013.00148. [DOI] [PMC free article] [PubMed] [Google Scholar]
- 8.Nere A, Hashmi A, Cirelli C, Tononi G. Sleep-dependent synaptic down-selection (I): modeling the benefits of sleep on memory consolidation and integration. Front Neurol. 2013;4:143. doi: 10.3389/fneur.2013.00143. [DOI] [PMC free article] [PubMed] [Google Scholar]
- 9.Chauvette S, Seigneur J, Timofeev I. Sleep oscillations in the thalamocortical system induce long-term neuronal plasticity. Neuron. 2012;75:1105–13. doi: 10.1016/j.neuron.2012.08.034. [DOI] [PMC free article] [PubMed] [Google Scholar]
- 10.Aton SJ, Seibt J, Dumoulin M, et al. Mechanisms of sleep-dependent consolidation of cortical plasticity. Neuron. 2009;61:454–66. doi: 10.1016/j.neuron.2009.01.007. [DOI] [PMC free article] [PubMed] [Google Scholar]
- 11.Frenkel MY, Sawtell NB, Diogo AC, Yoon B, Neve RL, Bear MF. Instructive effect of visual experience in mouse visual cortex. Neuron. 2006;51:339–49. doi: 10.1016/j.neuron.2006.06.026. [DOI] [PubMed] [Google Scholar]
- 12.Cooke SF, Bear MF. Visual experience induces long-term potentiation in the primary visual cortex. J Neurosci. 2010;30:16304–13. doi: 10.1523/JNEUROSCI.4333-10.2010. [DOI] [PMC free article] [PubMed] [Google Scholar]
- 13.Aton SJ, Broussard C, Dumoulin M, et al. Visual experience and subsequent sleep induce sequential plastic changes in putative inhibitory and excitatory cortical neurons. Proc Natl Acad Sci U S A. 2013;110:3101–6. doi: 10.1073/pnas.1208093110. [DOI] [PMC free article] [PubMed] [Google Scholar]
- 14.Vecsey CG, Wimmer ME, Havekes R, et al. Daily acclimation handling does not affect hippocampal long-term potentiation or cause chronic sleep deprivation in mice. Sleep. 2013;36:601–7. doi: 10.5665/sleep.2556. [DOI] [PMC free article] [PubMed] [Google Scholar]
- 15.Nowak LG, Azouz R, Sanchez-Vives MV, Gray CM, McCormick DA. Electrophysiological classes of cat primary visual cortical neurons in vivo as revealed by quantitative analyses. J Neurophysiol. 2003;89:1541–66. doi: 10.1152/jn.00580.2002. [DOI] [PubMed] [Google Scholar]
- 16.Azouz R, Gray CM, Nowak LG, McCormack DA. Physiological properties of inhibitory interneurons in cat striate cortex. Cereb Cortex. 1997;7:534–45. doi: 10.1093/cercor/7.6.534. [DOI] [PubMed] [Google Scholar]
- 17.Ji D, Wilson MA. Coordinated memory replay in the visual cortex and hippocampus during sleep. Nat Neurosci. 2007;10:100–7. doi: 10.1038/nn1825. [DOI] [PubMed] [Google Scholar]
- 18.Euston DR, Tatsuno M, McNaughton BL. Fast-forward playback of recent memory sequences in prefrontal cortex during sleep. Science. 2007;318:1147–50. doi: 10.1126/science.1148979. [DOI] [PubMed] [Google Scholar]
- 19.Hagewould R, Havekes R, Novati A, Keijser JN, Van der Zee EA, Meerlo P. Sleep deprivation impairs spatial working memory and reduces hippocampal AMPA receptor phosphorylation. J Sleep Res. 2009;19:280–8. doi: 10.1111/j.1365-2869.2009.00799.x. [DOI] [PubMed] [Google Scholar]
- 20.McKay BM, Matthews EA, Oliveira FA, Disterhoft JF. Intrinsic neuronal excitability is reversibly altered by a single experience in fear conditioning. J Neurophysiol. 2009;102:2763–70. doi: 10.1152/jn.00347.2009. [DOI] [PMC free article] [PubMed] [Google Scholar]
- 21.Vecsey CG, Baillie GS, Jaganath D, et al. Sleep deprivation impairs cAMP signalling in the hippocampus. Nature. 2009;461:1122–5. doi: 10.1038/nature08488. [DOI] [PMC free article] [PubMed] [Google Scholar]
- 22.Whitlock JR, Heynen AJ, Shuler MG, Bear MF. Learning induces long-term potentiation in the hippocampus. Science. 2006;313:1093–7. doi: 10.1126/science.1128134. [DOI] [PubMed] [Google Scholar]
- 23.Ognjanovski N, Maruyama D, Lashner N, Zochowski M, Aton SJ. CA1 hippocampal network activity changes during sleep-dependent memory consolidation. Front Syst Neurosci. 2014;8:61. doi: 10.3389/fnsys.2014.00061. [DOI] [PMC free article] [PubMed] [Google Scholar]
- 24.Huber R, Ghilardi MF, Massimini M, Tononi G. Local sleep and learning. Nature. 2004;430:78–81. doi: 10.1038/nature02663. [DOI] [PubMed] [Google Scholar]
- 25.Nishida M, Walker MP. Daytime naps, motor memory consolidation and regionally specific sleep spindles. PloS ONE. 2007;2:e341. doi: 10.1371/journal.pone.0000341. [DOI] [PMC free article] [PubMed] [Google Scholar]