

Abstract
Study Objectives:
The objective of this study was to explore the mechanism of action of the oral pressure therapy (OPT) device, a new treatment for sleep apnea.
Design:
Case series.
Setting:
Academic medical center.
Patients:
Fifteen subjects with sleep apnea who had been successfully treated (responders) with the OPT device and 4 subjects who were not successfully treated (non-responders) with the OPT device.
Interventions:
All subjects underwent a MRI (without the device, with the device in place without vacuum and with the device in place with vacuum) to examine the biomechanical changes associated with the OPT device.
Measurements and Results:
Oral pressure therapy significantly (P = 0.002) increased the size of the retropalatal airway in both the lateral and anterior-posterior dimensions by moving the soft palate anteriorly and superiorly and the anterior-superior segment of the tongue forward, toward the teeth. The percentage and absolute increase in the cross-sectional area of the retropalatal region, the superior movement of the soft palate, and the anterior displacement of the tongue were significantly greater in the responders than in the non-responders. In responders, there were significant increases in the mean (P = 0.002), maximum (P = 0.0002), and minimum (P = 0.04) cross-sectional areas of the retropalatal region with the OPT device. However, in the retroglossal region, airway caliber decreased with the OPT device.
Conclusions:
In those who responded to oral pressure therapy, it increased airway caliber in the retropalatal region by moving the soft palate anteriorly and superiorly and the anterior-superior segment of the tongue forward.
Citation:
Schwab RJ, Kim C, Siegel L, Keenan BT, Black J, Farid-Moayer M, Podmore J, Vaska M. Examining the mechanism of action of a new device using oral pressure therapy for the treatment of obstructive sleep apnea. SLEEP 2014;37(7):1237-1247.
Keywords: oral pressure therapy, MRI, upper airway imaging, sleep apnea
INTRODUCTION
Obstructive sleep apnea (OSA) is a highly prevalent sleep disorder (affecting at least 15 million Americans) and many more worldwide.1,2 Sleep apnea is associated with significant medical consequences.3–5 Sleep apnea is characterized by abnormal upper airway soft tissue and craniofacial anatomy.6–8
Treatment of sleep apnea can improve hypertension, myocar-dial infarction, cerebral vascular accidents, atrial fibrillation, and pulmonary hypertension.3,9–15 Thus, it is important to treat sleep apnea. The treatment of choice for sleep apnea is continuous positive airway pressure (CPAP).16 However, CPAP can be difficult to tolerate for many patients.17–20 Since CPAP is often difficult to tolerate and given the serious cardiovascular risks associated with untreated or ineffectively treated OSA, it is important to develop other treatment options besides CPAP for sleep apnea.
Recently, a novel treatment modality, oral pressure therapy (OPT), that applies negative pressure to the mouth has been shown to be effective in patients with OSA.21–23 The ATLAST Study was a four-week, multi-center, prospective, open label, randomized crossover first-night order of control vs. treatment, single-arm trial of the OPT sleep therapy system for the treatment of obstructive sleep apnea.23 Data from this cohort of 63 subjects indicated that oral pressure therapy led to statistically significant improvements in AHI (apnea hypopnea index) on the first treatment night, and following 28 days of use.23
The goal of this investigation was to explore the mechanism of action of the OPT device. Since the OPT device is placed in the mouth and delivers pressure near the soft palate, we believed that increases in airway caliber, if present, would be greater in the retropalatal than retroglossal region. We sought to understand how the OPT device increased upper airway caliber and moved the upper airway soft tissue structures. Therefore, we studied patients with magnetic resonance imaging (MRI) who had a clinically significant reduction in their apnea hypopnea index with the OPT device and those that did not respond to the OPT device. We hypothesized that with the application of oral pressure therapy (OPT): (1) the mean, minimum, and maximum airway area in the retropalatal region would increase in the responders but not the non-responders and these increases would be greater in the retropalatal region than in the retroglossal region; (2) the retropalatal anterior-posterior and lateral airway dimensions would increase in the responders but not the non-responders; and (3) the 3-dimensional centroid of the soft palate and anterior-superior quadrant of the tongue would move anteriorly and superiorly in the responders but not the non-responders. Portions of this investigation have been previously presented as an abstract.24,25
METHODS
Subjects
Subjects with mild (AHI ≥ 5 and < 15), moderate (AHI ≥ 15 and < 30), or severe (AHI ≥ 30) OSA were recruited for MRI studies at 3 clinical research sites (Atherton, California; Dallas, Texas; Columbia, South Carolina) with written informed consent and study approval by Western Institutional Review Board (Olympia, Washington, USA). The major inclusion criteria were age ≥ 18 years and OSA documented by PSG. The major exclusion criteria were oral or dental infection or a condition that would limit the use of the mouthpiece, night-shift work schedule, abnormal nasal patency, pregnancy or intention to become pregnant during the study, unstable medical conditions other than uncomplicated OSA, clinically significant disease which might pose additional risk to the subject or confound study results, or contraindications to the performance of MRI including presence of a cardiac pacemaker or implantable defibrillator, cerebral aneurysm clip, metal shrapnel or bullet, ear implant, ocular foreign body, or ferromagnetic implanted device. Subjects who experienced claustrophobia were also excluded. Subjects were classified as either responders (defined as a reduction of AHI by at least 50% and AHI < 20 events/h during OPT system use) or non-responders (did not meet these AHI criteria).
Polysomnography
Standard polysomnograms were performed before and after the application of the OPT appliance. All PSGs were scored manually by one professional scorer using the AASM recommended criteria at the time of study conduct.26
OPT Device
The OPT system (Winx Sleep Therapy System, ApniCure, Inc., Redwood City, CA) consists of a polymer mouthpiece and pump connected with tubing (see Figure 1).
Figure 1.
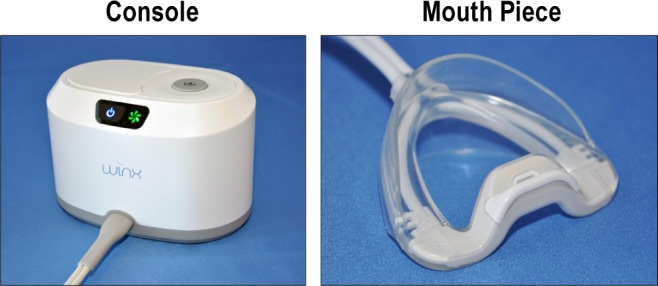
The OPT system has 3 components: mouthpiece, tubing, and vacuum delivery console. The left image shows the console unit which contains the vacuum pump and saliva reservoir and the right image shows the mouthpiece.
Ten different mouthpiece sizes were available in this study. The mouthpiece is not affixed to the teeth, and the user can choose to insert or remove the mouthpiece at any time. The pump aspirates via the mouthpiece using feedback control to produce and maintain stable negative pressure in the mouth. Tubing connecting the mouthpiece to the pump allows withdrawal of excess saliva which is collected in a reservoir. The negative pressure (20 inches of water) generated by the pump console and applied via tubing and the mouthpiece to the oral cavity is intended to create a pressure gradient to shift the soft palate anteriorly into stable contact with the tongue to promote improved airflow during sleep by relieving tissue obstruction of the airway. The 20 inches of water is very modest. Unlike CPAP, OPT does not apply pressure directly to the airway. Rather, negative pressure is applied to the oral cavity. The magnitude of negative intraoral pressure produced by the OPT system is less than the negative pressure associated with breastfeeding and denture seals.21{Farid-Moayer, 2013 #21} The negative pressure in the oral cavity is isolated from the nasal-pharyngeal airway by the natural seal that occurs between the soft palate and tongue. With this system, the user breathes normally through the nose.
Magnetic Resonance Imaging (MRI)
MRI of the upper airway (Figure 2) was performed at 3 different locations under 3 conditions (Figures 3A and 3B): (1) without the device; (2) with the device in place without vacuum; and (3) with the device in place with vacuum.
Figure 2.
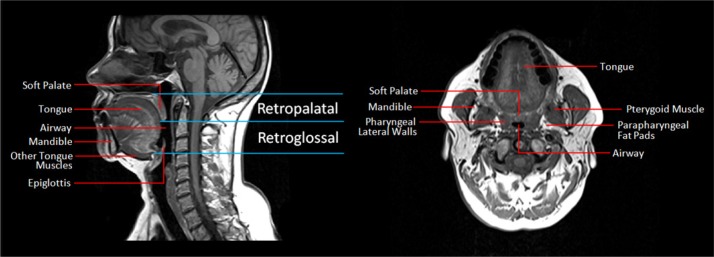
Mid-sagittal standard T1-weight spin echo images at baseline without the OPT device (left panel) and axial standard T1-weight spin echo images (right panel) at baseline without the OPT device. The primary upper airway structures including the tongue, soft palate, lateral pharyngeal walls, parapharyngeal fat pads, mandible, pterygoid muscle, epiglottis, and airway in the retropalatal (the hard palate to the distal margin of the soft palate) and retroglossal regions (distal margin of the soft palate to the base of the epiglottis) are highlighted.
Figure 3.

(A) Mid-sagittal standard T1-weight spin echo images at baseline without the OPT device (left panel), with the OPT device without vacuum (middle panel) and with the OPT device with vacuum (right panel) at 20 inches of water in a responder to OPT. Note that the retropalatal airway is increased in size and the soft palate is moved forward with the OPT appliance with vacuum. (B) Mid-sagittal standard T1-weight spin echo images at baseline without the OPT device (left panel), with the OPT device without vacuum (middle panel) and with the OPT device with vacuum (right panel) at 20 inches of water in a non-responder to OPT. The increase in airway caliber in the retropalatal region is not as large in the non-responder as it is in the responder.
In Atherton, California, a Siemens 1.5T scanner was used running Numaris/4 software, version Syngo MR A35 DHHS, the patient was set up with a cervical array coil and a head coil. The patient was given headphones and a call device. The call device was used not only for communication with the technologist, but also to confirm that the patient was awake. The external landmark was the bottom edge of the head coil. A 3 plane MR scout was performed and used for positioning. The glottis was the physiological centering point of the axial MR slices. Adjustments were made so the top of the imaging field was 1-2 slices superior to the hard palate. Two sequences were performed as a baseline, both TSE (turbo spin echo) and T1 (longitudinal relaxation time) acquisitions. These acquisitions were used with and without the OPT device in order to keep positioning constant during each acquisition. The specific MR imaging sequences were: sagittal (T1 spin echo): TR (repetition time) 526, TE (echo time) 12, 9 slices, FOV (field of view) 210 frequency/75% phase, 4 mm thickness/0% gap, 256×154 matrix, BW (band width) 190, 0:56 scan time. Axial (T1 spin echo): TR 476, TE 12, 40 slices, FOV 230 frequency/84.4% phase, 4 mm thickness/0% gap, 256×194 matrix, BW 190, 2:11 scan time.
In Dallas, Texas, a GE Signa 1.5T scanner was used. The specific MR imaging sequences were: sagittal plane (T1 spin echo): TE 12, TR 526, ETL (Echo Train Length) 16, BW 17.86, 256×160, 2 NEX (number of excitations), FOV 21, 4 mm thickness 0 gap. Axial (T1 spin echo): TE 12, TR 476, ETL 16, BW 17.86, 256×192, 1 NEX, FOV 23, 4 mm thickness 0 gap. In Columbia, South Carolina, a GE Signa 1.5T and a Siemen's 1.5 T were both used (see specific imaging sequences above). All subjects were positioned supine with the head in a neutral anatomic position and secured using a head and neck coil (in both Dallas and in California); this neutral position was defined by aligning the Frankfurt plane, a plane from the soft tissue orbit of the eye to the superior portion of the tragus of the ear, perpendicular to the scanning table.
Upper Airway Image Analysis
Axial and sagittal MR slices of the upper airway before and after OPT placement were manually examined using image analysis software (Amira 4.1.2, Visage Imaging, San Diego, CA) in the Sleep Imaging Center at the University of Pennsylvania (see Figure 3). There were 3 analysis domains: airway, soft tissue, and centroid movement of the soft palate and anterior superior quadrant of the tongue. Airway measurements and soft tissue volumes were obtained from the standard T1 spin echo axial images (Figure 3). Airway measurements were performed in the retropalatal (the hard palate to the distal margin of the soft palate) and retroglossal regions (distal margin of the soft palate to the base of the epiglottis); see Figure 2. The specific airway measurements included: average, maximum and minimum cross-sectional area, lateral and anterior-posterior dimensions at the level of the minimum and maximum cross-sectional area in each region.
Volumetric analysis of the upper airway structures were performed from the axial MRI after segmentation of the soft palate, tongue (genioglossus muscle and then separately the entire tongue including genioglossus, geniohyoid, hyoglossus, myohyoid, digastrics, and myohyoideus muscles), parapharyngeal fat pads, lateral pharyngeal walls, and the mandible, as we have performed previously.6–8 These volumetric reconstructions were performed with and without the OPT device (Figure 4).
Figure 4.

Representative three-dimensional volumetric reconstructions of tongue (red), soft palate (pink), airway (blue), and mandible (gray/ translucent) from the 4-mm contiguous axial MR upper airway images with and without the OPT device—in a 3D lateral view (A,B), and a 3D posterior view (C,D). Amira 4.1.2 software suite (Visage Imaging, Inc., San Diego, CA) was used in the reconstruction and volumetric analysis of the upper airway images. Each slice was manually segmented and analyzed for the soft palate, tongue, and airway. Note that with the OPT device at 20 inches of water (B) the tongue (arrow) is displaced, the soft palate is moved forward and that airway caliber in the retropalatal but not the retroglossal region is increased in size. The airway in the retropalatal region is increased in the AP dimension (B). In the lower panels (C,D) the yellow lines indicate the change in the lateral dimension of the minimum retropalatal airway OPT device at 20 inches of water. Note that the airway caliber is also increased in the lateral dimension with the OPT device.
In order to track the motion of the soft palate and anterior segment of the tongue, we examined the 3-dimensional centroid of these structures before and after the application of the OPT device (Figure 5).
Figure 5.

Midsagittal images before and after oral pressure therapy at 20 inches of water highlighting the changes in the 3-dimensional centroid of the soft palate and anterior quadrant of the tongue. Oral pressure therapy (OPT) treatment moved the 3-dimensional centroid of the soft palate anteriorly and superiorly (circles represent the centroid at baseline, triangles represent the centroid with treatment with OPT; pink lines define the border between the soft palate and tongue) and moved the centroid of the anterior segment of the tongue forward, toward the teeth.
The entire volume of the soft palate was used to determine the centroid of the soft palate. For the tongue we only examined the centroid of the anterior superior quadrant (Figure 5), since this was the section of the tongue that moved the most with the OPT device. The posterior border of the anterior superior quadrant of the tongue was the junction of the hard and soft palate and the inferior border was the superior tip of the mandible as identified on the mid-sagittal image (Figure 5).
All MR image analysis was performed by one trained technologist supervised by a physician (RS). The technologist was blinded regarding the severity of the subject's obstructive sleep apnea.
Statistical Analysis
Demographic information for subjects was summarized using means and standard deviations for continuous variables or frequencies and percentages for categorical covariates. Demographic variables were compared between responders and non-responders using nonparametric Wilcoxon two-sample exact tests (for continuous variables) or Fisher exact tests (for categorical variables). In order to fully assess the impact of the OPT device on soft tissue and airway changes, we calculated 3 relevant subject specific differences or percent changes: (1) change from baseline to OPT without vacuum (OPT0), (2) change from OPT0 to OPT at 20 inches of water (OPT20), and (3) change from baseline to OPT20. Within the 15 responders, we assessed whether there were significant changes while using the device with a nonparametric Wilcoxon signed rank test. Moreover, to assess whether observed changes were associated with being a responder, and therefore a potential mechanism of effect, we compared the change scores between the 15 responders and 4 non-responders using Wilcoxon two-sample exact tests. Based on our preliminary data,24 in the retropalatal region, which showed an average standard deviation of 43 and a moderate correlation of 0.5 between values at baseline and with the OPT device, we estimated that a sample of 15 responders would result in 80% power to detect change of 33.3%, at an alpha level of 0.05. Using this sample size, we also have > 98% power to detect a change of at least 50%.
RESULTS
Subject Demographics and Baseline Anatomic Data
All subjects signed informed consent. Subject demographics are summarized in Table 1A. In the responders, 13 of 15 subjects were men; the mean ± SD AHI was 38.5 ± 23.3 events/h before the OPT device was applied and reduced to 6.7 ± 5.0 events/h with the OPT device. In the nonresponders, the mean AHI was 24.3 ± 19.4 events/h before the OPT device was applied and 27.9 ± 24.0 events/h with the OPT device. There were no significant differences in the age, BMI, percentage of men, or baseline AHI values between the responders and non-responders. Table 1B examines differences in the baseline anatomic data between responders and non-responders. For most of the anatomic measurements there were not significant differences between the responders and non-responders. The minimum anterior-posterior airway dimensions in the retropalatal (P = 0.024) and retroglossal (P = 0.014) regions were significantly smaller in the non-responders than the responders. On the other hand, non-responders had larger maximum anterior-posterior dimensions (P = 0.0021) and cross-sectional area (P = 0.0366) in the RG region and borderline larger maximum anterior-posterior dimensions (P = 0.0614) in the RP region compared to responders. These data indicate that airway characteristics in the retropalatal and retroglossal regions may be important in identifying who will respond to the OPT device.
Table 1A.
Demographic information for OPT subjects

Table 1B.
Baseline anatomic data for responders and non-responders

Changes in Upper Airway Measurements with the OPT Device
Increases in upper airway area, anterior-posterior and lateral airway dimensions with the OPT appliance in the retropalatal region are demonstrated in representative subjects in Figures 3A, 3B, and 4. The increase in airway caliber in the retropalatal region is not as large in the non-responder as it is in the responder. The data in all responders confirmed these findings. Within responders, there were significant percent change increases from baseline in the mean (P = 0.002), maximum (P = 0.0002), and minimum (P = 0.04) cross-sectional airway areas with the application of the OPT device with vacuum in retropalatal region (Table 2A). Similar increases in absolute airway caliber were seen in the retropalatal region with the OPT device (Table 2B). The percentage increase in the mean, maximum, and minimum cross-sectional airway area with the OPT device in the retropalatal region ranged from 56% to 78% (Table 2A). There were also significant percent increases in the dimensions of the minimum (P = 0.04) and maximum (P = 0.03) lateral airway distance and maximum (P = 0.04) anterior-posterior dimensions with the OPT device in the retropalatal region (Table 2A). The percentage increase in the maximum and minimum lateral airway distance with the OPT device in the retropalatal region ranged from 6% to 11% (Table A2). The percentage increase in the maximum and minimum anterior-posterior airway distance with the OPT device retropalatal region ranged from 7% to 17% (Table 2A). These retropalatal airway increases with the OPT device were related to applying the vacuum pressure of the device, since there were no significant changes (Tables 2A and 2B) in percent or absolute change in the mean, maximum or minimum airway area, lateral or anterior-posterior distance between the baseline data and the device placed without vacuum (OPT0). These data indicate that the device itself was not significantly increasing or decreasing the cross-sectional area in the retropalatal region.
Table 2A.
Airway percent changes in the retropalatal region for OPT device responders

Table 2B.
Airway absolute changes in the retropalatal region for OPT device responders

Moreover, the increases in the retropalatal airway were only noted in the OPT responders, not the non-responders (Tables 3A and 3B). The increases in the percent (responder 56.5 vs. −1.2 non-responder; P = 0.0078) or absolute (responder 168.3 mm2 vs −4.7 mm2 non-responder; P = 0.0078) mean cross sectional area in the retropalatal region with the OPT device with vacuum were significantly greater in the responders than the non-responders (Tables 3A and 3B). The changes in the maximal cross sectional area were also significantly greater in the responders than the non-responders (Tables 3A and 3B). In general, there were minimal increases in the retropalatal airway area in the non-responders.
Table 3A.
Airway percent changes in the retropalatal region for OPT device responders and non-responders

Table 3B.
Airway absolute changes in the retropalatal region for OPT device responders and non-responders

Although there were significant increases in upper airway area, anterior-posterior, and lateral airway dimensions with the OPT appliance in the retropalatal region, in the retroglossal region the upper airway narrowed (Figures 3 and 4). Across all responders, there were significant percent decreases in the mean (P = 0.0001), maximum (P = 0.0004), and minimum (P = 0.0001) cross-sectional airway areas with the application of the OPT device with vacuum in the retroglossal region (Tables 4A and 4B).
Table 4A.
Airway percent changes in the retroglossal region for OPT device responders

Table 4B.
Airway absolute changes in the retroglossal region for OPT device responders

There were also significant percent decreases in the dimensions of the minimum (P = 0.0002) and maximum (P = 0.04) lateral airway distance and maximum (P = 0.0009) and minimum (P = 0.003) anterior-posterior distances with the OPT device with vacuum in the retroglossal region (Table 4A). These airway and dimensional changes in the anterior-posterior and lateral airway measurements were also noted in the absolute measurements (Table 4B).
These reductions in the retroglossal airway dimensions were primarily related to placement of the device without applying vacuum. There were significant decreases in the retroglossal percentage changes in mean (P = 0.020) and minimum (P = 0.005) cross-sectional area, maximum (P = 0.0006) and minimum (P = 0.0002) anterior-posterior distance, and minimum (P = 0.030) lateral distance with patients wearing the OPT device without vacuum (baseline vs. OPT0, Table 4A). Similar decreases were also noted in the absolute changes (Table 4B). With the application of the negative pressure, there were further significant reductions in the percent and absolute change in the mean cross-sectional area (Tables 4A and 4B). Thus, there appears to be an additional effect of vacuum on mean cross-sectional area beyond what was seen by applying the OPT without vacuum.
In comparing responders and non-responders (Figures 3A and 3B), we observed significant differences in the amount of change from baseline to the device with vacuum in the maximum (P = 0.020) and minimum (P = 0.006) cross-sectional area, the maximum (P = 0.012) and minimum (P = 0.009) anterior-posterior distance, and the minimum (P = 0.049) lateral distance (Tables 5A and 5B). There were no significant differences in the percent and absolute decreases in the mean cross-sectional area between responders and non-responders with device placement with or without vacuum (Tables 5AA and 5B).
Table 5A.
Airway percent changes in the retroglossal region for OPT device responders and non-responders

Table 5B.
Airway absolute changes the retroglossal region for OPT device responders and non-responders

Movement of the Soft Palate and Tongue with OPT
In order to understand why the airway increased in size with OPT treatment in the retropalatal region and did not increase in the retroglossal region, we examined the movement of the centroid of the soft palate, entire tongue, and anterior superior quadrant of the tongue. OPT treatment moved the 3-dimensional centroid of the soft palate anteriorly and superiorly and moved the 3-dimensional centroid of the anterior superior quadrant of the tongue forward, toward the teeth as demonstrated in Figure 5. The data in all responders confirmed these findings. There were significant anterior (P = 0.0002) and superior (P = 0.0001) displacements of the soft palate and forward displacement of the anterior superior quadrant of the tongue (P = 0.0002) with the application of the OPT device with vacuum (Table 6). There was a significant anterior movement (P = 0.0067) of the centroid of the entire tongue, but this change was small (< 1 mm on average).
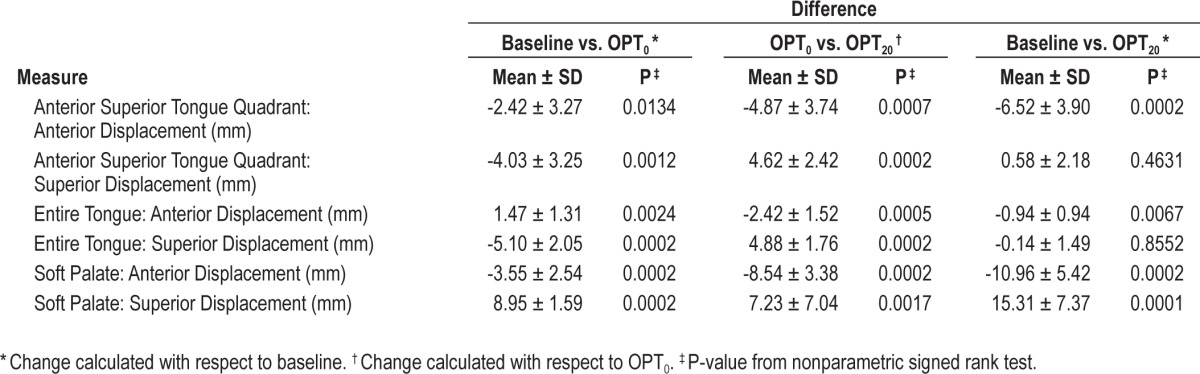
Table 6.
Changes in the 3-dimensional centroid of the anterior superior quadrant of the tongue, the entire tongue, and 3-dimensional centroid of the soft palate for OPT device responders
These soft palate and tongue displacements were related to both placement of the device and to device vacuum (Table 6). There were significant changes in the anterior and superior displacements of the soft palate and forward displacement of the anterior superior quadrant of the tongue comparing the baseline to device without vacuum and comparing device without vacuum to the device with vacuum (Table 6). The centroid of the entire tongue moved in different directions related to the placement of the device and with device suction (Table 7), effectively eliminating any large movements.
Table 7.
Changes in the 3-dimensional centroid of the anterior superior quadrant of the tongue, the entire tongue, and 3-dimensional centroid of the soft palate for opt device responders and non-responders

In the responders compared to the non-responders (Table 7), there was significantly more superior displacement of the soft palate (responder 15.31 mm vs. 4.79 mm; P = 0.0248), significantly more anterior displacement of the anterior superior quadrant of the tongue (responders −6.52 mm vs. −0.99 mm; P = 0.0078), and significantly more anterior displacement of the entire tongue (responders −0.94 mm vs. 1.37 mm; P = 0.0346). There was more anterior soft palate displacement in the responders than the non-responders (−10.96 mm vs. −7.04 mm, P = 0.0614), but this did not quite reach statistical significance.
DISCUSSION
The OPT device, a novel treatment for OSA, has been shown to improve the AHI in a subset of patients.21–23 We performed MR imaging in patients who had clinically responded to the OPT device and those who had not responded. The baseline anatomic data indicate that specific airway characteristics (including a smaller minimum and larger maximum anterior-posterior airway) in the retropalatal and retroglossal regions may be important in identifying who will respond to the OPT device. This is the first study to examine the mechanism of action of the OPT device. We have shown that oral pressure therapy significantly increases the size of the retropalatal airway in both the lateral and anterior-posterior dimensions by moving the soft palate anteriorly and superiorly and the anterior-superior segment of the tongue forward, toward the teeth. Compared to non-responders, responders had significantly greater superior displacement of the soft palate and anterior displacement of the tongue. There was significant, but little movement in the centroid of the entire tongue in responders or non-responders. In the retropalatal region, there were significant increases in the mean, maximum, and minimum cross-sectional areas with the OPT device. Device responders had significantly larger increases in the mean and maximum cross-sectional areas in the retropalatal region when compared to non-responders. This suggests that the efficacy of the OPT device is mediated through increases in the cross-sectional area in the retropalatal region. On the other hand, in the retroglossal region there were significant decreases in the mean, maximum, and minimum cross-sectional areas with the OPT device in responders. These decreases appeared primarily driven by placement of the OPT device without vacuum and were significantly larger in responders than non-responders. Despite these observed decreases in the retroglossal airway, the AHI improved in the responders, suggesting that narrowing in the retropalatal region is more critical than narrowing in the retroglossal region for these patients. This observation is in line with previous publications, showing that in most patients with sleep apnea, retropalatal narrowing is more important than retroglossal narrowing.27,28
In order to understand the mechanism of action of a treatment for OSA, it is necessary to examine the effect of that treatment (this is especially important when evaluating new treatment options) on upper airway caliber and the surrounding soft tissue and craniofacial structures. A better understanding of the biomechanical mechanisms that mediate the efficacy of various treatment modalities for OSA may have important clinical implications, including the development of more effective treatments, and may improve the selection of patients for a specific treatment modality, one of the goals of personal medicine.29 This is true for all the different treatment options for OSA including CPAP, oral appliances, and upper airway surgery.
In this investigation we specifically examined the movement of the 3-dimensional centroid of the soft palate, anterior-superior quadrant of the tongue and the entire tongue with the OPT device in order to understand its effects on upper airway structure. Most patients with sleep apnea develop narrowing during sleep in the retropalatal region.27,28 We have shown that the soft palate moves superiorly and anteriorly with the OPT device. Our data suggest that patients manifesting an enlarged soft palate or exhibiting primarily retropalatal airway collapse would be ideal candidates for the OPT device. Patients with retroglossal obstruction (i.e., those patients with lingual tonsils or an enlarged tongue base) may not have an optimal response to the OPT device, since we have shown that the retroglossal airway caliber gets smaller with the OPT device.
We have shown that the OPT device moves upper airway soft tissue structures and increases airway caliber in the retropalatal region. This increase in airway caliber presumably improved the AHI, as we observed significantly larger increases in responders than non-responders. The improvement in AHI with oral pressure therapy may also be related to the stabilization of the airway from the negative vacuum pressure, preventing airway collapse during sleep independent of the improvement in upper airway anatomy. Oral pressure therapy may prevent the soft palate, tongue or lateral walls from collapsing during sleep by maintaining the vacuum (negative pressure) at the mouth. Imaging studies during sleep have shown that the soft palate and tongue can move posteriorly and the lateral walls medially to collapse the upper airway.27,28,30 Oral pressure therapy may prevent this from occurring. However, to examine whether this is true, imaging studies with OPT would need to be performed during wakefulness and sleep. Finally there may be other mechanisms whereby OPT therapy prevents airway collapse during sleep. In particular, negative pressure reflexes may be activated by the OPT device preventing airway collapse. Negative pressure reflexes have been shown to be important in maintaining upper airway caliber.31,32
Limitations
There are a few potential limitations that must be addressed in our study. MRI data was only available in 4 non-responders, but even in this small sample we saw significant anatomic differences (increases in retropalatal airway area, displacement of the soft palate and the anterior quadrant of the tongue) between responders and non-responders. There were also no demographic (age, BMI, gender) differences between the responders and non-responders and no significant differences in baseline AHI. However, given this small sample size, results should be replicated in independent populations.
Another limitation involves incomplete blinding of the image analysis technician to the results. The ApniCure team knew the subject's AHI results. The Penn image analysis team did not know the AHI results until after the analysis was performed on 10 subjects. Collectively, we then decided to obtain the larger number of responders for the paper in an unblinded fashion. Thus, while there was not full blinding, a significant amount of analysis was performed without knowledge of AHI results. The non-responders were not blinded from the technician who did the analysis. However, the same technician analyzed all the images in the responders and non-responders.
We showed important anatomic changes with the OPT device during wakefulness, but we did not examine OPT during sleep. Such data would have been very interesting, but it is difficult to perform state dependent imaging in a MR scanner. It would also be interesting to compare the upper airway biomechanical changes with the OPT device to those achieved with CPAP.
In conclusion, we have shown with MRI that oral pressure therapy increases airway caliber in the retropalatal region by moving the soft palate anteriorly and superiorly and the anterior-superior segment of the tongue forward. These data suggest that patients who have retropalatal obstruction should be excellent candidates for the OPT device. We believe imaging studies need to be performed to understand the biomechanical changes associated with other treatment options for sleep apnea.
DISCLOSURE STATEMENT
This investigation was supported by ApniCure and NIH grants: R01HL089447 and P01HL094307. Dr. Schwab and Dr. Black are consultants for Apnicure. Mr. Podmore, Dr. Siegel, and Mr. Vaska are employed by ApniCure, the sponsor of the study. Dr. Farid-Moayer is the principal investigator of the clinical trial and was compensated for that work by Apnicure. The other authors have indicated no financial conflicts of interest.
ACKNOWLEDGMENTS
The authors thank Dana Concio and Elizabeth B. Kneeland for their assistance in preparing this manuscript.
REFERENCES
- 1.Somers VK, White DP, Amin R, et al. Sleep apnea and cardiovascular disease: an American Heart Association/American College of Cardiology Foundation Scientific Statement from the American Heart Association Council for High Blood Pressure Research Professional Education Committee, Council on Clinical Cardiology, Stroke Council, and Council On Cardiovascular Nursing. In collaboration with the National Heart, Lung, and Blood Institute National Center on Sleep Disorders Research (National Institutes of Health) Circulation. 2008;118:1080–111. doi: 10.1161/CIRCULATIONAHA.107.189375. [DOI] [PubMed] [Google Scholar]
- 2.Tufik S, Santos-Silva R, Taddei JA, Bittencourt LR. Obstructive sleep apnea syndrome in the Sao Paulo Epidemiologic Sleep Study. Sleep Med. 2010;11:441–6. doi: 10.1016/j.sleep.2009.10.005. [DOI] [PubMed] [Google Scholar]
- 3.Marin JM, Carrizo SJ, Vicente E, Agusti AG. Long-term cardiovascular outcomes in men with obstructive sleep apnoea-hypopnoea with or without treatment with continuous positive airway pressure: an observational study. Lancet. 2005;365:1046–53. doi: 10.1016/S0140-6736(05)71141-7. [DOI] [PubMed] [Google Scholar]
- 4.Foster GD, Borradaile KE, Sanders MH, et al. A randomized study on the effect of weight loss on obstructive sleep apnea among obese patients with type 2 diabetes: the Sleep AHEAD study. Arch Intern Med. 2009;169:1619–26. doi: 10.1001/archinternmed.2009.266. [DOI] [PMC free article] [PubMed] [Google Scholar]
- 5.Marshall NS, Wong KK, Liu PY, Cullen SR, Knuiman MW, Grunstein RR. Sleep apnea as an independent risk factor for all-cause mortality: the Busselton Health Study. Sleep. 2008;31:1079–85. [PMC free article] [PubMed] [Google Scholar]
- 6.Schwab RJ, Pasirstein M, Pierson R, et al. Identification of upper airway anatomic risk factors for obstructive sleep apnea with volumetric magnetic resonance imaging. Am J Respir Crit Care Med. 2003;168:522–30. doi: 10.1164/rccm.200208-866OC. [DOI] [PubMed] [Google Scholar]
- 7.Chi L, Comyn FL, Mitra N, et al. Identification of craniofacial risk factors for obstructive sleep apnoea using three-dimensional MRI. Eur Respir J. 2011;38:348–58. doi: 10.1183/09031936.00119210. [DOI] [PMC free article] [PubMed] [Google Scholar]
- 8.Schwab RJ, Pasirstein M, Kaplan L, et al. Family aggregation of upper airway soft tissue structures in normal subjects and patients with sleep apnea. Am J Respir Crit Care Med. 2006;173:453–63. doi: 10.1164/rccm.200412-1736OC. [DOI] [PMC free article] [PubMed] [Google Scholar]
- 9.Becker HF, Jerrentrup A, Ploch T, et al. Effect of nasal continuous positive airway pressure treatment on blood pressure in patients with obstructive sleep apnea. Circulation. 2003;107:68–73. doi: 10.1161/01.cir.0000042706.47107.7a. [DOI] [PubMed] [Google Scholar]
- 10.Haentjens P, Van Meerhaeghe A, Moscariello A, et al. The impact of continuous positive airway pressure on blood pressure in patients with obstructive sleep apnea syndrome: evidence from a meta-analysis of placebo-controlled randomized trials. Arch Intern Med. 2007;167:757–64. doi: 10.1001/archinte.167.8.757. [DOI] [PubMed] [Google Scholar]
- 11.Duran-Cantolla J, Aizpuru F, Montserrat JM, et al. Continuous positive airway pressure as treatment for systemic hypertension in people with obstructive sleep apnoea: randomised controlled trial. BMJ. 2010;341:c5991. doi: 10.1136/bmj.c5991. [DOI] [PubMed] [Google Scholar]
- 12.Parra O, Sanchez-Armengol A, Bonnin M, et al. Early treatment of obstructive apnoea and stroke outcome: a randomised controlled trial. Eur Respir J. 2011;37:1128–36. doi: 10.1183/09031936.00034410. [DOI] [PubMed] [Google Scholar]
- 13.Kanagala R, Murali NS, Friedman PA, et al. Obstructive sleep apnea and the recurrence of atrial fibrillation. Circulation. 2003;107:2589–94. doi: 10.1161/01.CIR.0000068337.25994.21. [DOI] [PubMed] [Google Scholar]
- 14.Konecny T, Brady PA, Orban M, et al. Interactions between sleep disordered breathing and atrial fibrillation in patients with hypertrophic cardiomyopathy. Am J Cardiol. 2010;105:1597–602. doi: 10.1016/j.amjcard.2010.01.023. [DOI] [PubMed] [Google Scholar]
- 15.Arias MA, Garcia-Rio F, Alonso-Fernandez A, Martinez I, Villamor J. Pulmonary hypertension in obstructive sleep apnoea: effects of continuous positive airway pressure: a randomized, controlled cross-over study. Eur Heart J. 2006;27:1106–13. doi: 10.1093/eurheartj/ehi807. [DOI] [PubMed] [Google Scholar]
- 16.Kushida CA, Littner MR, Hirshkowitz M, et al. Practice parameters for the use of continuous and bilevel positive airway pressure devices to treat adult patients with sleep-related breathing disorders. Sleep. 2006;29:375–80. doi: 10.1093/sleep/29.3.375. [DOI] [PubMed] [Google Scholar]
- 17.Powell ED, Gay PC, Ojile JM, Litinski M, Malhotra A. A pilot study assessing adherence to auto-bilevel following a poor initial encounter with CPAP. J Clin Sleep Med. 2012;8:43–7. doi: 10.5664/jcsm.1658. [DOI] [PMC free article] [PubMed] [Google Scholar]
- 18.Aloia MS, Stanchina M, Arnedt JT, Malhotra A, Millman RP. Treatment adherence and outcomes in flexible vs standard continuous positive airway pressure therapy. Chest. 2005;127:2085–93. doi: 10.1378/chest.127.6.2085. [DOI] [PMC free article] [PubMed] [Google Scholar]
- 19.Sawyer AM, Gooneratne NS, Marcus CL, Ofer D, Richards KC, Weaver TE. A systematic review of CPAP adherence across age groups: clinical and empiric insights for developing CPAP adherence interventions. Sleep Med Rev. 2011;15:343–56. doi: 10.1016/j.smrv.2011.01.003. [DOI] [PMC free article] [PubMed] [Google Scholar]
- 20.Weaver TE, Grunstein RR. Adherence to continuous positive airway pressure therapy: the challenge to effective treatment. Proc Am Thorac Soc. 2008;5:173–8. doi: 10.1513/pats.200708-119MG. [DOI] [PMC free article] [PubMed] [Google Scholar]
- 21.Farid-Moayer M, Siegel LC, Black J. A feasibility evaluation of oral pressure therapy for the treatment of obstructive sleep apnea. Ther Adv Respir Dis. 2013;7:3–12. doi: 10.1177/1753465812468043. [DOI] [PubMed] [Google Scholar]
- 22.Farid-Moayer M, Siegel LC, Black J. Oral pressure therapy for treatment of obstructive sleep apnea: clinical feasibility. Nat Sci Sleep. 2013;5:53–9. doi: 10.2147/NSS.S44736. [DOI] [PMC free article] [PubMed] [Google Scholar]
- 23.Colrain IM, Black J, Siegel LC, et al. A multi-center evaluation of oral pressure therapy for the treatment of obstructive sleep apnea. Sleep Med. 2013;14:830–7. doi: 10.1016/j.sleep.2013.05.009. [DOI] [PMC free article] [PubMed] [Google Scholar]
- 24.Schwab RJ, Kim C, Siegel LC, et al. Mechanism of action of a novel device using oral pressure therapy (OPT) for the treatment of OSA. Am J Respir Crit Care Med. 2012;185:A6811. [Google Scholar]
- 25.Schwab RJ, Kim C, Siegel LC, et al. Examining the mechanism of action of a new device using oral pressure therapy for the treatment of patients with OSA. J Sleep Res. 2012;21:O310. doi: 10.5665/sleep.3846. [DOI] [PMC free article] [PubMed] [Google Scholar]
- 26.Iber C, Ancoli-Israel S, Chesson A, Quan SF. Westchester, IL: American Academy of Sleep Medicine; 2007. The AASM manual for the scoring of sleep and associated events. [Google Scholar]
- 27.Trudo FJ, Gefter WB, Welch KC, Gupta KB, Maislin G, Schwab RJ. State-related changes in upper airway caliber and surrounding soft-tissue structures in normal subjects. Am J Respir Crit Care Med. 1998;158:1259–70. doi: 10.1164/ajrccm.158.4.9712063. [DOI] [PubMed] [Google Scholar]
- 28.Suto Y, Matsuo T, Kato T, et al. Evaluation of the pharyngeal airway in patients with sleep apnea: value of ultrafast MR imaging. AJR Am J Roentgenol. 1993;160:311–4. doi: 10.2214/ajr.160.2.8424340. [DOI] [PubMed] [Google Scholar]
- 29.Sznajder JI, Ciechanover A. Personalized medicine: the road ahead. Am J Respir Crit Care Med. 2012;186:945–7. doi: 10.1164/rccm.201210-1772OE. [DOI] [PubMed] [Google Scholar]
- 30.Borek RC, Thaler ER, Kim C, Jackson N, Mandel JE, Schwab RJ. Quantitative airway analysis during drug-induced sleep endoscopy for evaluation of sleep apnea. Laryngoscope. 2012;122:2592–9. doi: 10.1002/lary.23553. [DOI] [PubMed] [Google Scholar]
- 31.Eckert DJ, Saboisky JP, Jordan AS, White DP, Malhotra A. A secondary reflex suppression phase is present in genioglossus but not tensor palatini in response to negative upper airway pressure. J Appl Physiol (1985) 2010;108:1619–24. doi: 10.1152/japplphysiol.01437.2009. [DOI] [PMC free article] [PubMed] [Google Scholar]
- 32.Eckert DJ, Lo YL, Saboisky JP, Jordan AS, White DP, Malhotra A. Sensorimotor function of the upper-airway muscles and respiratory sensory processing in untreated obstructive sleep apnea. J Appl Physiol (1985) 2011;111:1644–53. doi: 10.1152/japplphysiol.00653.2011. [DOI] [PMC free article] [PubMed] [Google Scholar]