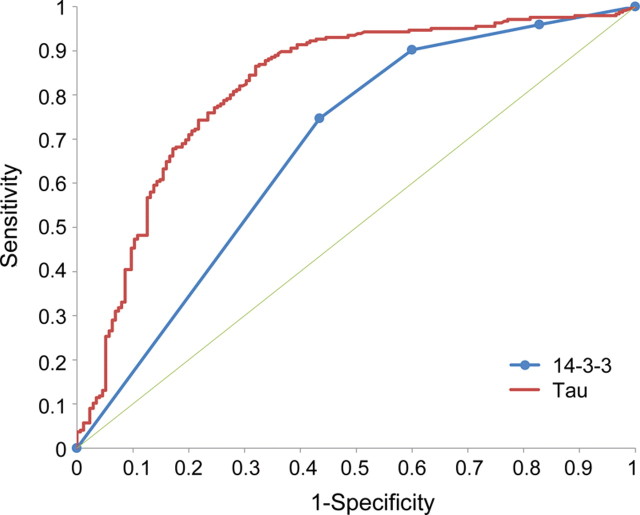
Figure 1. Receiver operating characteristic curves for tau and 14-3-3 protein.
Four categories (negative, ambiguous negative, ambiguous positive, and positive) are used for 14-3-3 protein. The area under the curve ± SE for tau was 0.819 ± 0.020 vs 0.672 ± 0.022 for the 14-3-3 test. The thin green line represents a test that does not change predictive ability.

