Abstract
Social behaviors, such as aggression or mating, proceed through a series of appetitive and consummatory phases1 that are associated with increasing levels of arousal2. How such escalation is encoded in the brain, and linked to behavioral action selection, remains an important unsolved problem in neuroscience. The ventrolateral subdivision of the murine ventromedial hypothalamus (VMHvl) contains neurons whose activity increases during male-male and male-female social encounters. Non-cell type-specific optogenetic activation of this region elicited attack behavior, but not mounting3. We have identified a subset of VMHvl neurons marked by the estrogen receptor 1 (Esr1), and investigated their role in male social behavior. Optogenetic manipulations indicated that Esr1+ (but not Esr1-) neurons are sufficient to initiate attack, and that their activity is continuously required during ongoing agonistic behavior. Surprisingly, weaker optogenetic activation of these neurons promoted mounting behavior, rather than attack, towards both males and females, as well as sniffing and close investigation (CI). Increasing photostimulation intensity could promote a transition from CI and mounting to attack, within a single social encounter. Importantly, time-resolved optogenetic inhibition experiments revealed requirements for Esr1+ neurons in both the appetitive (investigative) and the consummatory phases of social interactions. Combined optogenetic activation and calcium imaging experiments in vitro, as well as c-Fos analysis in vivo, indicated that increasing photostimulation intensity increases both the number of active neurons and the average level of activity per neuron. These data suggest that Esr1+ neurons in VMHvl control the progression of a social encounter from its appetitive through its consummatory phases, in a scalable manner that reflects the number or type of active neurons in the population.
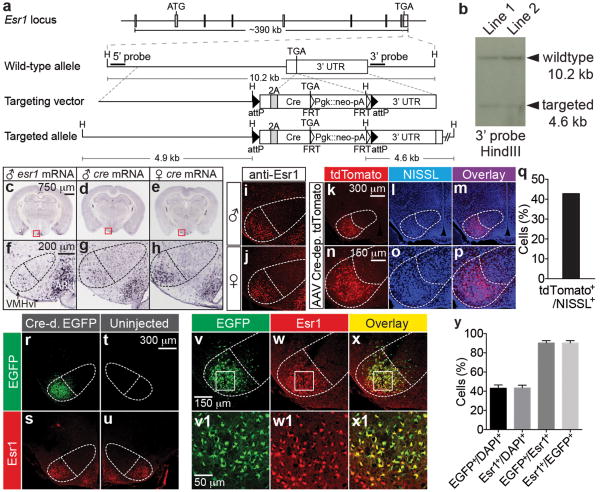
To identify molecular markers for neurons that mediate aggression, we performed double-labeling experiments using markers for subsets of neurons in VMHvl4, and the neuronal activation marker c-Fos5, in resident males that had recently attacked an intruder. These studies identified Esr16 as enriched in cells activated during aggression (>80% of c-Fos+ cells Esr1+; Extended Data (ED) Fig. 1h-v). To gain genetic access to these neurons, we generated a knock-in mouse line in which the Cre recombinase gene was targeted to the 3′ end of the Esr1 coding sequence in a gene-conserving manner (Fig. 1a, b). In situ hybridization for Cre mRNA revealed an expression pattern similar to that of Esr1 mRNA (Fig. 1c-h). As in wild-type mice7, the expression of Esr1-Cre mRNA in VMHvl was higher in females than in males (Fig. 1g-j and ED Fig. 1a-d). Anti-Esr1 antibody staining (Fig, 1i, j, s, u) indicated that the fraction of Esr1+cells (∼40%; see below) was similar in wild-type and gene-targeted mice.
Figure 1. Generation and characterization of a knock-in mouse line expressing Cre recombinase in Esr1+ cells.
a. Strategy for targeting the Esr1 locus. H: HindIII, 3′ UTR: 3′ untranslated region, 2A: F2A sequence, Pgk: phosphoglycerate kinase promoter, neo: neomycin-resistance gene, pA: polyadenylation signal. b. Southern blot of HindIII-digested genomic DNA from two correctly targeted Esr1cre/+ embryonic stem cell lines. Wild-type (10.2 kb) and targeted (4.6 kb) alleles are revealed bya 3′ probe (a). c-h. In situ hybridization for Esr1mRNA in wild-type male (c, f, images obtained from Allen Mouse Brain Atlas, Bregma -1.75 mm) and for Cre mRNA in Esr1cre/+ male (d, g) and female (e, h) mice (Bregma -1.65 mm). VMHvl, ventrolateral subdivision of the ventromedial hypothalamus; ARH, arcuate nucleus. Dotted outline indicates VMH. i-x1. Immuno-staining for Esr1 protein (red) in wild-type (i, male; j, female) and Esr1cre/+ female mice (s, u, w, w1). k-x1. Native fluorescence of Cre-dependent AAV-encoded markers in Esr1cre/+ male (k-p, tdTomato) and female (r-x1, EGFP) mice. v1-x1 are the boxed areas in v-x. q, y. Quantification of k-p (q, n=1) and r-x1 (y, n=4). Data are mean ± SEM. n=number of animals in this and all figures unless otherwise indicated.
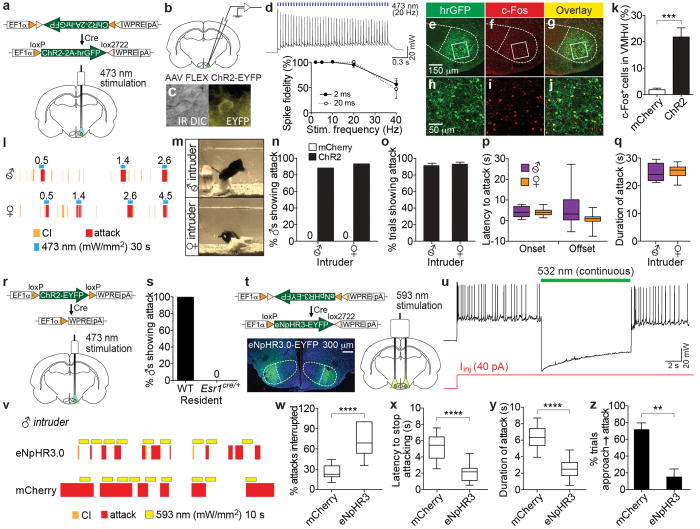
Stereotaxic injection of recombinant adeno-associated viruses (rAAVs) encoding Cre-dependent reporters into VMHvl of Esr1cre/+ mice yielded marker-positive cells at a frequency (43.1±3. 4%, mean±SEM) similar to that of Esr1 expression (43.5±2.5%; Fig. 1k-y). Double-labeling experiments confirmed a high degree of overlap (∼90%) between recombined marker+ and Esr1+ cells in VMHvl (Fig. 1v-y), without spillover into the arcuate nucleus (ED Fig. 1e-g). To optogenetically activate Esr1+ neurons, Esr1cre/+ male mice were unilaterally injected in VMHvl with an rAAV encoding a Cre-dependent channelrhodopsin 28 and a nuclear hrGFP reporter (Fig. 2a). Photostimulation-dependent activation of Esr1+ neurons was confirmed in vitro using whole-cell patch clamp recording in acute hypothalamic slices (Fig. 2b-d), and in vivo by double-labeling for hrGFP and c-Fos (Fig. 2e-k), as well as by extracellular recordings (ED Fig. 2).
Figure 2. Esr1+ cells in VMHvl are necessary and sufficient for aggression.
a. Strategy for optogenetic activation of Esr1+ cells in VMHvl. EF1α, elongation factor 1α promoter; ChR2 is V5 epitope-tagged. b-d. Whole-cell patch clamp recording from Esr1+ cells in VMHvl (c, EYFP+ cell) in acute hypothalamic slices. Photostimulation-evoked spiking (d, upper) and quantification of spike fidelity (d, lower) are shown (filled circles, 2 ms light pulse-width, n=11 cells; open circles, 20 ms pulse-width, n=5 cells). e-j. Double-labeling for Cre-dependent hrGFP viral reporter (e, h) and c-Fos (f, i) in VMHvl of Esr1cre/+ males following photostimulation; h-j, boxed areas indicated in e-g. k. Quantification of (e-j) (mCherry, n=5; ChR2, n=10; ***p<0.001; Mann-Whitney U-test). l, m. Representative raster plots (l) and video stills (m) illustrating photostimulation-evoked (blue bars; mW/mm2) attack (l, red rasters) or close investigation (CI, yellow rasters) byChR2-expressing Esr1cre/+ males (m, black mice), toward a castrated male (”♂”; l, m, upper) or an intact female (l, m, lower). See Supp. Video 1. n-q. Quantification of attack parameters towards castrated males (ChR2, n, n=33; o, n=23; p-q, n=11; mCherry, n, n=14) or females (ChR2, n, n=28; o. n=22; p-q. n=16; mCherry, n, n=10). r. Photoactivation of Esr1- cells using “Cre-out” ChR2 rAAV. s. Percentage of wild-type (WT; n=4) and Esr1cre/+(n=9) males showing photostimulated attack toward castrated males (see ED Fig. 3b, c). t. Expression of eNpHR3.0 in VMHvl Esr1+ neurons. u. Whole-cell patch clamp recording in acute hypothalamic slices, showing photostimulation-induced suppression of current injection-evoked spiking in eNpHR3.0-mCherry expressing Esr1+ cells. v. Representative raster plots illustrating effect of photostimulation on attack towards a male intruder. w-y. Quantification of behavioral parameters (mCherry, n=10; eNpHR3.0, n=13; ****p<0.0001; Mann-Whitney U-test). z. Percentage of photostimulation trials in which approach to intruder led to attack (mCherry, n=7; eNpHR3, n=4; **p<0.01; Mann-Whitney U-test). Data are mean ± SEM (d, k, o, z) or median ± min and max values (p-q, w-y).
Using an implanted fiber optic cable9, we tested the effect of optogenetic stimulation of VMHvl Esr1+ neurons in resident males in their home cage under infrared light, using the resident-intruder assay10. Stimulation (20 Hz, 30 sec, 20 ms pulse-width) elicited intense, time-locked attack towards both cast rated male and female intruders (Fig. 2l, m), in over 87% of ChR2-expressing animals and in ∼90% of trials in those animals (Fig. 2n, o). Controls expressing Cre-dependent mCherry virus in VMHvl failed to show aggression during photostimulation (Fig. 2n, “0”; ED Fig. 3a). Attack was initiated within ∼5 s of photostimulation when light pulses were delivered while the resident was facing the intruder and within one mouse body-length (ED Fig. 4), and continued through most of the 30 s stimulation period (Fig. 2p, q; Supp. Video 1). Optogenetic stimulation of VMHvl Esr1+ neurons in females induced social investigation and occasional mounting, but not attack (ED Fig. 5), suggesting that sex differences in aggression likely occur within or downstream of VMHvl7,11.
To determine whether non-Esr1-expressing VMHvl neurons contribute to aggression, we injected an rAAV in which Cre recombination excises the ChR2-EYFP coding sequence (Fig. 2r, “Cre-out”). Photostimulation failed to elicit any attack behavior in these mice, but did elicit attack behavior in wild-type mice injected with the same virus (Fig. 2s and ED Fig. 3b, c). Together, these data indicate that optogenetic activation of VMHvl Esr1+ neurons, but not of Esr1- neurons, is sufficient and specific for attack.
Previous loss-of-function manipulations in VMHvl, including GluCl-mediated neuronal silencing3, ablation of PR+ neurons11 and RNAi-mediated knockdown of Esr1 mRNA12, reduced aggression but required a time scale of days or weeks. Therefore they did not distinguish whether these neurons are required simply to sense conspecifics, or for actual attack. To distinguish these possibilities, we performed time-resolved, reversible optogenetic inhibition of VMHvl Esr1+ neurons using eNpHR3.013. Whole-cell patch clamp recordings confirmed efficient photostimulation-dependent (532 nm) silencing of Esr1+ neurons (Fig. 2u). Bilateral silencing (10 s continuous illumination) during an agonistic encounter interrupted attack in <3 s in ∼60% of stimulation trials, with a median attack duration of ∼2 s (Fig. 2v-y). In some trials, ongoing attack was abrogated almost instantaneously by photostimulation (Supp. Video 2). Photostimulation also prevented the initiation of attack, and sometimes caused retreat from the intruder (Supp. Video 3), when delivered at the moment of approach (Fig. 2z). Esr1cre/+ males expressing mCherry showed no interruption of attack (Fig. 2v-y). Thus Esr1+neuronal activity is required for both the initiation and continuation of attack.
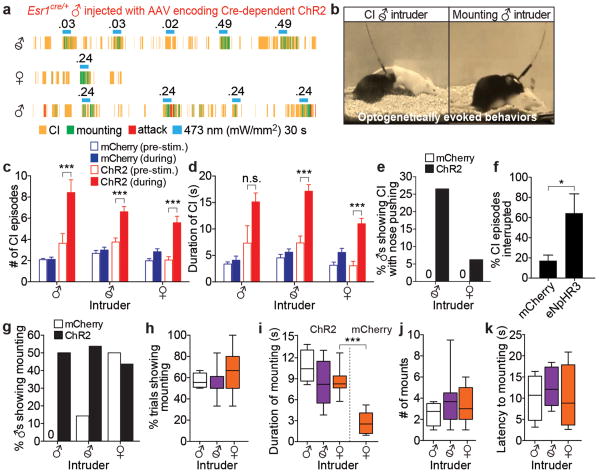
At early stages of a social encounter, resident males exhibit close investigation (CI) of intruders, with sniffing of the anogenital and head regions (Fig. 3a)14. Under conditions of weak ChR2 expression or low-intensity photostimulation, when attack was usually not evoked (see Fig. 4 and ED Fig. 6), we observed an increase in both the average number and duration of CI episodes during 30 s photostimulation trials, irrespective of the sex of the intruder (Fig. 3c-d, solid vs. open red bars). This phenotype was observed in females as well as males (ED Fig. 5 and Supp. Video 4). We also observed a more aggressive form of CI during photostimulation, in which the resident vigorously pushed his nose into the intruder's anogenital region, in ∼25% of mice (Fig. 3e and Supp. Video 5). Importantly, bilateral optogenetic inhibition using eNpHR3.0 interrupted ongoing CI in ∼60% of resident males, vs. <20% of controls (Fig. 3f). Thus, VMHvl Esr1+ neurons are necessary and sufficient for the investigative phase of a social encounter, as well for attack.
Figure 3. Esr1+ cells in VMHvl mediate close investigation (CI) and mounting behaviors.
a, b. Representative raster plots (a) and video stills (b) illustrating photostimulation-evoked mounting (a, green rasters; b, right) or CI (a, yellow rasters; b, left) in ChR2-expressing Esr1cre/+ males towards intruders of the indicated sex. c, d. Number (c) and duration (d) of CI episodes performed by males expressing mCherry (blue bars) or ChR2 (red bars), before (open bars) or during (filled bars) photostimulation, towards intruder males (n=4 each), castrated males (n=14 and n=18, respectively) or females (n=10 and n=12). ***p<0.001; two-way ANOVA with Tukey's multiple comparisons test. e. Aggressive sniffing (“CI with nose pushing”) during photostimulation by Esr1cre/+ males expressing mCherry (open bars) or ChR2 (filled bars) towards intruder castrated males (n=14 and n=49, respectively) or females (n=12 and n=32). f. Percentage of CI episodes interrupted by photostimulation ofEsr1cre/+ males expressing mCherry (n=7) or eNpHR3.0 (n=3). *p<0.05; Mann-Whitney U-test. g. Percentage of Esr1cre/+ males expressing mCherry (open bars) or ChR2 (filled bars) showing photostimulation-evoked mounting towards intruder males (n=4 and n=8, respectively), castrated males (n=14 and n=35) or females (n=10 and n=28). h-k. Quantification of photostimulation-evoked mounting towards intruder males (n=4), castrated males (n=11) or intact females (n=11; i, mCherry, n=5) towards females. ***p<0.001;Mann-Whitney U-test. Data are mean ± SEM (c-d) or median ± min and max values (h-k).
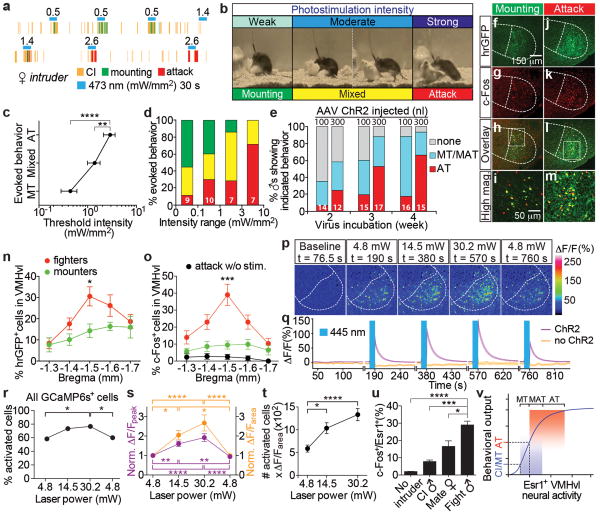
Figure 4. Behavioral responses shift from mounting to attack depending upon photostimulation intensity and the number of activated cells in VMHvl.
a-b. Representative raster plots (a) and images (b) illustrating shift from mounting to attack with increasing photostimulation intensity. c-d. Threshold photostimulation intensities evoking mounting, mixed or attack behavior (c, n=11), or (d) the relative percentage of those behaviors evoked by the indicated intensity range (n in bars). Data are from test sessions exhibiting multiple behaviors. **p<0.01, ****p<0.0001; two-way ANOVA with Tukey's multiple comparisons test. e. Proportion of photostimulation-evoked behaviors in animals injected with different amounts of AAV (100 vs. 300 nl), and incubated for different times post-injection (weeks). n within bars. Blue shading, mounting episodes with or without attack (“MT/MAT”). f-m. Double labeling for virally expressed hrGFP (f, j, h-i, l-m, native fluorescence) and photostimulation-induced c-Fos (g, k, i, m, anti-c-Fos, red) in solitary ChR2-expressing Esr1cre/+ males photostimulated 1 hr before sacrifice in their home cage, at an intensity that had previously evoked either mounting (f-i) or attack (j-m) several days earlier. i, m, boxed areas in h and l, respectively. n-o. Quantification of number of hrGFP+ (n) and c-Fos+ (o) cells in VMHvl across successive axial levels, following solitary photostimulation of “mounters” (green symbols, n=6) or “attackers” (red symbols, n=10), as in (f-m). Black symbols, no photostimulation prior to sacrifice (n=3). *p<0.05, ***p<0.001; two-way ANOVA with Tukey's multiple comparisons test. p-t. Two-photon Ca2+ imaging of acute hypothalamic slices expressing Cre-dependent ChR2-EYFP and Cre-independent GCaMP6s. p. Representative fluorescence images at the indicated time points and illumination power. q. Average Ca2+ transients in GCaMP6s+ cells with (purple trace, n=60) or without ChR2 (orange trace, n=48). Photostimulation (445 nm, 2-ms pulses, 20 Hz) was delivered for 10 s (blue bars in q). r. Percentage of GCaMP6s-expressing cells with ΔF/Fpeak>5 standard deviations from baseline, as a function of light power. *p<0.05; Pearson's Chi-square test. s. Normalized ΔF/Fpeak (purple) and ΔF/Farea (orange, integrated area under the curves in (q) during 30 s following photostimulation) as a function of light power, relative to cells activated at 4.8 mW (n=35). t. Number of activated cells × integrated activity per active cell, vs. laser power. s-t. *p<0.05, **p<0.01, ****p<0.0001; repeated measures one-way ANOVA. u, Percentage of c-Fos+ cells among Esr1+ neurons in VMHvl of wild-type animals following the indicated behaviors (control, n=3; CI, n=4; Mate, n=5; Fight, n=5). Data are mean ± SEM. n=number of animals (c-e, n-o, u) or cells (q-s).v. Threshold model for relationship between level of Esr1+ neuron activity and behavior. MT, mount only; MAT, mixed mount and attack; AT, attack only. See also Supplementary Note 2.
Surprisingly, optogenetic stimulation under such conditions also promoted mounting behavior, towards intact and castrated males as well as females (Fig. 3a, green rasters; Supp. Videos 6-7, ED Fig. 6) in ∼50% of ChR2-expressing resident males and in ∼60% of photostimulation trials for such males (Fig. 3g, h). Photostimulation of ChR2-expressing residents increased both the total number of mounts and average duration of mounting, towards both males and females (Fig. 3i, j). The frequency of evoked mounting was similar to that of control resident males towards female intruders (Fig. 3g, ♀, open bar). However when directed towards males, it was typically abortive and did not proceed to pelvic thrusting or ejaculation. While male-directed mounting was only observed during photostimulation (Fig. 3a), its latency (∼8-12 s; Fig. 3k) was longer than that for attack (∼5s). Photostimulation-induced mounting towards male intruders was not observed in mCherry-expressing controls (Fig. 3g, ♂, “0”). In contrast, optogenetic inhibition did not interrupt ongoing male-female mounting, or reduce its duration or frequency (ED Fig. 7 and Supplementary Note 1).
To characterize the conditions that evoked mounting vs. attack, we manipulated the amount of virus injected; the incubation time; and the intensity and frequency of photostimulation (Fig. 4 and ED Fig. 8). Mounting behavior was typically observed after short (<3 weeks) incubation times following viral injection; when smaller amounts of virus were injected (100 vs. 300 nl); or at lower stimulation intensities (Fig. 4a-e). In some animals, as the intensity of stimulation was increased during a single trial, evoked behaviors could be observed to switch from mounting only (Fig. 4a, b and d, green bars), to mixed mounting and attack (Fig. 4b, d, yellow bars) to attack only (Fig. 4a, b and d, red bars; ED Fig. 6d and Supp. Videos 8-9). This effect often exhibited hysteresis: once attack was elicited, reducing the photostimulation intensity did not evoke mounting, but simply failed to elicit attack (ED Fig. 9). A plot of log (photostimulation intensity) vs. behavior yielded a linear relationship, with mounting (either alone or mixed with attack) evoked up to 0.1 mW/mm2 and attack (only) evoked by intensities >3 mW/mm2 (Fig. 4c). Optogenetically evoked mounting vs. attack behaviors were not strongly dependent on the frequency of photostimulation, although a higher percentage of stimulation trials elicited attack at 20 Hz than at 10 Hz (ED Fig. 8).
The observation that the frequency of optogenetically evoked attack was higher in animals injected with larger volumes of virus (Fig. 4e, 300 nl) suggested that attack required activation of a larger number of Esr1+ neurons in VMHvl. Indeed, mice in which photostimulation induced attack contained a significantly higher number of virally infected (hrGFP+) cells in VMHvl, than did animals in which it evoked mounting (Fig. 4f, j, n). Moreover, photostimulation of solitary residents 1 hr prior to sacrifice yielded a significantly higher number of c-Fos+ cells within the ChR2-expressing (hrGFP+) population in “attackers” (80.5±4.9%, mean±SEM) than in “mounters” (54.7±12.6%, p<0.05, two-tailed Student's t-test; Fig. 4f-m, o). These data suggest that optogenetically evoked attack requires a larger number of ChR2-expressing and active Esr1+cells in VMHvl, than does mounting. Consistent with this conclusion, the percentage of c-Fos+ cells among Esr1+ neurons in wild-type, unmanipulated animals was significantly higher following naturally occurring fighting, than after mating or CI (Fig. 4u)3.
To investigate within the same preparation the relationship between the intensity of photostimulation and the number of active neurons in VMHvl, we used calcium imaging with GCaMP6s15 to measure the extent of optogenetic activation in acute hypothalamic slices from Esr1cre/+ males expressing ChR2 (Fig. 4p, q). Increasing the laser power over an ∼6-fold range significantly increased the fraction of GCaMP6s+ cells exhibiting photostimulation-induced calcium transients (Fig. 4r), and also increased the peak and average activity per cell among neurons activated at the lowest power tested (Fig. 4q, s). There was a roughly linear relationship between laser power and overall activity (number of active neurons × average activity/neuron), with a slope of ∼30 (Fig. 4t). No response was observed in controls lacking ChR2 (Fig. 4q, orange traces). Thus increasing light intensity augmented both the number of active neurons, and the average level of activity per neuron.
Earlier studies revealed that VMHvl contains neurons activated during male aggression, whose optogenetic stimulation or pharmacogenetic inhibition16 evoked or inhibited attack, respectively3. However, those studies employed ubiquitous promoters, and therefore did not identify the subpopulation of neurons responsible for attack. Here we identify these neurons as a subset (∼40%) of VMHvl cells expressing Esr1. From one perspective, it is incidental that this marker encodes a hormone receptor. Indeed, our knock-in mice were designed to permit functional manipulations of these neurons without perturbing Esr1 function. Nevertheless, numerous genetic and pharmacologic studies have demonstrated steroid hormonal influences on the developmental and adult control of social behaviors, including those exerted via VMH12,17-20 (reviewed in refs.21-23). However, relatively little is known about the circuit-level function of the neurons that express these receptors24. Genetic ablation of these cells impaired social behaviors11, but this could simply reflect a permissive function, e.g., in the pheromonal detection of conspecifics. To our knowledge, the present experiments are the first to report time-resolved gain- and loss-of-function manipulations of hypothalamic neurons that express a sex-steroid hormone receptor. They reveal a complex and dynamic relationship between neuronal activity in this population and social behavior. The relationship of this activity to hormonal influences remains to be investigated.
Previous in vivo recordings and c-Fos analysis revealed that VMHvl also contains neurons activated during male-female encounters; however, no effects of functional perturbations on male mating behavior were observed3 (see Suppl. Note 1). Those studies were, therefore, compatible with the view that VMHvl contains “command”-like neurons25 that control attack26, and that the female-activated neurons might even serve to inhibit such attack neurons during mating27. The experiments reported here suggest a rather different view of VMHvl function. They show that Esr1+ neurons control different behaviors throughout the entire progression of a social interaction, from its appetitive through its consummatory phases1. The fact that these behaviors are evoked by optogenetic activation at low and high photostimulation intensities, respectively, further suggests that increasing activity in VMHvl, as the intensity of the social encounter escalates3, leads to qualitatively different behavioral outputs (Fig. 4v).
Several models may explain how such an apparent intensity coding of social behavior is implemented at the cellular level (Supplementary Note 2). These include different subpopulations of Esr1+ neurons with different activation thresholds, graded changes in activity within a single population (ED Fig. 10), or more complex models involving attractor dynamics28. While further experiments will be required to distinguish these possibilities, in vivo recordings revealed a substantial degree of overlap between neurons activated during mating vs. fighting3. Whatever the explanation, the data suggest that Esr1+ neurons in VMHvl may comprise a node in which a graded variable, perhaps representing the level of social arousal or cumulative sensory input, is transformed into differences in action selection at different thresholds. How this transformation occurs will be an interesting subject for future study.
Methods
Animals
All experimental procedures involving use of live animals or their tissues were carried out in accordance with the NIH guidelines and approved by the Institutional Animal Care and Use Committee at California Institute of Technology (Caltech). Wild-type mice were purchased from Charles River Laboratories, Jackson Laboratory and Taconic. Animals were group-housed in ventilated cages in a temperature-controlled environment (23 °C), at humidity between 30 and 70%, with a 12-hour light and 12-hour dark cycle. Mice had ad libitum access to food and water. Mouse cages were changed weekly.
Generation of Esr1cre knock-in mice
Esr1cre knock-in mice were generated at Caltech Genetically Engineered Mouse Services core facility, following standard procedures. The targeting vector was designed to insert an F2A sequence, a Cre recombinase coding sequence, and an frt-flanked PGK-neomycin resistance cassette at the 3′ end of esr1 coding sequence by homologous recombination as an in-frame fusion. Following electroporation of the targeting construct into 129S6/EvSvTac-derived TC-1 embryonic stem (ES) cells (gift of Philip Leder, Harvard University, Cambridge, MA), correctly targeted ES cells were selected by neomycin resistance and identified by genotyping PCR with the following primer sets: 5′ arm primers (5.5 kb), 5′-gaccagcccaccaggaagctg-3′ and 5′-cggtcgatgcaacgagtgatg-3′; 3′ arm primers (3.1 kb), 5′-tcccgattcgcagcgcatcgc-3′ and 5′-ttggggacatgctagagaggc-3.′The positive ES cells were further confirmed by Southern blot analysis using the following probes: 5′ probe, HindIII, 10.2 kb (wild-type allele) and 4.9 kb (targeted allele); 3′ probe, HindIII, 10.2 kb (wild-type allele) and 4.6 kb (targeted allele); Cre probe, AflII, 7.2 kb. The probes were generated with the following primer sets: 5′ probe, 5′-cacacgttgagctggatgatag-3′ and 5′-caggaccaaaagttgggggatc-3′; 3′ probe, 5′-gcagagattatgcctgggaagg-3′ and 5′-gccaatttgattctggtcatccaaag-3′;Cre probe, 5′-gtccaatttactgaccgtacacc-3′ and 5′-ctaatcgccatcttccagcag-3.′ ES cells were then injected into recipient C57BL/6N blastocysts to generate chimeric males that were then bred with C57BL/6N females. The frt-flanked PGK-neo-poly A cassette was removed by crossing Esr1cre/+ mice to transgenic mice expressing flippase (Jackson Laboratory, Stock No. 011065)31. The flippase transgene was eliminated by backcrossing Esr1cre/+;flippase mice to C57BL/6N for >6 generations. Genotype of the mice was determined by PCR on tail genomic DNA with the following primer sets: wild-type allele (598 bp) 5′-tggccactcatactagaaagccactggtgg-3′ and 5′-ggaggaaatgaaaatacgtggacacaagtccc-3′; targeted allele (500 bp) 5′-agccgtcctgggggttca-3′ and 5′-agaaaacgcctggcgatccc-3′; Cre (320 bp), 5′-gttcgcaagaacctgatggaca-3′ and 5′-ctagagcctgttttgcacgttc-3.′The Esr1cre knock-in mice are available from the Jackson Laboratory (Stock No. 017911).
Virus
AAV.EF1α.FLEX.ChR2-EYFP.WPRE and AAV.EF1α.FLEX.eNpHR3.0-EYFP.WPRE were generous gifts of K. Deisseroth (Stanford). AAV.hSynapsin.FLEX.tdTomato-2A-EGFP-Synaptophysin.WPRE and AAV.CAG.FLEX.EGFP.WPRE were kind gifts of Julie Harris (Allen Institute for Brain Science). AAV.EF1α.FLEX.ChR2-V5-F2A-nuclear hrGFP.WPRE, AAV.EF1α.loxP.ChR2-EYPF.loxP.WPRE and AAV.EF1α.FLEX.mCherry.WPRE were generated in our laboratory. The viruses were prepared by the University of Pennsylvania Vector Core (AAV2.EF1α.FLEX.ChR2-EYFP.WPRE, 2.0 × 10¹³ genomic copies (GC)/ml; AAV2.EF1α.FLEX.ChR2-V5-F2A-nuclear hrGFP.WPRE, 2.2 × 10¹² GC/ml; AAV2.EF1α.FLEX.mCherry.WPRE, 3.7 × 10¹² GC/ml; AAV2.EF1α.loxP.ChR2-EYPF.loxP.WPRE, 1.8 × 10¹² GC/ml; AAV1.CAG.FLEX.EGFP.WPRE, 8 × 10¹² GC/ml), the Harvard Gene Therapy Initiative (AAV2.EF1α.FLEX.eNpHR3.0-EYFP.WPRE, 4.2 × 10¹² GC/ml), and the University of North Carolina Gene Therapy Center (AAV1.hSynapsin.FLEX.tdTomato-2A-EGFP-Synaptophysin.WPRE, 6 × 10¹² GC/ml; AAV2.EF1α∷FLEX.eNpHR3.0-mCherry.WPRE, 3 × 10¹² GC/ml).
Surgery
Adult Esr1cre/+ mice at ages between 2 to 4 months (sexually inexperienced) were housed individually for 5 days to 2 weeks in a reverse light/dark cycle room, and then stereotaxically injected with a virus as described previously32. Briefly, animals were anesthetized with isoflurane (0.8-5%) and placed in a stereotaxic frame (David Kopf Instruments). A virus was injected into VMHvl in either one or both hemispheres using a pulled glass capillary (World Precision Instruments) either by nanoliter pressure injection at a flow rate of 30 nl/min (Micoro4 controller, World Precision Instruments; Nanojector II, Drummond Scientific) or iontophoresis at 3 μA for 5-10 min (7 s on and 7 s off, Midgard Precision Current Source, Stoelting)33. Stereotactic injection coordinates to target the VMHvl were obtained from either the Paxinos and Franklin atlas (AP: -1.5, ML: ±0.78, DV: -5.75 mm) or the three dimensional surgical atlas developed by magnetic resonance imaging and micro-computed tomography (AP: -4.68, ML: ±0.78, DV: -5.80 mm)34. Either a ferrule or a guide cannula (PlasticsOne) was subsequently placed at 50-500 μm above the virus injection site (s) and fixed on the skull with a small amount of dental cement (Parkell). Ferrules and fiber-optic patch cords were either purchased from Doric Lenses or manufactured in our laboratory following the protocol provided by E. Boyden (MIT, http://syntheticneurobiology.org/protocols/protocoldetail/35/9). The virus-injected animals were housed individually in a reverse light/dark room during a 2 to 4-week recovery period, and then examined behaviorally and histologically.
Behavioral tests
(1) Resident-intruder test
Behavioral tests were initiated at 2 to 4 weeks post-surgery and repeated weekly for 2 to 5 weeks. Mouse cages were not cleaned for a minimum of 1 day until the behavioral test. The first test session on a given day began at 1-2 hours after onset of the dark period. The virus-injected Esr1cre/+ animals were briefly anesthetized with isoflurane in a biosafety cabinet. The tip of a fiber-optic cable (200 μm in core diameter, ThorLabs) was inserted to a depth just above the target brain region by introducing the cable into the brain through a guide cannula installed during surgery. For the ferrule-connector system, a ferrule patch cord was coupled to a ferrule on the head using a zirconia split sleeve (Doric Lenses). Mice were transferred to a test room illuminated with red lights and allowed to recover from anesthetic for 20-30 min in their home cage placed in a rectangular Plexiglas test chamber fitted with infrared bulbs around the top as described previously32. The optical fiber was connected to a laser (473 nm for ChR2; 593 nm for eNpHR3.0; Shanghai Laser and Optics Century Co. and CrystaLaser) directly or via an optical commutator (Doric Lenses) to avoid twisting of the cable caused by the animal's movement. One to three intruders were individually introduced to an Esr1cre/+ mouse in a testing session in a random order with respect to gender, with a 5-10 min interval between intruders. The strains of intruders were: intact males (BALB/c, 129S6/EvSv, and C57BL/6), castrated males (BALB/c), and intact non-hormone primed females (BALB/c and C57BL/6). After a testing session, Esr1cre/+ animals were uncoupled from the fiber-optic cable and returned to a housing room.
(2) ChR2-mediated activation
After the introduction of an intruder, a virus-injected animal was observed for 3-5 min to assess baseline behavioral responses towards an intruder, and then photostimulation was applied to the animal repeatedly by varying the irradiance, frequency, or duration of photostimulation, as well as the distance and the orientation of two animals at the onset of photostimulation. The intervals between photostimulation trials were >2.5 min. The frequency and duration of photostimulation were controlled using an Accupulse Generator (World Precision Instruments) or an Isolated Pulse Stimulator (A-M Systems). Laser power was controlled by dialing an analog knob on the power supply of the laser sources. The control and experimental animals were processed in a random order.
One to three days after the final behavioral assay, the mouse was transcardially perfused with 4% paraformaldehyde, and the brain was histologically analyzed to confirm viral expression in the target region, and ascertain the location of guide cannula or ferrule. Animals showing no detectable viral expression in the target region were excluded from statistical analysis. In some experiments, animals were photostimulated with a train of 473 nm light (20 ms-pulse, 20 Hz, 30 s/min for 20 min) 60 min prior to perfusion in the absence of an intruder at an intensity which had evoked a behavioral phenotype in the final testing session. Then, brain sections were labeled for c-Fos to identify optogenetically activated cells.
In addition to CI, mounting and attack, photostimulation occasionally evoked a “cornering” behavior in some ChR2-expressing animals, in tests performed after short times of viral incubation (See Supplementary Note 3 for further information).
(3) eNpHR3.0-mediated silencing
Esr1cre/+ males expressing eNpHR3.0 or control mCherry were introduced to one to four male and female intruders, respectively, in 2-3 acclimation sessions without photostimulation to assess baseline aggression and reproductive behaviors of Esr1cre/+ males as well as to augment aggressiveness and sexual behaviors in those animals. Animals that exhibited little aggression or reproductive behaviors during those initial sessions were excluded from subsequent testing sessions. During testing sessions, photostimulation (593 nm) ranging from 4.9-32.3 mW/mm2 was delivered continuously for 10 s during male-male encounters and for 3 min during male-female encounters. To examine whether interruption of approach led to attack, strongly aggressive resident animals were chosen and stimulated when they were charging intruders >∼5 cm from the intruder.
(4) Photostimulation intensity measurement
Light power was measured from the tip of a ferrule connected to a ferrule patch cord before being installed in the brain (the ferrule-connector system) or from the tip of optical fiber (the guide cannula system) at different laser output settings, using an optical power and energy meter and a photodiode power sensor (ThorLabs). Irradiance was then calculated using the brain tissue light transmission calculator provided by the Deisseroth laboratory (http://www.stanford.edu/group/dlab/cgi-bin/graph/chart.php) using laser power measured at the tip and the distance from the tip to the target brain region measured by histology.
(5) Behavioral annotation
Behavioral testing sessions were videotaped either from the side of the cage using Nero Vision and a camcorder (Sony), or simultaneously from both the side and top of the cage using StreamPix 5 (Norpix) and two scan cameras (Basler) with a infrared lens (Tamron) at a frame rate of 15-30 Hz. The camcorder and cameras were connected to a computer using IEEE 1394 FireWire cables. Behavioral annotation was carried out manually using custom software written in MATLAB as described previously32. An individual blind to the experimental design scored behavior on a frame-by-frame basis. The animals that exhibit no viral expression in a target brain region were excluded from analyses.
Histology
In situ hybridization (ISH) was carried out following the Allen Institute's ISH protocol (http://help.brain-map.org/display/mousebrain/Documentation)35. In situ probes for Esr1 and Cre were generated with the following primer sets: Cre probe, 5′-ccaatttactgaccgtacacca-3′ and 5′-tatttacattggtccagccacc-3′; Esr1 probe, 5′-taagaagaatagccctgccttg-3′ and 5′-acagtgtacgcaggagacagaa-3.′
For immunohistochemistry, animals were anesthetized with Ketamine and Xylazine, and then transcardially perfused with 10 ml phosphate-buffered saline (PBS), followed by 10 ml ice-cold 4% paraformaldehyde in 0.1 M phosphate buffer, pH 7.4. Dissected brains were post-fixed for 1-3 hours in 4% paraformaldehyde in 0.1 M phosphate buffer, pH 7.4 at 4 °C and transferred to 15% sucrose in 0.1 M phosphate buffer, pH 7.4. After overnight incubation at 4 °C, brains were frozen in Tissue-Tek O.C.T. embedding medium (Sakura). Coronal brain sections were cut at 30 μm using a cryostat (Leica Biosystems). Brain sections were rinsed briefly with phosphate-buffered saline. After blocking in 5% normal serum from host species where second antibody was generated from (Jackson ImmunoResearch), slides were treated with primary antibodies in 1% normal serum/0.3% Triton X-100/PBS overnight at 4 °C, followed by secondary antibody treatment at room temperature for 2 hrs. Sections were counterstained with NeuroTrace fluorescent Nissl stains (Invitrogen, N-21483, 1:100) or DAPI (Invitrogen, D3571, 300 nM). The primary antibodies used in this study are: rabbit anti-Esr1 (Santa Cruz Biotechnology, sc-542, 1:200) and goat anti-c-fos (Santa Cruz Biotechnology, sc52-g, 1:500). The fluorophore-conjugated secondary antibodies are: Alexa goat anti-rabbit (Invitrogen, A-11011, 1:500) and Alexa donkey anti-goat (Invitrogen, A-11055, 1:500). Fluorescent images were acquired using a confocal microscope (FluoView FV1000, Olympus). The number of fluorescent cells was counted manually as well as using MetaMorph Image Analysis Software (Molecular Devices). To detect the expression of Esr1 and c-Fos in the VMHvl of male brains (ED Fig. 1h-v), 40 μm free-floating brain sections were incubated with rabbit anti-Esr1 (Santa Cruz Biotechnology, 1:1000) and goat anti-c-Fos (Santa Cruz Biotechnology, 1:1000) antibodies in 10% normal donkey serum/0.3% Triton X-100/PBS for 72 hrs on a rocking shaker at 4 °C, following blocking in 10% normal donkey serum for 1 hr at room temperature. Brain sections were washed three times with PBS for 10 min each, and then incubated with Alexa donkey anti-rabbit IgG (Invitrogen, 1:500), Alexa donkey anti-goat IgG (Invitrogen, 1:500), and NeuroTrace fluorescent Nissl stains (Invitrogen, 1:200) in 10% normal donkey serum/0.3% Triton X-100/PBS for 2 hrs at room temperature. After washing with PBS 3 times for 10 min each, brain sections were mounted on slides.
Electrophysiological recordings of acute hypothalamic slices
All procedures for preparing acute brain slices and whole-cell recordings with optogenetic stimulations were carried out as described previously36, 37. Esr1cre/+ males were injected into VMHvl with a Cre-dependent AAV5 encoding ChR2-EYFP (AAV5.EF1α.FLEX.ChR2-EYFP) or a Cre-dependent AAV2 encoding eNpHR3.0-mCherry (AAV2.EF1α.FLEX.eNpHR3.0-mCherry) in a volume of 300 nl. After a 3-4-week viral incubation, coronal sections including the VMH were cut at 300 μm using a vibratome (VT-1000S, Leica Microsystems) in ice-cold cutting solution (composition in mM: 234 sucrose, 28 NaHCO3, 7 dextrose, 2.5 KCl, 7 MgCl2, 0.5 CaCl2, 1 sodium ascorbate, 3 sodium pyruvate and 1.25 NaH2PO4, oxygenated with 95% O2/5% CO2). Slices were then incubated in artificial cerebrospinal fluid (ACSF; composition in mM: 119 NaCl, 25 NaHCO3, 11 D-glucose, 2.5 KCl, 1.25 MgCl2, 2 CaCl2 and 1.25 NaH2PO4, aerated with 95% O2/5% CO2) at 32 °C for at least one hour, and recorded at room temperature (20-25 °C). Cells expressing a virally-encoded fluorescent marker (ChR2-EYFP and eNpHR3.0-mCherry) were visualized by infrared differential interference contrast (IR DIC) and fluorescence video microscopy (Olympus BX51). Whole-cell current clamp recordings were performed with a MultiClamp 700B amplifier and Digidata 1440A (Molecular Devices). The patch clamp electrode (5–8 MΩ) was backfilled with an intracellular solution (composition in mM: 125 potassium gluconate, 10 KCl, 10 HEPES, 1 EGTA, 4 Mg-ATP, 0.3 Na2GTP, and 10 sodium phosphocreatine, pH 7.25, 280–300 mosM). Data were sampled at 10 kHz, filtered at 3 kHz, digitized and analyzed with pClamp10 software (Molecular Devices). Photostimulation (ChR2, 473 nm, 2-ms pulses; eNpHR3, 532 nm, continuous; CrystaLaser) was applied to the hypothalamic slices from the tip of an optical fiber (200 μm in core diameter; ThorLabs) located at the dorsolateral edge of the VMHvl (∼700 μm from the center of VMHvl). The spike fidelity in ChR2-expressing Esr1+ neurons was measured by counting the number of light pulses that successfully evoked action potentials upon 473 nm photostimulation (2- or 20-ms pulses) at different frequencies (2, 5, 10, 20, and 40 Hz).
Calcium imaging of acute hypothalamic slices
Esr1cre/+ males were injected into the VMHvl with a mixture of AAV5 encoding Cre-dependent ChR2-EYFP (AAV5.EF1α.FLEX.ChR2-EYFP), AAV2 encoding Cre-dependent nuclear mCherry (AAV2.EF1α.FLEX.nuclear mCherry), and AAV1 encoding GCaMP6S38 (AAV1.Syn.GCaMP6s), in a volume of 300 nl (2:1:1 volume ratio). In control experiments, the same viral mixture without AAV5.EF1α.FLEX.ChR2-EYFPwas injected. After a 3.5-week viral incubation, acute hypothalamic slices were prepared from the virus-injected mice similar to the procedures described above in “electrophysiological slice recordings.” Calcium imaging was carried out using a two-photon laser-scanning microscope (Ultima, Prairie Instruments Inc.) with a 20×/1.0-NA XLUMPlanFL/N water-immersion objective (Olympus). The Ti:sapphire laser was tuned to 940 nm (power: 10 mW), and 512 × 512 pixel images were acquired at 1.3 Hz frame rate (1.6 μs dwell time per pixel) through 525/50 nm emission filter. Photostimulation (445 nm, 2-ms pulse, 20 Hz) was applied to the dorsolateral edge of the VMHvl (∼700 μm from the center of VMHvl) at different intensities (4.8, 14.5, 30.2, 4.8 mW) with 3-min intervals between photostimulation trials. Data were analyzed using the custom software written in MATLAB (VivoViewer) as described previously39. In brief, the raw fluorescence images were smoothened using a two-dimensional Gaussian filter. We then calculated the fluorescence changes relative to the baseline (ΔF/F = (F − F0)/F0 where F0 is the average pixel intensity in the first 3–6 baseline frames of the experiment) in each GCaMP6s+ cell (detected manually). Because the 445-nm photostimulation used to activate ChR2 could penetrate through the emission filter and affect ΔF/F, ΔF/Fpeak and ΔF/Farea during the photostimulation periods were excluded from analysis. “Activated cells” for Fig. 4r were operationally defined as cells showing an increase in ΔF/F >5 standard deviations from baseline ΔF/F measured from 5 frames prior to the first photostimulation.
In vivo electrophysiological recordings
In vivo extracellular recordings were carried out as described previously with modifications32. A custom built optrode was used to obtain multi-unit activity, comprising a 62.5 µm core optical fiber and a tungsten microwire bundle. The mouse line (Esr1cre/+) and viral expression of ChR2 (AAV2.EF1 α .FLEX.ChR2-F2A-nuclear hrGFP) were identical to that used in the behavioral experiments. Photostimulation parameters for a given optrode were calibrated prior to implantation so that the transmitted light would irradiate the brain tissue at 1.0 to 1.5 mW/mm2, measured under constant illumination. Recordings were obtained using the same photostimulation parameters as those used in the behavioral experiments i.e. at 20 Hz with 20 ms pulse-width, and also with 10 ms and 2 ms pulse-widths so as to determine any linearity or trends between the stimulation parameters and response (ED Fig. 2a). Neural activity was recorded over a baseline period of 30 s, followed by a photostimulation period of 30s, followed by a post-stimulation/recovery period of 60 s. 5 trials were obtained for each recording site and the photostimulation periods between two successive trials were at least 2 minutes apart.
Extracellular recordings are traditionally resolved into the activity profiles of single units obtained through spike-sorting, where variations in spike waveform properties are used to assign individual spikes to single units. However, photostimulation has been demonstrated to deform spike waveforms40 and the variance in spike waveform shape under 10 ms and 20 ms photostimulation pulse-widths greatly hindered the assignment of photostimulated spikes to individual units. To overcome this limitation all spikes recorded at a single microwire electrode (crossing a threshold two standard-deviations over baseline, spike wavelength around 1ms and interspike interval greater than 2 ms) were grouped together into a multi-unit. Hardware and software provisions for eliminating photoelectric artifact were used41. Acquired data was analyzed post-hoc in Matlab using custom-written scripts. Peri-stimulus time-histograms were constructed using bins of 100 ms and plotted with Gaussian smoothing.
We used a two-step process to determine that the multi-units recorded were within the VMHvl. First we shortlisted multi-units where the average activity during the entire period of 30 s using 2 ms pulses and 20 Hz photostimulation (P) was greater than one standard deviation (S) over the average baseline (B) activity (P>B+S). Next the implanted animals were placed in a resident-intruder assay and the multi-units were further shortlisted based on whether constituent single units were identified to be strongly responsive during mating or aggressive epochs. Overall, from a total of 22 recording sites only 12 multi-units were determined to be localized within the VMHvl.
Extended Data
Extended Data Figure 1. Esr1 mRNA expression in Esr1cre/+ male and female mice.
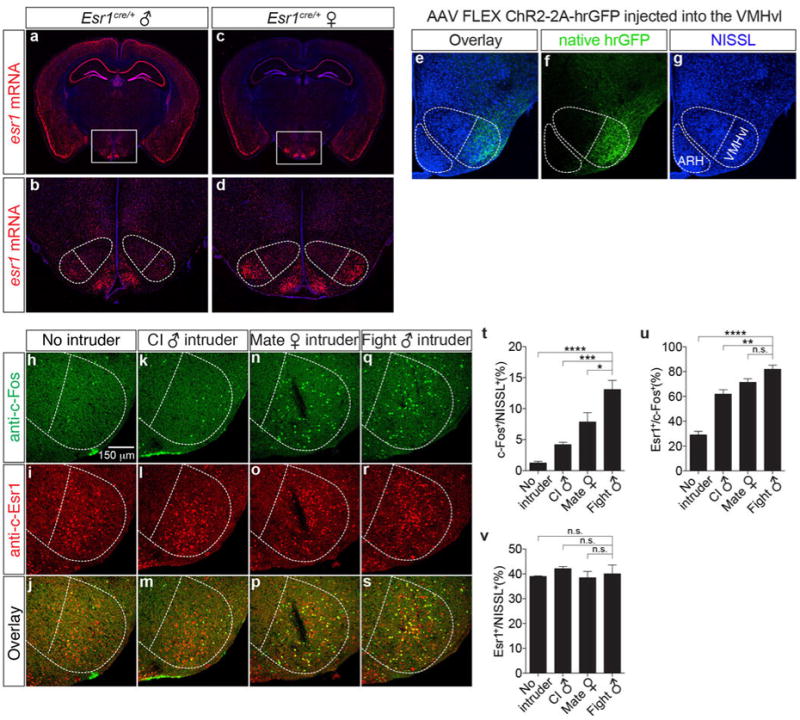
In situ hybridization for Esr1mRNA in Esr1cre/+ male (a, b, red) and female (c, d, red) mice (Bregma ∼-1.65 mm). b-d are the boxed areas in a-c. Note that the expression of esr1 mRNA in VMHvl (dotted outline) is higher in females than in males. e-g. Immunofluorescence showing that expression of a Cre-dependent hrGFP reporter expressed from a stereotaxically injected rAAV (f, green) is restricted to VMHvl, without detectable spillover expression in the nearby arcuate hypothalamic nucleus (ARH). h-s. Double labeling for behaviorally-induced c-Fos (h, k, n, q, anti-c-Fos, green) and Esr1 (i, l, o, r, anti-Esr1, red) in wild-type male residents following a 30-min resident-intruder test with no (h-j, n=3), male (k-m, close investigation without attack, n=4; q-s, attack, n=5) or female (n-p, mating, n=5) intruders. t-v. Quantification of the fraction of total (NISSL+) cells that were c-Fos+ following different behaviors (t), fraction of c-Fos+ that were Esr1+for each behavior (u), and fraction of NISSL+ cells that are Esr1+(v) in VMHvl, quantified from data as illustrated in (h-s). *p<0.05, ***p<0.001, ****p<0.0001; one-way ANOVA with Dunnett's multiple comparisons test.
Extended Data Figure 2. In vivo electrophysiological responses of Esr1+ VMHvl neurons during photostimulation with 2, 10, and 20-ms pulses.
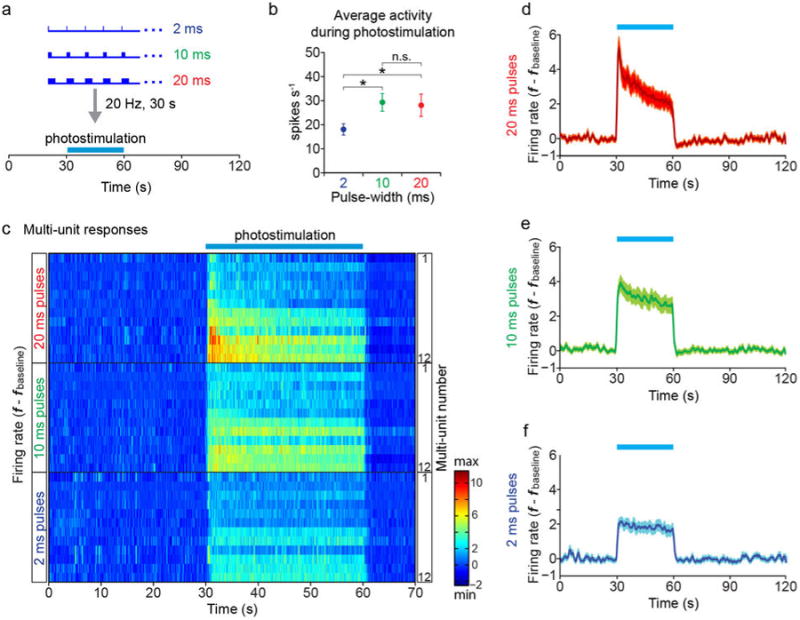
a, Photostimulation paradigm. Extracellular recordings were obtained from Esr1+ VMHvl cells expressing rAAV2 Cre-dependent ChR2 in solitary, awake behaving animals using a modification of a 16-wire electrode bundle micro-drive31 containing an integrated optic fiber. Following a 30-s baseline measurement, photostimulation trials were performed (473 nm, 20 Hz, blue bars) for 30 s using three different pulse-widths (2 ms, 10 ms, and 20 ms). Five trials, each 2 minutes in length, were recorded for each pulse-width (see (c)). b, Mean firing rate changes averaged across 12 multi-units (5 trials/unit) in VMHvl during 30-s photostimulation periods. 2 ms, 17.98±2.35 spikes/sec, 10 ms, 29.26±3.67 spikes/sec, and 20 ms, 28.07±4.65 spikes/sec. *p<0.05, Wilcoxon rank sum test. c, Spiking responses of 12 multi-unit recording channels in VMHvl. Each raster plot represents the average of five trials per channel per pulse-width (2, 10 or 20 ms), arranged in order of response magnitude. The arrangement is the same for the three pulse widths (2 ms, 10 ms and 20 ms). d-f, Peri-stimulus time histograms (PSTHs) illustrating mean firing rate changes averaged over the 12 multi-units shown in (c), for photostimulation trials using 20 ms (d), 10 ms (e), or 2 ms (f) light pulse-widths. Data are mean ± SEM. See also main Figure 2d, which presents whole-cell patch clamp recordings from Esr1+ neurons in VMHvl acute slice preparations, indicating that spike fidelity is close to 100% and statistically indistinguishable between 2 ms and 20 ms light pulse-widths.
Extended Data Figure 3. Photostimulation of Esr1+ VMHvl neurons expressing mCherry or Esr1- VMHvl neurons expressing ChR2 fails to evoke aggression.
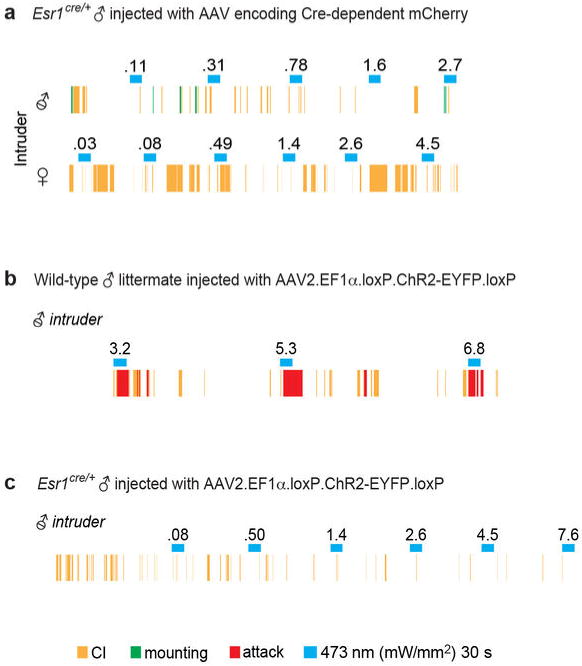
a. Animals expressing Cre-dependent mCherry virus in VMHvl fail to show aggression during photostimulation. Representative raster plot showing episodes of Close Investigation (CI; yellow ticks), mounting (green ticks) or attack (red ticks) in an mCherry-expressing Esr1cre/+ male. No attacks are evoked towards either a castrated male (upper plot) or an intact unreceptive female (lower plot) during photostimulation trials (blue bars; 473 nm, 20ms pulses, 20 Hz, 30 s; numbers indicate mW/mm2). b-c. Activation of the non-Esr1-expressing subpopulations of VMHvl neurons is insufficient to evoke aggression. Representative raster plots illustrating photostimulation-evoked behavioral responses towards a castrated male by a wild-type (b) or an Esr1cre/+(c) mouse injected with the “Cre-out” AAV2 containing a “floxed” ChR2 coding sequence (Fig. 2r). Attack (red rasters; 3.2-6.8 mW/mm2) was elicited during photostimulation trials (blue bars) in wild-type males, indicating that the floxed ChR2 construct is effective in the absence of Cre, whereas no behavior was evoked in Esr1cre/+ males where ChR2 is expressed in Esr1-, but not in Esr1+, neurons.
Extended Data Figure 4. Latency to attack depends on the initial orientation of the resident with respect to the intruder at the time of photostimulation.
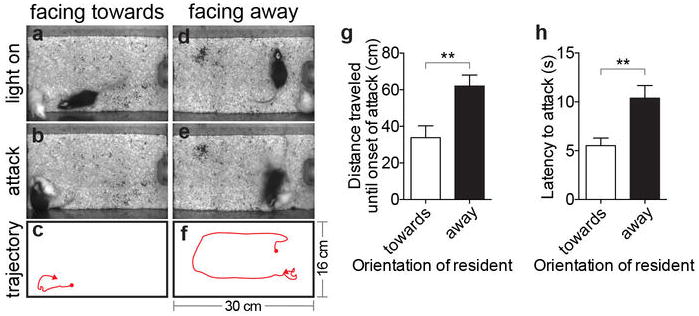
(a, b) and (d, e). Video stills illustrating initial position and orientation (“facing toward vs. away”) of a ChR2-expressing Esr1cre/+ male (black) towards a castrated male intruder (white) at the onset of photostimulation (a, d) and at the initiation of evoked attack (b, e). (c, f), trajectory plots showing the paths taken by the Esr1cre/+ males from the onset of photostimulation (red dots) to the onset of attack (red arrowheads). Cage dimensions indicated in f. (g, h). Quantification of distance traveled from onset of photostimulation to attack (g) and latency to attack (h), from data in (a-f) (n=11, **p<0.01, Mann-Whitney U-test). Note that if the resident is initially facing away from the intruder (d-f), the latency to attack is longer (h) because the resident initially moves in the direction that it was facing (f) and does not attack until it encounters the intruder at close range. Data are mean ± SEM. n=number of animals.
Extended Data Figure 5. Photostimulation of VMHvl Esr1+ neurons in females evokes close investigation and mounting.
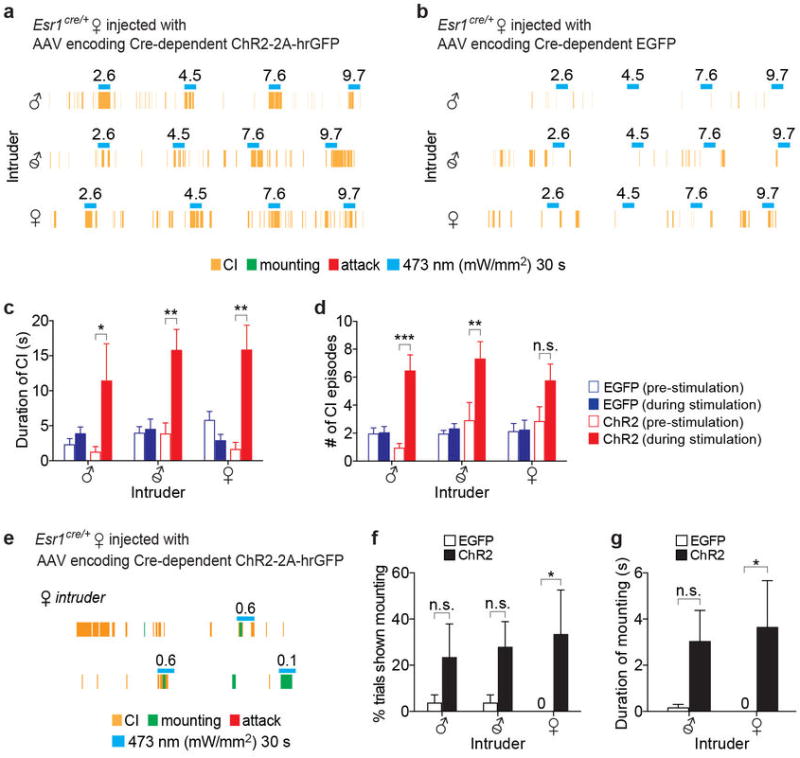
a-b. Representative raster plots illustrating photostimulation-evoked behaviors in Esr1cre/+ females expressing either ChR2 (a) or EGFP (b) in VMHvl towards an intact male (upper), a castrated male (middle), or an intact female (lower). Note that CI (yellow rasters) is augmented during photostimulation in the animal expressing ChR2, but not in the animal expressing EGFP. c-d. Quantification of CI by Esr1cre/+ females expressing EGFP (blue bars; n=4 per intruder) or ChR2 (red bars; n=3 per intruder) during 30 s prior to photostimulation (open symbols) vs. during 30 s photostimulation period (solid symbols). *p<0.05, **p<0.01, ***p<0.001; two-way ANOVA with Tukey's multiple comparisons test. e. Raster plot illustrating that photostimulation of Esr1cre/+ female expressing ChR2 evokes mounting (green rasters), but failed to elicit male-like aggression. f-g. Quantification of mounting parameters by Esr1cre/+ females expressing EGFP (open bars; n=4 per intruder) or ChR2 (black bars; n=3 per intruder) towards the indicated intruders. Two-way ANOVA with Tukey's multiple comparisons test, *p=0.02 (f) and *p=0.03 (g) without correction for multiple comparisons, but not significant when corrected (p=0.07 (f), and p=0.06 (g)). Data are mean ± SEM. n=number of animals.
Extended Data Figure 6. CI and mounting are evoked at lower photostimulation intensities than attack.
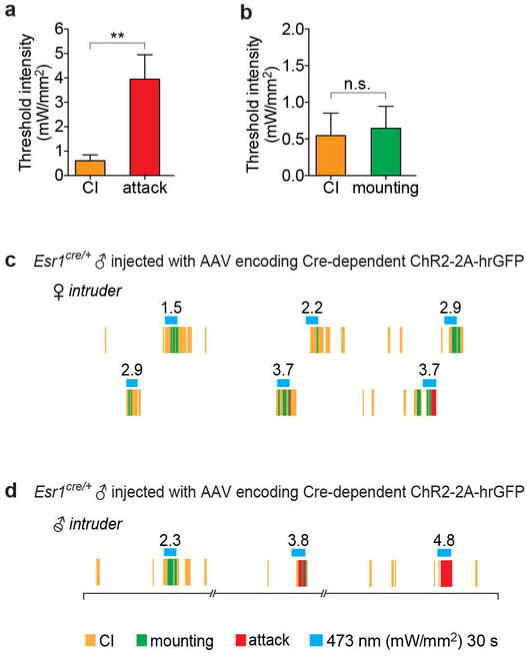
a-b. The average threshold intensity of photostimulation that evokes close investigation (CI) is similar to that required to evoke mounting (b), but significantly lower than that required to evoke attack (a). Data represent ChR2-expressing Esr1cre/+ males that exhibited CI and attack (a, n=12 per group) or CI and mounting (b, n=9 per group) in a given test session. **p<0.01; Mann-Whitney U-test. Data are mean ± SEM. n=number of animals. c-d. Raster plot from a test session with the same resident male, showing that activation of VMHvl Esr1+ neurons elicits mounting and/or attack towards a castrated male intruder, dependent upon the intensity of photostimulation. c. A raster plot illustrating the experiment shown in Supplementary Video 6. Mounting (green rasters) was elicited in a ChR2-expressing Esr1cre/+ male toward an unreceptive intact female during photostimulation trials (blue bars; 30 s). Note that mounting was followed by attack (red rasters) in the high intensity photostimulation trials (3.7 mW/mm2). d. A raster plot illustrating a shift in behavioral responses from mounting to attack toward a castrated male intruder dependent upon photostimulation intensity (see Fig. 4a for the behavioral shift toward a female intruder). Note that time line is not continuous at the breakage in the line under rasters.
Extended Data Figure 7. Optogenetic silencing of VMHvl Esr1+ neurons does not affect reproductive behaviors towards females.

a-d. Quantification of female-directed mating behaviors during photostimulation of Esr1cre/+ males expressing mCherry (n=4-5) or eNpHR3.0 (n=14-17). a-b and d. Parameters of reproductive behaviors during photostimulation trials (3 min) were normalized to those during non-stimulated periods. c. The latency from the onset of photostimulation to the first mounting. n.s.=not significant; Mann-Whitney U-test. Data are mean ± SEM. n=number of animals.
Extended Data Figure 8. Relationship between behavioral response and photostimulation frequency.
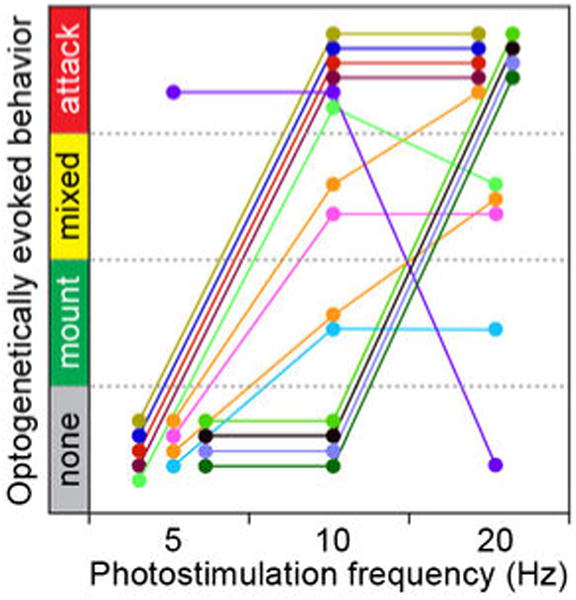
Behaviors evoked by optogenetic activation of ChR2-expressing Esr1cre/+ males at the indicated photostimulation frequencies are plotted (5, 10, and 20 Hz). Different photostimulation intensities were applied in different episodes (colored lines). In each episode, photostimulation frequency was varied at a fixed intensity. Only 2/14 stimulation episodes (orange) exhibited a behavioral shift from mounting to mixed to attack behaviors with increasing photostimulation frequency. Data from n=11 animals.
Extended Data Figure 9. An example of hysteresis.
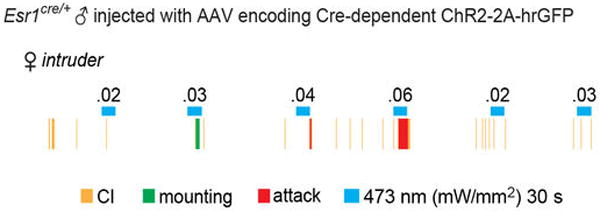
A representative raster plot illustrating a shift from mounting (0.3 mW/mm2) to attack (0.6 mW/mm2) with increasing photostimulation intensity. Note that once attack was elicited, reducing the photostimulation intensity back to 0.3 mW/mm2 no longer evoked mounting, but simply failed to elicit attack. Whether this hysteresis is intrinsic to the animal, or represents a form of conditioning, is not clear.
Extended Data Figure 10. Two alternative models to explain how activation of Esr1+ neurons in VMHvl can promote mounting and attack depending on conditions.
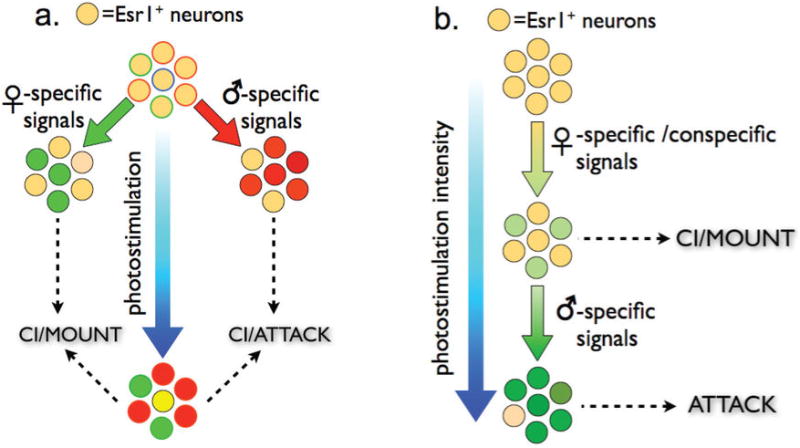
See Supplementary Note 2.
Supplementary Material
Acknowledgments
We thank C. Park for behavioral scoring, R. Robertson for behavioral scoring and MATLAB programming, L. Lo for testing Cre-mediated recombination in Esr1cre/+ male mice, C. Chiu and X. Wang for histology, M. McCardle for genotyping, J.S. Chang for technical assistance, S. Pease for generation of knock-in mice, H. Cai for training in slice electrophysiology, A. Wong for assistance with 2-photon imaging, K. Deisseroth and J. Harris for AAV constructs, E. Boyden for advice on ferrule fiber fabrication, D. Lin and M. Boyle for their contributions to early stages of this project, W. Hong and R. Axel for comments on the manuscript, C. Chiu for laboratory management and G. Mancuso for administrative assistance. D.J.A. is an Investigator of the Howard Hughes Medical Institute and a Paul G. Allen Distinguished Investigator. This work was supported in part by NIH grant no. R01MH070053, and grants from the Gordon Moore Foundation and Ellison Medical Research Foundation. H.L. was supported by the NIH Pathway to Independence Award 1K99NS074077. T.E.A. was supported by NIH NRSA postdoctoral fellowship grant 1F32HD055198-01 and a Beckman Fellowship.
Footnotes
Author Contributions: H.L. characterized Esr1cre mice, designed and performed optogenetic behavioral experiments and co-wrote the manuscript; D.K. performed slice electrophysiology and imaging experiments; R.R. performed in vivo electrophysiology; T.E. A. generated the Esr1cre targeting construct and AAV vectors; A.C. carried out some behavioral experiments; L.M. and H.Z. performed ISH experiments; D.J.A. supervised experiments and co-wrote the manuscript.
References
- 1.Tinbergen N. Symposiua of the Society for Experimental Biology. IV. Academic Press, Inc.; 1950. Physiological Mechanisms in Animal Behaviour; pp. 305–312. [Google Scholar]
- 2.Devidze N, Lee A, Zhou J, Pfaff D. CNS arousal mechanisms bearing on sex and other biologically regulated behaviors. Physiology & Behavior. 2006;88:283–293. doi: 10.1016/j.physbeh.2006.05.030. [DOI] [PubMed] [Google Scholar]
- 3.Lin D, et al. Functional identification of an aggression locus in the mouse hypothalamus. Nature. 2011;470:221–226. doi: 10.1038/nature09736. [DOI] [PMC free article] [PubMed] [Google Scholar]
- 4.Lein ES, et al. Genome-wide atlas of gene expression in the adult mouse brain. Nature. 2007;445:168–176. doi: 10.1038/nature05453. [DOI] [PubMed] [Google Scholar]
- 5.Morgan JI, Cohen DR, Hempstead JL, Curran T. Mapping patterns of c-fos expression in the central nervous system after seizure. Science. 1987;237:192–197. doi: 10.1126/science.3037702. [DOI] [PubMed] [Google Scholar]
- 6.Walter P, et al. Cloning of the human estrogen receptor cDNA. Proc Natl Acad Sci U S A. 1985;82:7889–7893. doi: 10.1073/pnas.82.23.7889. [DOI] [PMC free article] [PubMed] [Google Scholar]
- 7.Xu X, et al. Modular genetic control of sexually dimorphic behaviors. Cell. 2012;148:596–607. doi: 10.1016/j.cell.2011.12.018. [DOI] [PMC free article] [PubMed] [Google Scholar]
- 8.Boyden ES, Zhang F, Bamberg E, Nagel G, Deisseroth K. Millisecond-timescale, genetically targeted optical control of neural activity. Nat Neurosci. 2005;8:1263–1268. doi: 10.1038/nn1525. [DOI] [PubMed] [Google Scholar]
- 9.Aravanis AM, et al. An optical neural interface: in vivo control of rodent motor cortex with integrated fiberoptic and optogenetic technology. Journal of neural engineering. 2007;4:S143–156. doi: 10.1088/1741-2560/4/3/S02. [DOI] [PubMed] [Google Scholar]
- 10.Blanchard DC, Blanchard RJ. Ethoexperimental approaches to the biology of emotion. Annu Rev Psychol. 1988;39:43–68. doi: 10.1146/annurev.ps.39.020188.000355. [DOI] [PubMed] [Google Scholar]
- 11.Yang CF, et al. Sexually dimorphic neurons in the ventromedial hypothalamus govern mating in both sexes and aggression in males. Cell. 2013;153:896–909. doi: 10.1016/j.cell.2013.04.017. [DOI] [PMC free article] [PubMed] [Google Scholar]
- 12.Sano K, Tsuda MC, Musatov S, Sakamoto T, Ogawa S. Differential effects of site-specific knockdown of estrogen receptor alpha in the medial amygdala, medial pre-optic area, and ventromedial nucleus of the hypothalamus on sexual and aggressive behavior of male mice. Eur J Neurosci. 2013;37:1308–1319. doi: 10.1111/ejn.12131. [DOI] [PubMed] [Google Scholar]
- 13.Gradinaru V, et al. Molecular and cellular approaches for diversifying and extending optogenetics. Cell. 2010;141:154–165. doi: 10.1016/j.cell.2010.02.037. [DOI] [PMC free article] [PubMed] [Google Scholar]
- 14.Blanchard RJ, Wall PM, Blanchard DC. Problems in the study of rodent aggression. Hormones and behavior. 2003;44:161–170. doi: 10.1016/s0018-506x(03)00127-2. [DOI] [PubMed] [Google Scholar]
- 15.Chen TW, et al. Ultrasensitive fluorescent proteins for imaging neuronal activity. Nature. 2013;499:295–300. doi: 10.1038/nature12354. [DOI] [PMC free article] [PubMed] [Google Scholar]
- 16.Lerchner W, et al. Reversible silencing of neuronal excitability in behaving mice by a genetically targeted, ivermectin-gated Cl- channel. Neuron. 2007;54:35–49. doi: 10.1016/j.neuron.2007.02.030. [DOI] [PubMed] [Google Scholar]
- 17.Cohen RS, Pfaff DW. Ventromedial hypothalamic neurons in the mediation of long-lasting effects of estrogen on lordosis behavior. Prog Neurobiol. 1992;38:423–453. doi: 10.1016/0301-0082(92)90045-g. 0301-0082(92)90045-G [pii] [DOI] [PubMed] [Google Scholar]
- 18.Musatov S, Chen W, Pfaff DW, Kaplitt MG, Ogawa S. RNAi-mediated silencing of estrogen receptor {alpha} in the ventromedial nucleus of hypothalamus abolishes female sexual behaviors. Proc Natl Acad Sci U S A. 2006;103:10456–10460. doi: 10.1073/pnas.0603045103. 0603045103[pii] 10.1073/pnas.0603045103. [DOI] [PMC free article] [PubMed] [Google Scholar]
- 19.Spiteri T, et al. Estrogen-induced sexual incentive motivation, proceptivity and receptivity depend on a functional estrogen receptor alpha in the ventromedial nucleus of the hypothalamus but not in the amygdala. Neuroendocrinology. 2010;91:142–154. doi: 10.1159/000255766. [DOI] [PMC free article] [PubMed] [Google Scholar]
- 20.Spiteri T, et al. The role of the estrogen receptor alpha in the medial amygdala and ventromedial nucleus of the hypothalamus in social recognition, anxiety and aggression. Behav Brain Res. 2010;210:211–220. doi: 10.1016/j.bbr.2010.02.033. S0166-4328(10)00146-4 [pii]10.1016/j.bbr.2010.02.033. [DOI] [PubMed] [Google Scholar]
- 21.Simerly RB. Wired for reproduction: organization and development of sexually dimorphic circuits in the mammalian forebrain. Annu Rev Neurosci. 2002;25:507–536. doi: 10.1146/annurev.neuro.25.112701.142745. [DOI] [PubMed] [Google Scholar]
- 22.Morris JA, Jordan CL, Breedlove SM. Sexual differentiation of the vertebrate nervous system. Nat Neurosci. 2004;7:1034–1039. doi: 10.1038/nn1325. 10.1038/nn1325nn1325 [pii] [DOI] [PubMed] [Google Scholar]
- 23.Wu MV, Shah NM. Control of masculinization of the brain and behavior. Curr Opin Neurobiol. 2011;21:116–123. doi: 10.1016/j.conb.2010.09.014. S0959-4388(10)00184-4 [pii]10.1016/j.conb.2010.09.014. [DOI] [PMC free article] [PubMed] [Google Scholar]
- 24.Kow LM, Easton A, Pfaff DW. Acute estrogen potentiates excitatory responses of neurons in rat hypothalamic ventromedial nucleus. Brain Research. 2005 doi: 10.1016/j.brainres.2005.02.068. [DOI] [PubMed] [Google Scholar]
- 25.Bentley D, Konishi M. Neural control of behavior. Annual review of neuroscience. 1978;1:35–59. doi: 10.1146/annurev.ne.01.030178.000343. [DOI] [PubMed] [Google Scholar]
- 26.Kruk MR, et al. Discriminant analysis of the localization of aggression-inducing electrode placements in the hypothalamus of male rats. Brain Res. 1983;260:61–79. doi: 10.1016/0006-8993(83)90764-3. 0006-8993(83)90764-3 [pii] [DOI] [PubMed] [Google Scholar]
- 27.Anderson DJ. Optogenetics, Sex, and Violence in the Brain: Implications for Psychiatry. Biol Psychiatry. 2011 doi: 10.1016/j.biopsych.2011.11.012. [DOI] [PMC free article] [PubMed] [Google Scholar]
- 28.Kristan WB. Neuronal Decision-Making Circuits. Current Biology. 2008;18:R928–R932. doi: 10.1016/j.cub.2008.07.081. [DOI] [PubMed] [Google Scholar]
- 29.Haubensak W, et al. Genetic dissection of an amygdala microcircuit that gates conditioned fear. Nature. 2010;468:270–276. doi: 10.1038/nature09553. [DOI] [PMC free article] [PubMed] [Google Scholar]
- 30.Vrontou S, Wong AM, Rau KK, Koerber HR, Anderson DJ. Genetic identification of C fibres that detect massage-like stroking of hairy skin in vivo. Nature. 2013;493:669–673. doi: 10.1038/nature11810. [DOI] [PMC free article] [PubMed] [Google Scholar]
- 31.Wu Y, Wang C, Sun H, LeRoith D, Yakar S. High-efficient FLPo deleter mice in C57BL/6J background. PloS one. 2009;4:e8054. doi: 10.1371/journal.pone.0008054. [DOI] [PMC free article] [PubMed] [Google Scholar]
- 32.Lin D, et al. Functional identification of an aggression locus in the mouse hypothalamus. Nature. 2011;470:221–226. doi: 10.1038/nature09736. [DOI] [PMC free article] [PubMed] [Google Scholar]
- 33.Harris JA, Oh SW, Zeng H. Adeno-associated viral vectors for anterograde axonal tracing with fluorescent proteins in nontransgenic and cre driver mice. Curr Protoc Neurosci. 2012;Chapter 1:21–18. doi: 10.1002/0471142301.ns0120s59. Unit 1 20. [DOI] [PubMed] [Google Scholar]
- 34.Chan E, Kovacevic N, Ho SK, Henkelman RM, Henderson JT. Development of a high resolution three-dimensional surgical atlas of the murine head for strains 129S1/SvImJ and C57Bl/6J using magnetic resonance imaging and micro-computed tomography. Neuroscience. 2007;144:604–615. doi: 10.1016/j.neuroscience.2006.08.080. [DOI] [PubMed] [Google Scholar]
- 35.Lein ES, et al. Genome-wide atlas of gene expression in the adult mouse brain. Nature. 2007;445:168–176. doi: 10.1038/nature05453. [DOI] [PubMed] [Google Scholar]
- 36.Haubensak W, et al. Genetic dissection of an amygdala microcircuit that gates conditioned fear. Nature. 2010;468:270–276. doi: 10.1038/nature09553. [DOI] [PMC free article] [PubMed] [Google Scholar]
- 37.Atasoy D, Betley JN, Su HH, Sternson SM. Deconstruction of a neural circuit for hunger. Nature. 2012;488:172–177. doi: 10.1038/nature11270. [DOI] [PMC free article] [PubMed] [Google Scholar]
- 38.Chen TW, et al. Ultrasensitive fluorescent proteins for imaging neuronal activity. Nature. 2013;499:295–300. doi: 10.1038/nature12354. nature12354 [pii]10.1038/nature12354. [DOI] [PMC free article] [PubMed] [Google Scholar]
- 39.Vrontou S, Wong AM, Rau KK, Koerber HR, Anderson DJ. Genetic identification of C fibres that detect massage-like stroking of hairy skin in vivo. Nature. 2013;493:669–673. doi: 10.1038/nature11810. [DOI] [PMC free article] [PubMed] [Google Scholar]
- 40.Cohen JY, Haesler S, Vong L, Lowell BB, Uchida N. Neuron-type-specific signals for reward and punishment in the ventral tegmental area. Nature. 2012;482:85–88. doi: 10.1038/nature10754. [DOI] [PMC free article] [PubMed] [Google Scholar]
- 41.Kvitsiani D, et al. Distinct behavioural and network correlates of two interneuron types in prefrontal cortex. Nature. 2013;498:363–366. doi: 10.1038/nature12176. [DOI] [PMC free article] [PubMed] [Google Scholar]
Associated Data
This section collects any data citations, data availability statements, or supplementary materials included in this article.


