

Abstract
Background
Curable, non-viral pathogens account for a significant burden of sexually transmitted infections (STIs), and there is established evidence that STIs increase both HIV acquisition and transmission. We investigated the prevalence, trends, and factors associated with Chlamydia trachomatis, Neisseria gonorrhoeae, Trichomonas vaginalis and Treponema pallidum, and the performance of syndromic management, among a cohort of women working in bars, hotels, and other food and recreational facilities near large-scale mines in northwestern Tanzania.
Methods
HIV-negative women aged 18–44 years (N = 966) were enrolled and followed for 12 months in a microbicides feasibility study. We collected sociodemographic and behavioural data, performed clinical examinations, and tested for STIs, at enrolment and 3-monthly. Risk factors for STIs were investigated using logistic regression models with random effects. Sensitivity, specificity and predictive values of syndromic management were calculated.
Results
At enrolment, the prevalences of C. trachomatis, N. gonorrhoeae, T. vaginalis, and high-titre active syphilis were 111/956 (12%), 42/955 (4%), 184/945 (19%) and 46/965 (5%), respectively. There were significant decreases over time for C. trachomatis and T. vaginalis (OR trend per month: 0.94 [95% CI 0.91, 0.97]; and 0.95 [0.93, 0.98], respectively; both p<0.001). The majority of these infections were not diagnosed by the corresponding syndrome; therefore, most participants were not treated at the diagnosis visit. Syndromic management was poorly predictive of laboratory-diagnosed infections. We identified a number of risk factors for STIs, including low educational level, some sexual behaviours, and ever having been pregnant.
Conclusions
This analysis demonstrates that the prevalences of curable STIs are high among women who work in food and recreational facilities in northwestern Tanzania. Most of these infections are missed by syndromic management. Accurate and affordable rapid-point-of-care tests and innovative interventions are needed to reduce the burden of STIs in this population which is at increased risk for HIV.
Introduction
Despite steady advances in diagnosis, treatment, and public health interventions, sexually transmitted infections (STIs) continue to affect a large proportion of those living in resource-limited settings, particularly women of reproductive age [1]. Curable, non-viral pathogens (including Chlamydia trachomatis, Neisseria gonorrhoeae, Trichomonas vaginalis and Treponema pallidum) account for a significant burden of STIs [2]. There is established evidence that STIs increase both HIV acquisition and transmission [3]–[5]. Furthermore, untreated infections can lead to adverse reproductive health outcomes including pelvic inflammatory disease, infertility, premature labour, low birth weight, and congenital infections [6]–[8].
Women working in bars, hotels and other food and recreational facilities in Tanzania have been documented to have higher risk of STIs, including HIV, than the general population [9]–[12]. Studies in similar populations in Mbeya, Moshi, Mwanza city, and Mwanza region, Tanzania, reported prevalences of 6–13% for C. trachomatis, 4–22% for N. gonorrhoeae, 12–24% for T. vaginalis, and 8–24% for active infection with T. pallidum (i.e. active syphilis) [9], [10], [12], [13]. The Tanzanian Ministry of Health advocates syndromic management of STIs [14]. Syndromic management is based on the identification of a syndrome (a group of symptoms and easily recognised signs), and the provision of treatment targeting the organisms mainly responsible for causing the syndrome [15]. However, several recent papers have reported relatively poor performance of this approach among women due to most infections being asymptomatic [16], [17]. Better knowledge of the epidemiology of STIs among women who are most vulnerable to these infections may lead to improved treatment policies and prevention programmes to reduce their burden and mitigate subsequent reproductive health problems.
In this report, we aim to describe the prevalence, trends and risk factors of curable, non-viral STIs among women at increased risk for HIV infection in northwestern Tanzania who participated in a 12 month prospective cohort study designed to assess feasibility for conducting future microbicide trials. The background HIV prevalence in this population is 16%, and data on viral infections including HIV-1 and Herpes simplex virus 2 (HSV-2) have been reported elsewhere [18].
Methods
Ethical statement
The study was approved by the Ethics Committees of the National Institute for Medical Research and London School of Hygiene and Tropical Medicine. All participants gave written informed consent. Participants' confidentiality was ensured by excluding personal identification (such as names) from forms used to collect study information and by storing study documents and samples in a secure location. Study staff members were trained on issues of confidentiality, good clinical practice, research ethics and protection of human subjects.
Study procedures
HIV-1 seronegative, non-pregnant women aged 18–44 years working in bars, hotels, and other food and recreational facilities in the three towns of Geita, Shinyanga and Kahama in northwestern Tanzania were recruited into a 12 month microbicide feasibility study in 2008–2010. These towns are located near large-scale gold or diamond mines in which there are large populations of migratory male workers. The study population, inclusion criteria and procedures have been detailed previously [18]. Following the informed consent process, a face-to-face interview was conducted to elicit information on sociodemographic characteristics, sexual behaviour, contraceptive use, alcohol use and genital symptoms. Each participant was examined and samples for STIs and other reproductive tract infections (RTIs) were obtained, including a posterior fornix vaginal swab for T. vaginalis culture, a high lateral vaginal swab for assessing the vaginal microbiota (e.g. bacterial vaginosis), and a cervical swab for detection of C. trachomatis and N. gonorrhoeae. A blood sample was collected for testing for syphilis, HIV, and HSV-2, and a urine sample for pregnancy testing. Participants diagnosed with pelvic inflammatory disease (PID), vaginal discharge syndrome (VDS), or genital ulcer disease (GUD) were treated according to Tanzanian Ministry of Health syndromic STI management guidelines [14]. Participants were asked to return every three months for one year for a total of five visits. At follow-up visits, similar procedures were conducted with a face-to-face interview, gynaecological examination and blood draw for HIV and syphilis. However, testing for C. trachomatis, N. gonorrhoeae, T. vaginalis and HSV-2 was done only at enrolment and months six and 12.
If the participant had not previously been treated by syndromic management and had a positive laboratory test for C. trachomatis, N. gonorrhoeae, T. vaginalis or syphilis, they were traced and treated for the infection between study visits.
Laboratory methods
Serum samples were tested for syphilis, HIV and HSV-2. Syphilis was diagnosed using a semi-quantitative RPR test (Immutrep Carbon Antigen, Omega Diagnostics, Alva, Scotland) and the Treponema pallidum particle agglutination assay (TPPA) (SERODIA, Fujirebio Inc., Tokyo, Japan). At enrolment, participants who were TPPA-positive and RPR-positive were considered to be prevalent cases of active syphilis, and participants who were TPPA-positive and had an RPR titre of at least 1∶8 were considered to have high-titre active syphilis. An incident case of syphilis was defined as follows: participants who were previously TPPA-negative and were TPPA-positive at a follow-up visit; or participants who were previously TPPA-positive and had a two-fold increase in RPR titre (to a titre of at least 1∶8) at a follow-up visit. HIV testing was performed in parallel using third generation Murex HIV 1.2.O (Abbott UK, Dartford, Kent, England) and Vironostika HIV Uniform II plus O (bioMerieux Bv, The Netherlands) enzyme-linked immunosorbent assays (ELISAs). Samples discrepant or indeterminate on ELISA were tested for P24 Antigen (Genetics Systems HIV-1 Ag EIA, Bio-rad Laboratories, Marnes-la-Coquette, France) and if positive were classified as HIV-positive. Samples negative for P24 antigen were tested by Western Blot (INNO-LIA, HIV I/II score, Innogenetics NV, Gent, Belgium). HSV-2 was detected using type-specific IgG ELISA (Kalon Biologicals Ltd., Guildford, UK.
A cotton-tipped swab was collected from the posterior fornix of the vagina for culture of T. vaginalis (InPouch, BioMed Diagnostics, San Jose, CA, USA), incubated at 36–37°C and read every 24 hours for 72 hours. Dacron swabs were collected from the endocervix and tested for C. trachomatis and N. gonorrhoeae by PCR (AMPLICOR, Roche Diagnostics, Branchburg, NJ, USA). All positive tests for N. gonorrhoeae were confirmed using specific primers to the 16S rDNA coding region using PCR in-house assays [19]. Vaginal microbiota were evaluated by microscopy of a Gram-stained vaginal smear using Nugent criteria which defines normal microbiota (scores 0–3), intermediate microbiota (scores 4–6) and bacterial vaginosis (scores 7–10) [20]. Candidiasis was diagnosed by wet mount microscopy.
Statistical methods
Questionnaires were reviewed at site for completeness and consistency, and transported to a central data management centre. Double data entry was performed using DMSys software (SigmaSoft International, Chicago, IL, USA). Analysis was performed using Stata 11 (StataCorp, College Station, TX, USA).
Prevalence of infections and syndromes were calculated, and 95% confidence intervals were derived using Wilson's formula [21]. Odds ratio trends for C. trachomatis, N. gonorrhoeae, T. vaginalis and syndromes were estimated using logistic regression with random effects to account for repeated visits and within-women clustering. There were few incident syphilis cases (36 cases of incident syphilis; incidence rate was 4.8 (95% CI 3.5, 6.7) per 100 women-years), and we therefore restricted our analyses to prevalent high-titre active syphilis at enrolment only. Sensitivity, specificity and predictive values of PID and VDS (without curd-like discharge) for the detection of laboratory diagnosed STIs were calculated. We did not calculate the sensitivity, specificity and predictive values of GUD for the detection of syphilis as GUD can be caused by syphilis, but also by herpes, chancroid and lymphogranuloma venereum, and because serological syphilis may not always indicate a current active infection. Concurrent partnerships were defined as having more than one partner in the last three months.
We investigated associations with sociodemographic, behavioural and biological factors, over all visits using logistic regression with random effects for C. trachomatis, N. gonorrhoeae and T. vaginalis, and at enrolment using logistic regression for high-titre active syphilis. We adjusted a priori for visit month, town and age in all models. We built a multivariable model using a conceptual framework with three levels (sociodemographic, behavioural and biological). First, sociodemographic factors whose town- and age-adjusted associations were significant at p<0.10 were included in a multivariable model; stepwise backward selection (remove if p>0.05; re-enter if p<0.05), to remove those no longer independently associated, yielded our first core model. Second, behavioural factors were added to this core model one by one; those that were associated with the outcome at p<0.10, after adjusting for sociodemographic factors, were included in a multivariable model and stepwise backward selection (same criteria as above) was applied to the behavioural variables to yield our second core model. Third, biological factors were assessed in a similar way (third core model). We present results at each level of the framework, adjusted for more distal variables. Behavioural and biological factors which were measured at each visit were incorporated in a time-dependent manner, with the values at each visit included to assess the associations with the STIs at the same visit.
Results
We enrolled 966 women (375 Geita, 306 Kahama, 285 Shinyanga) of median age 26 years (interquartile range: 22, 32 years). Only 121 (13%) women had progressed to secondary education, 428 (44%) worked as waitresses, 433 (46%) had been at their current facility for one year or less, 432 (45%) reported that they had ever engaged in transactional sex, 216 (24%) had concurrent partners, 84 (9%) were using oral contraceptives, and 136 (14%) were using the injectable contraceptive depot medroxyprogesterone acetate (DMPA). The proportions of women who attended visits at months 3, 6, 9 and 12 were 79%, 75%, 76% and 84%, respectively.
Prevalence of laboratory diagnosed curable STIs
At enrolment, the prevalences of C. trachomatis, N. gonorrhoeae, and T. vaginalis were 111/956 (12%), 42/955 (4%), and 184/945 (19%), respectively. The prevalence of active syphilis was 87/965 (9%) and the prevalence of high-titre active syphilis was 46/965 (5%). Overall, 313/939 (33%) women had at least one of these four STIs. The majority of these infections were not diagnosed with the corresponding syndrome and therefore most participants were not treated at enrolment. Figure 1 shows the curable STI prevalences by visit, illustrating the study design in which syphilis was tested for at every visit and C. trachomatis, N. gonorrhoeae, and T. vaginalis were tested for at enrolment, six and 12 months only. There were significant decreases over the follow-up period in the prevalence of C. trachomatis and T. vaginalis (odds ratio [OR] test for linear trend per month 0.94 [95% confidence interval [CI] 0.91, 0.97] and 0.95 [0.93, 0.98], respectively; both p<0.001) (Table 1).
Figure 1. Prevalence of (a) curable sexually transmitted infections, and (b) syndromes diagnosed, by visit month, in a cohort of women at increased risk for HIV acquisition in northwestern Tanzania.

Lighter shaded section of each bar represents those who were diagnosed by syndromic management. Values shown at the top of the bars are the overall prevalence (%). CT = Chlamydia trachomatis, NG = Neisseria gonorrhoeae, TV = Trichomonas vaginalis, syph = high-titre active syphilis.
Table 1. Trend in prevalence of laboratory-diagnosed curable sexually transmitted infections and syndromes diagnosed over the 12 month follow-up period in a cohort of women at increased risk for HIV acquisition in northwestern Tanzania.
| Prevalence at enrolment (%; 95% CI) | OR (95% CI) for linear trend (per month) | P-value | |
| Infections | |||
| C. trachomatis | 111/956 (12%; 10, 14) | 0.94 (0.91,0.97) | <0.001 |
| N. gonorrhoeae | 42/955 (4%; 3, 6) | 0.98 (0.94,1.02) | 0.34 |
| T. vaginalis | 184/945 (19%; 17, 22) | 0.95 (0.93,0.98) | <0.001 |
| Syndromes | |||
| Pelvic inflammatory disease | 249/966 (26%; 23, 29) | 0.85 (0.83,0.88) | <0.001 |
| Vaginal discharge syndrome (without curd-like discharge) | 108/966 (11%; 9, 13) | 0.91 (0.88,0.94) | <0.001 |
| Vaginal discharge syndrome (with curd-like discharge) | 92/966 (10%; 9,12) | 0.95 (0.92,0.98) | <0.001 |
CI = confidence interval; OR = odds ratio.
Prevalence and performance of STI Syndromes
During the enrolment clinical interview, 539/962 (56%) participants reported genitourinary complaints, among whom itching was the most common complaint (64%), followed by abdominal pain during sexual intercourse (46%), vulvar burning (36%), dysuria (27%), abnormal vaginal discharge (25%) and genital ulcers or blisters (12%). On the enrolment genital examination, 500/956 (52%) participants had one or more clinical signs suggestive of an STI. The most common syndromic diagnosis was PID (26%), followed by VDS without curd-like discharge (11%), VDS with curd-like discharge (10%), and GUD (6%). At enrolment, 634 (66%) were negative for both PID and VDS (without curd-like discharge). Figure 2 shows the prevalence of syndromes by visit. There were significant decreases over the follow-up period for all syndromes (OR test for linear trend per month for PID = 0.85 [95% CI 0.83, 0.88], VDS without curd-like discharge 0.91 [0.88, 0.94], VDS with curd-like discharge 0.95 [0.92, 0.98] and GUD 0.87 [0.83, 0.91]; all p<0.001; Table 1).
Figure 2. Prevalence of syndromes diagnosed, by visit month, in a cohort of women at increased risk for HIV acquisition in northwestern Tanzania.
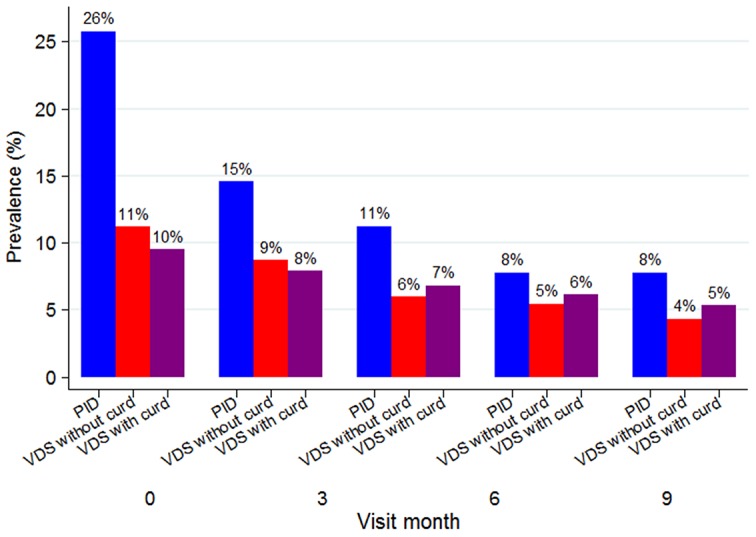
Values shown at the top of the bars are the prevalence (%). PID = pelvic inflammatory disease, VDS = vaginal discharge syndrome.
Table 2 shows the sensitivity, specificity, and predictive values of syndromic management guidelines for PID and VDS (without curd-like discharge). The sensitivity and specificity of a PID diagnosis to detect C. trachomatis, N. gonorrhoeae, or bacterial vaginosis were 17% and 85%, respectively (similar results for each infection alone). The positive predictive value (PPV) of PID was low for C. trachomatis and N. gonorrhoeae, 12%, and 6% respectively, and higher for bacterial vaginosis, 49%. The negative predictive value (NPV) was high for C. trachomatis and N. gonorrhoeae, 93% and 96% respectively, and relatively lower for bacterial vaginosis, 55%. The sensitivity and specificity of VDS to detect C. trachomatis, N. gonorrhoeae, T. vaginalis or bacterial vaginosis were 9% and 94%, respectively (similar results for each infection alone). The PPV and NPV of VDS ranged from 7% and 96%, respectively, to 66% and 41%, respectively, for all four infections combined. The sensitivity, specificity, PPV and NPV of PID or VDS to detect either C. trachomatis or N. gonorrhoeae were 32%, 77%, 15%, and 90% respectively.
Table 2. Performance of syndromes for detection of laboratory-diagnosed sexually transmitted infections (STI) and bacterial vaginosis over the 12 month follow-up period in a cohort of women at increased risk for HIV acquisition in northwestern Tanzania.
| No. visits[1] | No. infected | No. with syndrome | No. cases detected by syndrome | Sensitivity | Specificity | Positive predictive value | Negative predictive value | |
| Pelvic inflammatory disease (PID) for | ||||||||
| C. trachomatis | 2279 | 183 | 389 | 45 | 25% | 84% | 12% | 93% |
| N. gonorrhoeae | 2277 | 92 | 388 | 25 | 27% | 83% | 6% | 96% |
| Bacterial vaginosis (BV) | 3968 | 1819 | 558 | 272 | 15% | 87% | 49% | 55% |
| C. trachomatis, N. gonorrhoeae or BV | 2373 | 1269 | 388 | 220 | 17% | 85% | 57% | 47% |
| Vaginal discharge syndrome without curd-like discharge (VDS) for | ||||||||
| C. trachomatis | 2279 | 183 | 182 | 20 | 11% | 92% | 11% | 92% |
| N. gonorrhoeae | 2277 | 92 | 182 | 12 | 13% | 92% | 7% | 96% |
| T. vaginalis | 2279 | 365 | 117 | 43 | 12% | 93% | 24% | 85% |
| BV | 3968 | 1819 | 289 | 150 | 8% | 94% | 52% | 55% |
| C. trachomatis, N. gonorrhoeae T. vaginalis or BV[2] | 2361 | 1417 | 182 | 121 | 9% | 94% | 66% | 41% |
| PID or VDS for | ||||||||
| C. trachomatis or N. gonorrhoeae | 2277 | 258 | 539 | 83 | 32% | 77% | 15% | 90% |
The number of visits represent the number of visits with available test results and where clinical examination was performed. C. trachomatis, N. gonorrhoeae, and T. vaginalis were tested at baseline and 6 and 12 months, bacterial vaginosis was tested at every visit.
Calculations were for visits when all infections were obtained by design (i.e. Enrolment, 6 and 12 months).
Low PPV meant that many participants were treated with antibiotics without an infection subsequently confirmed by laboratory diagnosis. Of the visits at which doxycycline (treatment for VDS and PID) or erythromycin (treatment for VDS and PID if pregnant) were prescribed, 809/904 (89%) did not have a laboratory diagnosis for C. trachomatis. Of the visits at which ciprofloxacin (treatment for VDS and PID) or ceftriaxone (treatment for VDS and PID if pregnant) were prescribed, 773/830 (93%) did not have a laboratory diagnosis for N. gonorrhoeae. Of the visits where metronidazole (treatment for VDS and PID) was prescribed, 632/782 (81%) did not have a laboratory diagnosis of T. vaginalis or bacterial vaginosis.
Risk factors for laboratory-diagnosed STIs
Results from multivariate models for each level of the conceptual framework are shown in Tables S1–S4 in File S1, with results from the final model at each level reported in Table 3. Participants who had been working in their facility for a longer time were less likely to be infected with C. trachomatis (p-trend = 0.01; Table 3). Age was strongly associated with C. trachomatis infection, with younger participants being at higher risk (p-trend = 0.003). Participants who had more reported lifetime sex partners were more likely to be infected with C. trachomatis infection (p-trend = 0.005). There was evidence of an association between C. trachomatis infection and contraception use (p = 0.02); those using DMPA (adjusted[a]OR 2.21; CI 1.39–3.52) and condoms only (aOR 1.50; CI 1.01–2.24) were at higher risk compared to those who reported no contraception use. Participants who had at least one pregnancy in their lifetime had twice the odds of C. trachomatis infection (aOR 1.96; 95% CI 1.10, 3.50) compared with those who had never been pregnant. C. trachomatis infection was also associated with N. gonorrhoeae infection (aOR 2.21; CI 1.23–3.97).
Table 3. Associations of C. trachomatis, N. gonorrhoeae, T. vaginalis and active syphilis (high-titre) with sociodemographic, behavioural and biological factors in a cohort of women at increased risk for HIV acquisition in northwestern Tanzania.
| C. trachomatis | N. gonorrhoeae | T. vaginalis | Active syphilis (high-titre) | |||||||||
| No. positive/No. obs (%) | Visit month-, town- and age-adjusted OR | Adjusted OR (95% CI) [1] | No. positive/No. observations (%) | Visit month-, town- and age-adjusted OR | Adjusted OR (95% CI) [2] | No. positive/No. observations (%) | Visit month-, town- and age-adjusted OR | Adjusted OR (95% CI) [3] | No. positive/No. observations (%) | Town- and age-adjusted OR | Adjusted OR (95% CI) [4] | |
| SOCIODEMOGRAPHIC FACTORS | ||||||||||||
| Town | P = 0.37 | P = 0.55 | P = 0.75 | P = 0.19 | ||||||||
| Geita | 62/863 (7%) | 1 | 1 | 32/862 (4%) | 1 | 1 | 137/862 (16%) | 1 | 1 | 25/375 (7%) | 1 | 1 |
| Kahama | 69/723 (10%) | 1.33 | 1.30 (0.89, 1.90) | 36/722 (5%) | 1.34 | 1.34 (0.78, 2.29) | 123/707 (17%) | 1.06 | 1.15 (0.76, 1.75) | 13/306 (4%) | 0.63 | 0.76 (0.38,1.54) |
| Shinyanga | 52/693 (8%) | 1.23 | 1.21 (0.81, 1.82) | 24/693 (3%) | 1.07 | 1.07 (0.59, 1.94) | 105/710 (15%) | 0.88 | 1.00 (0.65, 1.54) | 8/284 (3%) | 0.40 | 0.48 (0.21,1.10) |
| Job | P = 0.15 | P = 0.42 | P = 0.38 | P = 0.38 | ||||||||
| Waitress | 100/940 (11%) | 1 | 1 | 49/939 (5%) | 1 | 1 | 176/943 (19%) | 1 | 1 | 25/428 (6%) | 1 | 1 |
| Independent food vendor | 30/519 (6%) | 0.63 | 0.69 (0.44, 1.07) | 17/519 (3%) | 0.72 | 0.72 (0.39, 1.34) | 69/513 (13%) | 0.62 | 0.73 (0.45, 1.18) | 8/200 (4%) | 0.63 | 0.65 (0.28,1.50) |
| Other | 53/820 (6%) | 0.72 | 0.76 (0.52, 1.10) | 26/819 (3%) | 0.74 | 0.74 (0.43, 1.26) | 120/823 (15%) | 0.72 | 0.82 (0.54, 1.23) | 13/337 (4%) | 0.60 | 0.64 (0.31,1.31) |
| Duration working in facility type, years | P = 0.04 | P = 0.90 | P = 0.24 | P = 0.18 | ||||||||
| p-trend = 0.01 | p-trend = 0.67 | p-trend = 0.11 | p-trend = 0.44 | |||||||||
| (0,1] | 101/987 (10%) | 1 | 1 | 47/985 (5%) | 1 | 1 | 173/979 (18%) | 1 | 1 | 21/433 (5%) | 1 | 1 |
| (1,5] | 52/750 (7%) | 0.71 | 0.71 (0.49, 1.02) | 29/750 (4%) | 0.90 | 0.90 (0.53, 1.50) | 119/745 (16%) | 0.85 | 0.89 (0.59, 1.33) | 19/317 (6%) | 1.25 | 1.29 (0.66,2.50) |
| >5 | 21/479 (4%) | 0.57 | 0.57 (0.34, 0.97) | 13/479 (3%) | 0.89 | 0.89 (0.43, 1.82) | 60/489 (12%) | 0.58 | 0.64 (0.38, 1.08) | 5/187 (3%) | 0.48 | 0.50 (0.17,1.48) |
| Age, years | P = 0.001 | P<0.001 | P = 0.82 | P = 0.16 | ||||||||
| p-trend = 0.003 | p-trend<0.001 | p-trend = 0.66 | p-trend = 0.91 | |||||||||
| <20 | 20/176 (11%) | 1 | 1 | 13/176 (7%) | 1 | 1 | 27/175 (15%) | 1 | 1 | 5/88 (6%) | 1 | 1 |
| 20–24 | 70/666 (11%) | 0.92 | 0.97 (0.56, 1.71) | 33/665 (5%) | 0.62 | 0.62 (0.29, 1.31) | 118/656 (18%) | 1.20 | 1.27 (0.63, 2.55) | 18/304 (6%) | 1.12 | 1.18 (0.42,3.32) |
| 25–29 | 58/579 (10%) | 0.89 | 1.05 (0.59, 1.87) | 31/578 (5%) | 0.68 | 0.68 (0.32, 1.45) | 96/579 (17%) | 1.09 | 1.15 (0.55, 2.43) | 6/246 (2%) | 0.45 | 0.46 (0.13,1.57) |
| ≥30 | 35/858 (4%) | 0.35 | 0.45 (0.24, 0.84) | 15/858 (2%) | 0.21 | 0.21 (0.09, 0.49) | 124/869 (14%) | 0.90 | 1.04 (0.49, 2.22) | 17/327 (5%) | 1.06 | 1.16 (0.41,3.32) |
| Education level achieved | P = 0.08 | P = 0.26 | P = 0.001 | P<0.001 | ||||||||
| p-trend = 0.75 | p-trend = 0.85 | p-trend<0.001 | ||||||||||
| No education or incomplete primary | 66/678 (10%) | 1 | 1 | 23/677 (3%) | 1 | 1 | 146/675 (22%) | 1 | 1 | 27/298 (9%) | 1 | 1 |
| Complete primary | 86/1312 (7%) | 0.67 | 0.71 (0.50, 1.02) | 59/1311 (5%) | 1.43 | 1.43 (0.83, 2.45) | 182/1312 (14%) | 0.51 | 0.52 (0.36, 0.77) | 19/666 (3%) | 0.31 | 0.31 (0.17,0.57) |
| ≥Secondary | 31/287 (11%) | 1.01 | 1.09 (0.67, 1.76) | 10/287 (3%) | 0.89 | 0.89 (0.39, 2.02) | 36/290 (12%) | 0.40 | 0.40 (0.22, 0.74) | [5] | ||
| Marital status | P = 0.42 | P = 0.06 | P = 0.001 | P = 0.98 | ||||||||
| Married | 27/511 (5%) | 1 | 1 | 12/510 (2%) | 1 | 1 | 51/515 (10%) | 1 | 1 | 9/203 (4%) | 1 | 1 |
| Separated/divorced/widowed | 88/1156 (8%) | 1.30 | 1.24 (0.78, 1.96) | 54/1155 (5%) | 1.76 | 1.76 (0.88, 3.53) | 216/1156 (19%) | 2.47 | 2.42 (1.49, 3.93) | 24/482 (5%) | 1.12 | 1.09 (0.49,2.44) |
| Single | 68/612 (11%) | 1.51 | 1.41 (0.84, 2.39) | 26/612 (4%) | 0.96 | 0.96 (0.43, 2.15) | 98/608 (16%) | 1.71 | 1.96 (1.08, 3.57) | 13/280 (5%) | 0.87 | 1.10 (0.40,2.98) |
| BEHAVIOURAL FACTORS AT ENROLMENT | ||||||||||||
| AUDIT score [6] | P = 0.38 | P = 0.04 | P = 0.79 | P = 0.59 | ||||||||
| Non-drinker or low risk drinking | 149/1945 (8%) | 1 | 1 | 71/1944 (4%) | 1 | 1 | 307/1946 (16%) | 1 | 1 | 37/816 (5%) | 1 | 1 |
| Harmful or hazardous drinking | 33/323 (10%) | 1.26 | 1.22 (0.79, 1.86) | 21/322 (7%) | 1.83 | 1.83 (1.03, 3.25) | 54/323 (17%) | 1.03 | 0.94 (0.57, 1.53) | 8/144 (6%) | 1.27 | 0.76 (0.28,2.11) |
| Age at first sex, years | P = 0.17 | P = 0.61 | P = 0.06 | P = 0.36 | ||||||||
| <16 | 61/663 (9%) | 1 | 1 | 31/663 (5%) | 1 | 1 | 129/664 (19%) | 1 | 1 | 21/286 (7%) | 1 | 1 |
| ≥16 | 96/1432 (7%) | 0.74 | 0.77 (0.54, 1.11) | 53/1430 (4%) | 0.85 | 0.87 (0.52, 1.46) | 205/1436 (14%) | 0.61 | 0.69 (0.47, 1.02) | 21/600 (4%) | 0.47 | 0.71 (0.34,1.48) |
| N lifetime sex partners | P = 0.03 | P = 0.89 | P = 0.95 | P = 0.59 | ||||||||
| p-trend = 0.005 | p-trend = 0.61 | p-trend = 0.60 | p-trend = 0.89 | |||||||||
| 0–4 | 59/930 (6%) | 1 | 1 | 36/930 (4%) | 1 | 1 | 138/933 (15%) | 1 | 1 | 14/390 (4%) | 1 | 1 |
| 5–9 | 41/483 (8%) | 1.41 | 1.52 (0.99, 2.36) | 22/483 (5%) | 1.21 | 1.13 (0.61, 2.08) | 81/486 (17%) | 1.19 | 1.01 (0.63, 1.62) | 9/210 (4%) | 1.10 | 0.72 (0.28,1.87) |
| ≥10 | 36/405 (9%) | 1.49 | 1.48 (0.93, 2.36) | 18/404 (4%) | 1.13 | 0.93 (0.47, 1.85) | 65/404 (16%) | 1.17 | 0.92 (0.55, 1.53) | 10/168 (6%) | 1.59 | 0.47 (0.15,1.50) |
| Do not remember | 46/451 (10%) | 1.76 | 1.91 (1.23, 2.96) | 16/450 (4%) | 0.94 | 0.84 (0.43, 1.67) | 80/446 (18%) | 1.33 | 1.09 (0.67, 1.78) | 13/193 (7%) | 2.01 | 0.99 (0.39,2.49) |
| TIME-VARYING BEHAVIOURAL FACTORS | ||||||||||||
| N sex partners in last 3 mths | P = 0.59 | P = 0.41 | P = 0.78 | P = 0.28 | ||||||||
| p-trend = 0.30 | p-trend = 0.29 | p-trend = 0.59 | p-trend = 0.13 | |||||||||
| 0 | 126/1803 (7%) | 1 | 1 | 64/1802 (4%) | 1 | 1 | 274/1804 (15%) | 1 | 1 | 22/693 (3%) | 1 | 1 |
| 2 | 34/316 (11%) | 1.41 | 1.21 (0.77, 1.89) | 20/315 (6%) | 1.66 | 1.50 (0.84, 2.69) | 56/315 (18%) | 1.04 | 0.99 (0.65, 1.52) | 16/164 (10%) | 3.34 | 0.14 (0.01,1.97) |
| ≥3 | 21/145 (14%) | 1.81 | 1.27 (0.71, 2.27) | 8/145 (6%) | 1.41 | 1.18 (0.50, 2.78) | 33/146 (23%) | 1.41 | 1.22 (0.69, 2.15) | 7/93 (8%) | 2.15 | 0.08 (0.00,1.41) |
| Concurrent sex partners in last 3 mths | P = 0.30 | P = 0.33 | P = 0.98 | P = 0.004 | ||||||||
| No | 126/1810 (7%) | 1 | 1 | 65/1809 (4%) | 1 | 1 | 276/1811 (15%) | 1 | 1 | 21/687 (3%) | 1 | 1 |
| Yes | 49/402 (12%) | 1.58 | 1.24 (0.83, 1.87) | 23/401 (6%) | 1.44 | 1.33 (0.76, 2.35) | 75/401 (19%) | 1.07 | 0.99 (0.67, 1.48) | 18/216 (8%) | 2.90 | 2.71 (1.39,5.28) |
| Transactional sex in last 3 months | P = 0.90 | P = 0.11 | P = 0.20 | P = 0.97 | ||||||||
| No | 122/1753 (7%) | 1 | 1 | 60/1753 (3%) | 1 | 1 | 257/1760 (15%) | 1 | 1 | 24/599 (4%) | 1 | 1 |
| Yes | 61/522 (12%) | 1.29 | 1.03 (0.69, 1.52) | 32/520 (6%) | 1.69 | 1.55 (0.91, 2.63) | 108/515 (21%) | 1.38 | 1.26 (0.88, 1.81) | 22/362 (6%) | 1.45 | 1.01 (0.48,2.12) |
| Contraception | P = 0.02 | P = 0.37 | P = 0.53 | P = 0.89 | ||||||||
| None of these | 54/964 (6%) | 1 | 1 | 31/964 (3%) | 1 | 1 | 155/974 (16%) | 1 | 1 | 19/376 (5%) | 1 | 1 |
| Condom only | 68/725 (9%) | 1.41 | 1.50 (1.01, 2.24) | 34/725 (5%) | 1.17 | 1.18 (0.69, 2.02) | 127/719 (18%) | 1.14 | 1.02 (0.72, 1.46) | 17/338 (5%) | 0.89 | 0.76 (0.35,1.65) |
| Pill (+/−condoms) | 16/196 (8%) | 1.42 | 1.51 (0.82, 2.79) | 8/196 (4%) | 1.24 | 1.27 (0.54, 3.01) | 31/193 (16%) | 1.00 | 0.99 (0.54, 1.80) | 4/84 (5%) | 0.94 | 0.90 (0.25,3.23) |
| Injectable (DMPA; +/−condoms) | 38/320 (12%) | 2.04 | 2.21 (1.39, 3.52) | 18/318 (6%) | 1.69 | 1.66 (0.86, 3.21) | 39/320 (12%) | 0.75 | 0.69 (0.41, 1.14) | 4/135 (3%) | 0.62 | 0.57 (0.18,1.79) |
| Other hormonal contraceptives | 7/73 (10%) | 1.67 | 1.76 (0.75, 4.13) | 1/73 (1%) | 0.35 | 0.34 (0.04, 2.75) | 13/72 (18%) | 1.35 | 1.37 (0.55, 3.42) | 2/31 (6%) | 1.29 | 0.90 (0.11,7.36) |
| BIOLOGICAL FACTORS AT ENROLMENT | ||||||||||||
| Ever pregnant | P = 0.02 | P = 0.003 | P = 0.69 | P = 0.59 | ||||||||
| No | 22/318 (7%) | 1 | 1 | 8/318 (3%) | 1 | 1 | 55/314 (18%) | 1 | 1 | 8/151 (5%) | 1 | 1 |
| Yes | 161/1959 (8%) | 1.96 | 1.96 (1.10, 3.50) | 84/1957 (4%) | 3.73 | 3.39 (1.41, 8.16) | 310/1963 (16%) | 0.93 | 0.89 (0.51, 1.57) | 38/813 (5%) | 1.03 | 0.76 (0.28,2.03) |
| TIME-VARYING BIOLOGICAL FACTORS | ||||||||||||
| Current HSV-2 infection | P = 0.42 | P = 0.27 | P = 0.46 | P = 0.69 | ||||||||
| Negative | 50/503 (10%) | 1 | 1 | 17/502 (3%) | 1 | 1 | 66/497 (13%) | 1 | 1 | 11/249 (4%) | 1 | 1 |
| Positive (from baseline) | 128/1720 (7%) | 0.95 | 0.80 (0.54, 1.18) | 71/1719 (4%) | 1.72 | 1.43 (0.78, 2.63) | 292/1726 (17%) | 1.64 | 1.29 (0.82, 2.03) | 35/715 (5%) | 1.19 | 0.84 (0.37,1.95) |
| Positive (seroconverted during follow-up) | 5/53 (9%) | 1.41 | 1.26 (0.45, 3.53) | 4/53 (8%) | 2.65 | 2.59 (0.73, 9.19) | 7/53 (13%) | 1.00 | 0.84 (0.28, 2.53) | [7] | ||
| Current syphilis status [8] | P = 0.61 | P = 0.47 | P = 0.08 | - | - | - | ||||||
| Never infected | 153/1861 (8%) | 1 | 1 | 81/1859 (4%) | 1 | 1 | 278/1857 (15%) | 1 | 1 | |||
| Previous infection | 10/227 (4%) | 0.70 | 0.73 (0.37, 1.45) | 4/227 (2%) | 0.53 | 0.54 (0.18, 1.59) | 35/230 (15%) | 1.20 | 1.01 (0.58, 1.77) | |||
| Active infection | 20/190 (11%) | 1.35 | 1.09 (0.62, 1.91) | 7/190 (4%) | 0.88 | 0.85 (0.36, 2.01) | 52/191 (27%) | 2.54 | 1.85 (1.08, 3.17) | |||
| Current candida status | P = 0.20 | P = 0.70 | P = 0.73 | P = 0.29 | ||||||||
| Negative | 178/2152 (8%) | 1 | 1 | 85/2150 (4%) | 1 | 1 | 346/2153 (16%) | 1 | 1 | 43/921 (5%) | 1 | 1 |
| Positive | 5/118 (4%) | 0.56 | 0.57 (0.22, 1.45) | 5/118 (4%) | 1.05 | 1.22 (0.45, 3.30) | 17/118 (14%) | 0.99 | 1.13 (0.57, 2.22) | 3/35 (9%) | 1.40 | 2.13 (0.58,7.83) |
| Current T. vaginalis infection | P = 0.87 | P = 0.34 | - | - | - | P = 0.001 | ||||||
| Negative | 145/1896 (8%) | 1 | 1 | 72/1894 (4%) | 1 | 1 | 26/760 (3%) | 1 | 1 | |||
| Positive | 34/362 (9%) | 1.12 | 0.97 (0.63, 1.48) | 18/362 (5%) | 1.30 | 1.33 (0.75, 2.36) | 20/184 (11%) | 3.43 | 3.27 (1.66,6.43) | |||
| Current C. trachomatis infection | - | - | P = 0.02 | P = 0.86 | P = 0.73 | |||||||
| Negative | 75/2094 (4%) | 1 | 1 | 329/2080 (16%) | 1 | 1 | 41/844 (5%) | 1 | 1 | |||
| Positive | 17/183 (9%) | 2.38 | 2.19 (1.19, 4.05) | 34/180 (19%) | 1.21 | 1.05 (0.63, 1.75) | 5/111 (5%) | 1.08 | 0.83 (0.27,2.50) | |||
| Current N. gonorrhoeae infection | P = 0.01 | - | - | - | P = 0.62 | P = 0.21 | ||||||
| Negative | 166/2186 (8%) | 1 | 1 | 345/2169 (16%) | 1 | 1 | 43/912 (5%) | 1 | 1 | |||
| Positive | 17/92 (18%) | 2.29 | 2.21 (1.23, 3.97) | 18/90 (20%) | 1.37 | 1.20 (0.59, 2.44) | 3/42 (7%) | 1.83 | 2.51 (0.68,9.28) | |||
| Current vaginal microbiota | P = 0.07 | P = 0.38 | P<0.001 | P = 0.08 | ||||||||
| Negative | 50/830 (6%) | 1 | 1 | 24/828 (3%) | 1 | 1 | 72/829 (9%) | 1 | 1 | 10/357 (3%) | 1 | 1 |
| Indeterminate | 42/397 (11%) | 1.79 | 1.70 (1.07, 2.69) | 18/397 (5%) | 1.49 | 1.38 (0.71, 2.68) | 103/396 (26%) | 4.70 | 4.37 (2.84, 6.72) | 7/161 (4%) | 1.58 | 0.62 (0.19,1.97) |
| Bacterial vaginosis | 91/1051 (9%) | 1.36 | 1.34 (0.92, 1.97) | 50/1051 (5%) | 1.53 | 1.44 (0.84, 2.45) | 190/1053 (18%) | 2.37 | 2.28 (1.58, 3.30) | 29/446 (7%) | 2.47 | 1.72 (0.78,3.80) |
| Currently HIV-positive | P = 0.51 | (not estimable) | - | P = 0.82 | [9] | |||||||
| Negative | 180/2241 (8%) | 1 | 1 | 92/2239 (4%) | 360/2242 (16%) | 1 | 1 | |||||
| Positive | 3/38 (8%) | 1.39 | 1.55 (0.45, 5.34) | 0/38 (0%) | 5/37 (14%) | 0.99 | 0.86 (0.25, 3.00) | |||||
| Currently have diagnosis of GUD | P = 0.15 | P = 0.22 | P = 0.73 | P = 0.92 | ||||||||
| Negative | 168/2200 (8%) | 1 | 1 | 85/2198 (4%) | 1 | 1 | 352/2193 (16%) | 1 | 1 | 44/900 (5%) | 1 | 1 |
| Positive | 15/78 (19%) | 1.99 | 1.71 (0.86, 3.41) | 7/78 (9%) | 1.77 | 1.83 (0.73, 4.62) | 12/71 (17%) | 0.89 | 0.86 (0.37, 1.99) | 2/55 (4%) | 0.80 | 1.08 (0.22,5.20) |
| Currently have a diagnosis of VDS | P = 0.59 | P = 0.31 | P = 0.13 | P = 0.76 | ||||||||
| No | 163/2097 (8%) | 1 | 1 | 80/2095 (4%) | 1 | 1 | 322/2102 (15%) | 1 | 1 | 42/857 (5%) | 1 | 1 |
| Yes | 20/182 (11%) | 1.06 | 0.85 (0.48, 1.52) | 12/182 (7%) | 1.50 | 1.47 (0.71, 3.03) | 43/177 (24%) | 1.68 | 1.49 (0.90, 2.47) | 4/108 (4%) | 0.78 | 0.83 (0.26,2.70) |
Note: C. trachomatis, N. gonorrhoeae and T. vaginalis data from all visits were used in the analysis. For active syphilis (high-titre), data only from the enrolment visit were used since there were very few incident infections. “1” denotes the reference category throughout.
[1] ORs for sociodemographic variables adjusted for visit month, town, age and duration working in facility type; ORs for behavioural variables adjusted for these sociodemographic variables, number of lifetime partners and contraception; ORs for biological variables adjusted for these sociodemographic and behavioural variables, ever pregnant and gonorrhoea status (the results for these variables are shown in bold). Full results from each level shown in Table S1 in File S1.
[2] ORs for sociodemographic variables adjusted for visit month, town and age; ORs for behavioural variables adjusted for these sociodemographic variables and AUDIT; ORs for biological variables adjusted for these sociodemographic and behavioural variables, ever pregnant and chlamydia status (the results for these variables are shown in bold). Full results from each level shown in Table S2 in File S1.
[3] ORs for sociodemographic variables adjusted for visit month, town, age, education and marital status; ORs for behavioural variables adjusted for these sociodemographic variables (no behavioural variables included); ORs for biological variables adjusted for these sociodemographic and behavioural variables and current vaginal microbiota assessed by Nugent score (the results for these variables are shown in bold). Full results from each level shown in Table S3 in File S1.
[4] ORs for sociodemographic variables adjusted for visit month, town, age and education; ORs for behavioural variables adjusted for these sociodemographic variables and whether had concurrent partners in the last 3 months; ORs for biological variables adjusted for these sociodemographic and behavioural variables and T. vaginalis status (the results for these variables are shown in bold). Full results from each level shown in Table S4 in File S1.
[5] Combined complete primary and secondary since only two women who attended secondary school had active syphilis (high-titre) at enrolment.
[6] Based on responses to ten AUDIT questions. Scores based on responses to each question: 0–7 = non-drinker or low-risk; ≥8 harmful or hazardous drinking.
[7] Combined positive (from baseline) and positive (seroconverted during follow-up).
[8] Current syphilis status is defined as follows: RPR negative/RPR positive and TPPA negative = never infected (includes biological false positives); RPR negative and TPPA positive = previous infection; RPR positive and TPPA positive = active infection.
[9] All women HIV-negative at enrolment as per eligibility criteria.
Younger women were also at higher risk of N. gonorrhoeae infection (p-trend<0.001; Table 3). There was some evidence that harmful or hazardous drinking, compared to no or low-risk drinking, was associated with N. gonorrhoeae infection (aOR 1.83; CI 1.03, 3.25). Participants who had at least one pregnancy in their lifetime had more than three times the odds of N. gonorrhoeae infection (aOR 3.39; CI 1.41, 8.16). N. gonorrhoeae was strongly associated with C. trachomatis infection (aOR 2.19; CI 1.19, 4.05).
Higher education level was associated with lower odds of T. vaginalis infection (p-trend<0.001; Table 3). Higher T. vaginalis prevalence was found in divorced, separated or widowed (aOR 2.42; 1.49, 3.93) and single (aOR1.96; 1.08, 3.57) women compared to married women. Current intermediate vaginal microbiota (aOR 4.37; 2.84, 6.72) and bacterial vaginosis (aOR 2.28; 1.58, 3.30) were strongly associated with T. vaginalis infection. There was weak evidence of an association between T. vaginalis and syphilis (p = 0.08), in particular for active syphilis (aOR 1.85; 1.08, 3.17).
Higher education levels were also associated with lower prevalence of high-titre active syphilis infection at enrolment (aOR 0.31; 0.17, 0.57 for those who completed primary school compared with those who did not; Table 3). Participants who reported concurrent sex partners in the past three months had higher odds of high-titre active syphilis (aOR 2.71; 1.39, 5.28). T. vaginalis infection (aOR 3.27; 1.66, 6.43) was strongly associated with high-titre active syphilis infection.
Discussion
The prevalences of curable STIs were high indicating that these infections are a major public health problem among women working in bars, hotels, and other food and recreational facilities near large-scale gold and diamond mines in northwestern Tanzania. Our findings were consistent with previous studies from similar populations in Tanzania, and indicate continued high burden of these infections [9], [10], [12]. T. vaginalis was the most prevalent infection at enrolment and throughout the study period. Further, while culture is considered the gold standard for detection of T. vaginalis, the sensitivity of culture has been reported to be 75% to 89% compared to nucleic acid amplification tests [45], [46], and therefore the prevalence of T. vaginalis in this study population may be underestimated. T. vaginalis infection has been associated with pelvic inflammatory disease, endometritis, adverse pregnancy outcomes, and HIV acquisition [22]–[25]. There is also evidence that HIV infection is associated with T. vaginalis acquisition [26] Therefore, T. vaginalis is an important infection to target in prevention efforts as this synergy may contribute in continued expansion of the HIV epidemic in this population [26].
We observed a significant decrease in the prevalence of C. trachomatis and T. vaginalis over the one-year follow-up period, consistent with the provision of behavioural counselling, condom provision and free STI treatment as seen in other studies [12]. However, we did not observe a significant decrease in syphilis which may reflect a slow decline in RPR titre after treatment, or serofast reactions in which nontreponemal antibodies persist for a long period of time [27].
Due to a low sensitivity of syndromic management to detect laboratory-diagnosed infections in this population at increased risk for HIV infection, most infections were missed by this approach. Thus, the majority of these infections would have gone untreated in a syndromic management setting where laboratory testing was not routinely done. Poor sensitivity of syndromic management has been documented in other settings, for example among female sex workers in India [28]. It is important to note that syndromic STI management guidelines were not developed as a screening tool for asymptomatic patients. Nevertheless, in many resource-limited settings, this is the only STI management tool available – even to populations at increased risk for STIs and HIV. Furthermore, many research cohorts rely on syndromic management to treat STIs in their study populations until laboratory results are available. The results of this study are a reminder that this approach will miss a high proportion of cases, and in the interim period between study visit and laboratory diagnosis, transmission and sequelae of STIs may occur. Interestingly, a recent study among sex workers in South Africa has shown that cervicovaginal inflammatory cytokines did not differ between women with and without symptoms; and in both groups inflammatory cytokines were elevated [17]. Previous studies have suggested that elevated inflammatory cytokines may facilitate HIV transmission [29], and, thus, women with asymptomatic STIs may be as susceptible to HIV infection as those with symptoms.
This study also revealed the poor PPV of syndromic management, and as a consequence, a high proportion of participants in our study were given antibiotics that they did not need. In addition to the costs associated with over-treatment of STIs in a resource-limited setting, over-use of antibiotics is a major concern as resistance to N. gonorrhoeae has become widespread [30], [31] and there is evidence of fluoroquinolone resistance in East Africa [32], [33]. Furthermore, the first line treatment for N. gonorrhoeae in the Tanzanian Ministry of Health guidelines is ciprofloxacin. Research is urgently needed to evaluate fluoroquinolone resistance to N. gonorrhoeae in northwestern Tanzania. Although we found a relatively low prevalence of N. gonorrhoeae in our study, we found no evidence of a decrease in N. gonorrhoeae over the follow-up period, and this may have been due to treatment resistance. An important caveat is that while C. trachomatis, N. gonorrhoeae and bacterial vaginosis are found in some cases of PID, the infectious cause of PID is often unknown[34]; therefore, the absence of these pathogens does not necessarily signify the absence of PID, and does not indicate that treatment was not needed. Overall, our findings show that syndromic management is not effective for controlling STIs in this population at increased risk of HIV infection, and there is an urgent need to develop focused interventions and programmes to prevent, identify and treat STIs effectively in this population.
Our risk factor analysis identified women at greatest risk for STIs in this population and who may benefit from focused interventions. Young women were at increased risk for C. trachomatis and N. gonorrhoeae infection, and these infections were associated with each other. Lower levels of education were a risk factor for both T. vaginalis and high-titre active syphilis, and these infections were associated with each other. Married women were at lower risk of T. vaginalis. Sexual and other behavioural indices, such as higher total number of lifetime partners, concurrent sex partners and harmful alcohol use were associated with curable STIs. Overall, risk factors for curable STIs identified in this cohort were as expected and consistent with the literature [35]–[38]. One exception was the finding that women who had at least one pregnancy in their lifetime were at higher risk for C. trachomatis and N. gonorrhoeae infection; it is possible that a past pregnancy may be a proxy for past unprotected sex. Additionally, women who had recently started work in a recreational or food facility were at higher risk for C. trachomatis infection than those who had been there for a year or more. There is evidence suggesting partial immunity against reinfection with C. trachomatis [39]; therefore women entering into a high risk occupation may be at higher risk of infection than those who have been working in a high-risk setting for several years. It is also possible that some behaviour change may account for this difference, with women who have been working in a facility for a longer time possibly having fewer sexual partners or using condoms more often; however we found no evidence for this in this cohort.
Women in this study using DMPA were at higher risk for C. trachomatis infection. Several longitudinal studies have found an association between DMPA use and cervical infection with either C. trachomatis or N. gonorrhoeae [40]–[42], as well as HIV acquisition [43], although these findings have not been consistent [44]. While C. trachomatis may lie on the causal pathway between DMPA and HIV acquisition, DMPA may also increase susceptibility to both infections. It is also possible that women who use DMPA may have different sexual behaviour (e.g. use less condoms) than those who do not use DMPA, which may increase risk for STIs. Indeed, women using hormonal contraceptives have been shown to use condoms less frequently than women not using hormonal contraception [42].
The foundation of STI prevention and control is early diagnosis and treatment, including the treatment of partners. Yet, sensitive screening tests for STIs are expensive and rarely available in resource-limited settings. Affordable, rapid point-of-care tests would be valuable tools for detection and treatment of these infections in this population, and should be a priority for development [47]. A modelling study using data from a sex worker project in Benin suggested that rapid point-of-care screening tests for cervical infection due to C. trachomatis and N. gonorrhoeae may be more cost effective than a syndromic approach because of higher sensitivity and specificity [48]. Of the potential interventions available, there is good evidence that risk reduction counselling and condom promotion reduce STI risk [49]. Structural interventions, such as economic interventions or tackling gender disadvantage, are promising interventions to address main underlying factors in this population, but are not well evaluated [49].
In summary, we found a high prevalence of STIs among women who work in bars, hotels, and other food and recreational facilities near large-scale gold and diamond mines in northwestern Tanzania. This population is at increased risk for HIV infection in addition to reproductive health morbidities caused by STIs. Syndromic diagnosis, dependent on signs and symptoms of STIs, was poorly predictive of laboratory-diagnosed STIs. Untreated STIs in this population will translate into a high risk of STIs for male partners, sexual partners of those men, and infants who may become congenitally infected. The importance of the treatment errors and missed opportunities for cure should not be under-estimated. Innovative strategies to reduce the burden of STIs are urgently needed, and affordable rapid-point-of-care tests should be a priority for development.
Supporting Information
Supporting tables. Table S1, Final sociodemographic-, behavioural- and biological-level model results for Chlamydia trachomatis (adjusted odds ratio and 95% CI). Table S2, Final sociodemographic-, behavioural- and biological-level model results for Neisseria gonorrhoeae (adjusted odds ratio and 95% CI). Table S3, Final sociodemographic-, behavioural- and biological-level model results for Trichomonas vaginalis (adjusted odds ratio and 95% CI). Table S4, Final sociodemographic-, behavioural- and biological-level model results for active syphilis (high titre) (adjusted odds ratio and 95% CI).
(DOCX)
Acknowledgments
We thank the study participants in Geita, Kahama, and Shinyanga towns who agreed to take part in this study; research staff from the Women's Health Project for their efforts in data collection; staff of the Mwanza Intervention Trials Unit for their administrative support; and the National Institute of Medical Research and the London School of Hygiene and Tropical Medicine for providing institutional support.
Funding Statement
Financial support was provided by the European and Developing Countries Clinical Trials Partnership (project code: CT_ct_05_32070_002) and from the Medical Research Council (MRC) and Department for International Development (DFID) with S. Kapiga (G0901756), S.C. Francis (G1002369), R.J. Hayes, and F. Vanobberghen (G0700837) receiving MRC & DFID support. The funders had no role in study design, data collection and analysis, decision to publish, or preparation of the manuscript.
References
- 1. Celum CL (2010) Sexually transmitted infections and HIV: epidemiology and interventions. Top HIV Med 18: 138–142 Available: http://www.ncbi.nlm.nih.gov/pubmed/21107013. [PubMed] [Google Scholar]
- 2.Schmid G, Samuelson J, Rowley J (2005) Prevalence and incidence of selected sexually transmitted infections Chlamydia trachomatis, Neisseria gonorrhoeae, syphilis and Trichomonas vaginalis. Geneva: World Health Organization.
- 3.Tobian AA, Quinn TC (2009) Herpes simplex virus type 2 and syphilis infections with HIV: an evolving synergy in transmission and prevention. Curr Opin HIV AIDS 4: 294–299. Available: http://www.pubmedcentral.nih.gov/articlerender.fcgi?artid=2752434&tool=pmcentrez&rendertype=abstract. Accessed 2013 Mar 27. [DOI] [PMC free article] [PubMed]
- 4. Moodley P, Connolly C, Sturm AW (2002) Interrelationships among human immunodeficiency virus type 1 infection, bacterial vaginosis, trichomoniasis, and the presence of yeasts. J Infect Dis 185: 69–73 Available: http://www.ncbi.nlm.nih.gov/pubmed/11756983. [DOI] [PubMed] [Google Scholar]
- 5. Fleming DT, Wasserheit JN (1999) From epidemiological synergy to public health policy and practice: the contribution of other sexually transmitted diseases to sexual transmission of HIV infection. Sex Transm Infect 75: 3–17 Available: http://www.ncbi.nlm.nih.gov/entrez/query.fcgi?cmd=Retrieve&db=PubMed&dopt=Citation&list_uids=10448335. [DOI] [PMC free article] [PubMed] [Google Scholar]
- 6. Rours GIJG, Duijts L, Moll H a, Arends LR, de Groot R, et al. (2011) Chlamydia trachomatis infection during pregnancy associated with preterm delivery: a population-based prospective cohort study. Eur J Epidemiol 26: 493–502. Available: http://www.pubmedcentral.nih.gov/articlerender.fcgi?artid=3115062&tool=pmcentrez&rendertype=abstract. Accessed 2013 Mar 26 [DOI] [PMC free article] [PubMed] [Google Scholar]
- 7. Watson-Jones D, Changalucha J, Gumodoka B, Weiss HA, Rusizoka M, et al. (2002) Syphilis in pregnancy in Tanzania. I. Impact of maternal syphilis on outcome of pregnancy. J Infect Dis 186: 940–947 Available: http://www.ncbi.nlm.nih.gov/pubmed/12232834. [DOI] [PubMed] [Google Scholar]
- 8. Johnson HL, Ghanem KG, Zenilman JM, Erbelding EJ (2011) Sexually transmitted infections and adverse pregnancy outcomes among women attending inner city public sexually transmitted diseases clinics. Sex Transm Dis 38: 167–171. Available: http://www.ncbi.nlm.nih.gov/pubmed/20852454. Accessed 2013 Mar 27 [DOI] [PubMed] [Google Scholar]
- 9. Kapiga SH, Sam NE, Shao JF, Renjifo B, Masenga EJ, et al. (2002) HIV-1 epidemic among female bar and hotel workers in northern Tanzania: risk factors and opportunities for prevention. J Acquir Immune Defic Syndr 29: 409–417. Available: http://www.ncbi.nlm.nih.gov/entrez/query.fcgi?cmd=Retrieve&db=PubMed&dopt=Citation&list_uids=11917247. Accessed 2014 Jan 3 [DOI] [PubMed] [Google Scholar]
- 10. Vallely A, Kasindi S, Hambleton IR, Knight L, Chirwa T, et al. (2007) Microbicides development program, Tanzania-baseline characteristics of an occupational cohort and reattendance at 3 months. Sex Transm Dis 34: 638–643. Available: http://www.ncbi.nlm.nih.gov/pubmed/17717482. Accessed 2012 July 3 [DOI] [PubMed] [Google Scholar]
- 11. Watson-Jones D, Weiss HA, Rusizoka M, Baisley K, Mugeye K, et al. (2007) Risk factors for herpes simplex virus type 2 and HIV among women at high risk in northwestern Tanzania: preparing for an HSV-2 intervention trial. J Acquir Immune Defic Syndr 46: 631–642 Available: http://www.ncbi.nlm.nih.gov/pubmed/18043318. [DOI] [PMC free article] [PubMed] [Google Scholar]
- 12. Riedner G, Hoffmann O, Rusizoka M, Mmbando D, Maboko L, et al. (2006) Decline in sexually transmitted infection prevalence and HIV incidence in female barworkers attending prevention and care services in Mbeya Region, Tanzania. Aids 20: 609–615 Available: http://www.ncbi.nlm.nih.gov/pubmed/16470126. [DOI] [PubMed] [Google Scholar]
- 13. Clift S, Anemona a, Watson-Jones D, Kanga Z, Ndeki L, et al. (2003) Variations of HIV and STI prevalences within communities neighbouring new goldmines in Tanzania: importance for intervention design. Sex Transm Infect 79: 307–312 Available: http://www.pubmedcentral.nih.gov/articlerender.fcgi?artid=1744727&tool=pmcentrez&rendertype=abstract. [DOI] [PMC free article] [PubMed] [Google Scholar]
- 14.Ministry of Health and Social Welfare (2007) National Guidelines for management of sexually transmitted and reproductive tract infections. First. National AIDS Control Programme (NACP) & Reproductive and Child Health Section, editor Dar Es Salaam: The United Republic of Tanzania. Available: http://www.nacp.go.tz/documents/stinationalguideline.pdf.
- 15.Organization WH (2001) Guidelines for the Management of Sexually Transmitted Infections. Geneva. Available: http://apps.who.int/medicinedocs/en/d/Jh2942e/2.html.
- 16.Das A, Pathni AK, Narayanan P, George B, Morineau G, et al. (2013) High rates of reinfection and incidence of bacterial sexually transmitted infections in a cohort of female sex workers from two Indian cities: need for different STI control strategies? Sex Transm Infect 89: 5–10. Available: http://www.pubmedcentral.nih.gov/articlerender.fcgi?artid=3582065&tool=pmcentrez&rendertype=abstract. Accessed 2013 Mar 27. [DOI] [PMC free article] [PubMed]
- 17.Mlisana K, Naicker N, Werner L, Roberts L, van Loggerenberg F, et al. (2012) Symptomatic vaginal discharge is a poor predictor of sexually transmitted infections and genital tract inflammation in high-risk women in South Africa. J Infect Dis 206: 6–14. Available: http://www.ncbi.nlm.nih.gov/pubmed/22517910. Accessed 2013 Mar 8. [DOI] [PMC free article] [PubMed]
- 18.Kapiga SH, Ewings FM, Ao T, Chilongani J, Mongi A, et al. (2013) The Epidemiology of HIV and HSV-2 Infections among Women Participating in Microbicide and Vaccine Feasibility Studies in Northern Tanzania. PLoS One 8: e68825. Available: http://www.pubmedcentral.nih.gov/articlerender.fcgi?artid=3715536&tool=pmcentrez&rendertype=abstract. Accessed 2013 July 31. [DOI] [PMC free article] [PubMed]
- 19.Mahony JB, Song X, Chong S, Faught M, Salonga T, et al. (2001) Evaluation of the NucliSens Basic Kit for detection of Chlamydia trachomatis and Neisseria gonorrhoeae in genital tract specimens using nucleic acid sequence-based amplification of 16S rRNA. J Clin Microbiol 39: 1429–1435. Available: http://www.pubmedcentral.nih.gov/articlerender.fcgi?artid=87950&tool=pmcentrez&rendertype=abstract. Accessed 2014 Jan 3. [DOI] [PMC free article] [PubMed]
- 20. Nugent RP, Krohn MA, Hillier SL, Vaginosis B (1991) Reliability of diagnosing bacterial vaginosis is improved by a standardized method of gram stain interpretation. J Clin Microbiol 29: 297–301 Available: http://www.pubmedcentral.nih.gov/articlerender.fcgi?artid=269757&tool=pmcentrez&rendertype=abstract. [DOI] [PMC free article] [PubMed] [Google Scholar]
- 21. Wilson EB (1927) Probable inference, the law of succession, and statistical inference. J Am Stat Assoc 22: 209–212 Available: http://www.med.mcgill.ca/epidemiology/hanley/tmp/Proportion/wilson_jasa_1927.pdf. [Google Scholar]
- 22.Cotch MF, Pastorek JG, Nugent RP, Hillier SL, Gibbs RS, et al. (1997) Trichomonas vaginalis associated with low birth weight and preterm delivery. The Vaginal Infections and Prematurity Study Group. Sex Transm Dis 24: 353–360. Available: http://www.ncbi.nlm.nih.gov/pubmed/9243743. Accessed 2014 Jan 3. [DOI] [PubMed]
- 23. Moodley P, Wilkinson D, Connolly C, Moodley J, Sturm a W (2002) Trichomonas vaginalis is associated with pelvic inflammatory disease in women infected with human immunodeficiency virus. Clin Infect Dis 34: 519–522 Available: http://www.ncbi.nlm.nih.gov/pubmed/11797180. [DOI] [PubMed] [Google Scholar]
- 24.Laga M, Manoka A, Kivuvu M, Malele B, Tuliza M, et al. (1993) Non-ulcerative sexually transmitted diseases as risk factors for HIV-1 transmission in women: results from a cohort study. AIDS 7: 95–102. Available: http://www.ncbi.nlm.nih.gov/pubmed/8442924. Accessed 2014 Jan 3. [DOI] [PubMed]
- 25.McClelland S, Sangare L, Hassan WM, Lavreys L, Mandaliya KN, et al. (2007) Infection with Trichomonas vaginalis increases the risk of HIV-1 acquisition. J Infect Dis 195: 698–702. Available: http://www.ncbi.nlm.nih.gov/pubmed/17262712. Accessed 2010 Oct 14. [DOI] [PubMed]
- 26.Mavedzenge SN, Pol B Van Der, Cheng H, Montgomery ET, Blanchard K, et al. (2010) Epidemiological synergy of Trichomonas vaginalis and HIV in Zimbabwean and South African women. Sex Transm Dis 37: 460–466. Available: http://www.ncbi.nlm.nih.gov/pubmed/20562586. Accessed 2011 Aug 7. [DOI] [PubMed]
- 27.Workowski KA, Berman S (2010) Sexually transmitted diseases treatment guidelines, 2010. MMWR Recomm Rep 59: 1–110. Available: http://www.ncbi.nlm.nih.gov/pubmed/21160459. Accessed 2014 Jan 3. [PubMed]
- 28.Desai VK, Kosambiya JK, Thakor HG, Umrigar DD, Khandwala BR, et al. (2003) Prevalence of sexually transmitted infections and performance of STI syndromes against aetiological diagnosis, in female sex workers of red light area in Surat, India. Sex Transm Infect 79: 111–115. Available: http://www.pubmedcentral.nih.gov/articlerender.fcgi?artid=1744644&tool=pmcentrez&rendertype=abstract. Accessed 2013 Nov 6. [DOI] [PMC free article] [PubMed]
- 29.Iqbal SM, Kaul R (2008) Mucosal innate immunity as a determinant of HIV susceptibility. Am J Reprod Immunol 59: 44–54. Available: http://www.ncbi.nlm.nih.gov/pubmed/18154595. Accessed 2012 Oct 31. [DOI] [PubMed]
- 30.Bolan GA, Sparling PF, Wasserheit JN, Duncan S, Duncan CJ (2012) The emerging threat of untreatable gonococcal infection. N Engl J Med 366: 2136. Available: http://www.ncbi.nlm.nih.gov/pubmed/22646648. Accessed 2012 Mar 1. [DOI] [PubMed]
- 31. Tapsall JW (2005) Antibiotic resistance in Neisseria gonorrhoeae. Clin Infect Dis 41 Suppl 4S263–8 Available: http://www.ncbi.nlm.nih.gov/pubmed/20521493. [DOI] [PubMed] [Google Scholar]
- 32.Duncan S, Thiong'o AN, Macharia M, Wamuyu L, Mwarumba S, et al. (2011) High prevalence of quinolone resistance in Neisseria gonorrhoeae in coastal Kenya. Sex Transm Infect 87: 231. Available: http://www.ncbi.nlm.nih.gov/pubmed/21307154. Accessed 2012 June 15. [DOI] [PubMed]
- 33.Lagace-Wiens PRS, Duncan S, Kimani J, Thiong'o A, Shafi J, et al. (2012) Emergence of fluoroquinolone resistance in Neisseria gonorrhoeae isolates from four clinics in three regions of Kenya. Sex Transm Dis 39: 332–334. Available: http://www.ncbi.nlm.nih.gov/pubmed/22504591. Accessed 2012 June 15. [DOI] [PMC free article] [PubMed]
- 34.Taylor-Robinson D, Jensen JS, Svenstrup H, Stacey CM (2012) Difficulties experienced in defining the microbial cause of pelvic inflammatory disease. Int J STD AIDS 23: 18–24. Available: http://www.ncbi.nlm.nih.gov/pubmed/22362682. Accessed 2014 May 8. [DOI] [PubMed]
- 35. Kapiga S, Kelly C, Weiss S, Daley T, Peterson L, et al. (2009) Risk factors for incidence of sexually transmitted infections among women in South Africa, Tanzania, and Zambia: results from HPTN 055 study. Sex Transm Dis 36: 199–206 10.1097/OLQ.0b013e318191ba01 [DOI] [PubMed] [Google Scholar]
- 36. Feldblum PJ, Lie C-C, Weaver M a, Van Damme L, Halpern V, et al. (2010) Baseline Factors Associated With Incident HIV and STI in Four Microbicide Trials. Sex Transm Dis 37: 1 10.1097/OLQ.0b013e3181e15f0b [DOI] [PubMed] [Google Scholar]
- 37. Masese L, Baeten JM, Richardson B a, Deya R, Kabare E, et al. (2013) Incidence and correlates of Chlamydia trachomatis infection in a high-risk cohort of Kenyan women. Sex Transm Dis 40: 221–225 10.1097/OLQ.0b013e318272fe45 [DOI] [PMC free article] [PubMed] [Google Scholar]
- 38.Cook RL, Clark DB (2005) Is There an Association Between Alcohol Consumption and Sexually Transmitted Diseases? A Systematic Review. Sex Transm Dis 32: 156–164. Available: http://content.wkhealth.com/linkback/openurl?sid=WKPTLP:landingpage&an=00007435-200503000-00004. Accessed 2013 Nov 11. [DOI] [PubMed]
- 39.Batteiger BE, Xu F, Johnson RE, Rekart ML (2010) Protective immunity to Chlamydia trachomatis genital infection: evidence from human studies. J Infect Dis 201 Suppl: S178–89. Available: http://jid.oxfordjournals.org/content/201/Supplement_2/S178.short. Accessed 2013 Dec 5. [DOI] [PMC free article] [PubMed]
- 40.Morrison CS, Bright P, Wong EL, Kwok C, Yacobson I, et al. (2004) Hormonal Contraceptive Use, Cervical Ectopy, and the Acquisition of Cervical Infections. Sex Transm Dis 31: 561–567. Available: http://content.wkhealth.com/linkback/openurl?sid=WKPTLP:landingpage&an=00007435-200409000-00009. Accessed 2013 Dec 3. [DOI] [PubMed]
- 41.Pettifor A, Delany S, Kleinschmidt I, Miller WC, Atashili J, et al. (2009) Use of injectable progestin contraception and risk of STI among South African women. Contraception 80: 555–560. Available: http://www.pubmedcentral.nih.gov/articlerender.fcgi?artid=2902790&tool=pmcentrez&rendertype=abstract. Accessed 2013 Dec 3. [DOI] [PMC free article] [PubMed]
- 42.Baeten JM, Nyange PM, Richardson B a, Lavreys L, Chohan B, et al. (2001) Hormonal contraception and risk of sexually transmitted disease acquisition: results from a prospective study. Am J Obstet Gynecol 185: 380–385. Available: http://www.ncbi.nlm.nih.gov/pubmed/11518896. Accessed 2013 Nov 12. [DOI] [PubMed]
- 43.Heffron R, Donnell D, Rees H, Celum C, Mugo N, et al. (2011) Use of hormonal contraceptives and risk of HIV-1 transmission: a prospective cohort study. Lancet Infect Dis 3099: 1–8. Available: http://linkinghub.elsevier.com/retrieve/pii/S147330991170247X. Accessed 2011 Oct 4. [DOI] [PMC free article] [PubMed]
- 44.Polis CB, Curtis KM (2013) Use of hormonal contraceptives and HIV acquisition in women: a systematic review of the epidemiological evidence. Lancet Infect Dis 13: 797–808. Available: http://www.ncbi.nlm.nih.gov/pubmed/23871397. Accessed 2013 Sept 17. [DOI] [PubMed]
- 45.Huppert JS, Mortensen JE, Reed JL, Kahn J a, Rich KD, et al. (2007) Rapid antigen testing compares favorably with transcription-mediated amplification assay for the detection of Trichomonas vaginalis in young women. Clin Infect Dis 45: 194–198. Available: http://www.ncbi.nlm.nih.gov/pubmed/17578778. Accessed 2014 May 2. [DOI] [PubMed]
- 46.Nye MB, Schwebke JR, Body B a (2009) Comparison of APTIMA Trichomonas vaginalis transcription-mediated amplification to wet mount microscopy, culture, and polymerase chain reaction for diagnosis of trichomoniasis in men and women. Am J Obstet Gynecol 200: 188.e1–7. Available: http://www.ncbi.nlm.nih.gov/pubmed/19185101. Accessed 2014 May 2. [DOI] [PubMed]
- 47.Peeling RW, Mabey D, Herring A, Hook EW (2006) Why do we need quality-assured diagnostic tests for sexually transmitted infections? Nat Rev Microbiol 4: 909–921. Available: http://www.ncbi.nlm.nih.gov/pubmed/17109030. Accessed 2013 Mar 10. [DOI] [PubMed]
- 48.Vickerman P, Peeling RW, Terris-Prestholt F, Changalucha J, Mabey D, et al. (2006) Modelling the cost-effectiveness of introducing rapid syphilis tests into an antenatal syphilis screening programme in Mwanza, Tanzania. Sex Transm Infect 82 Suppl 5: v38–43. Available: http://www.pubmedcentral.nih.gov/articlerender.fcgi?artid=2563909&tool=pmcentrez&rendertype=abstract. Accessed 2012 Dec 17. [DOI] [PMC free article] [PubMed]
- 49.Shahmanesh M, Patel V, Mabey DCW, Cowan FM (2008) Effectiveness of interventions for the prevention of HIV and other sexually transmitted infections in female sex workers in resource poor setting: a systematic review. Trop Med Int Health 13: 659–679. Available: http://www.ncbi.nlm.nih.gov/pubmed/18266784. Accessed 2010 Oct 14. [DOI] [PubMed]
Associated Data
This section collects any data citations, data availability statements, or supplementary materials included in this article.
Supplementary Materials
Supporting tables. Table S1, Final sociodemographic-, behavioural- and biological-level model results for Chlamydia trachomatis (adjusted odds ratio and 95% CI). Table S2, Final sociodemographic-, behavioural- and biological-level model results for Neisseria gonorrhoeae (adjusted odds ratio and 95% CI). Table S3, Final sociodemographic-, behavioural- and biological-level model results for Trichomonas vaginalis (adjusted odds ratio and 95% CI). Table S4, Final sociodemographic-, behavioural- and biological-level model results for active syphilis (high titre) (adjusted odds ratio and 95% CI).
(DOCX)