Abstract
The liver provides for long-term energy needs of the body by converting excess carbohydrate into fat for storage. Insulin is one factor that promotes hepatic lipogenesis, but there is increasing evidence that glucose also contributes to the coordinated regulation of carbohydrate and fat metabolism in liver by mechanisms that are independent of insulin. In this study, we show that the transcription factor, carbohydrate response element-binding protein (ChREBP), is required both for basal and carbohydrate-induced expression of several liver enzymes essential for coordinated control of glucose metabolism, fatty acid, and the synthesis of fatty acids and triglycerides in vivo.
Obesity and its associated diseases, hypertension, heart disease, diabetes, and some cancers, are among the most serious public health problems now facing the U.S. population. Evolutionary pressure favored mechanisms for early mammals to synthesize and store energy in the form of triglycerides when food was abundant as a safeguard against starvation in the face of uncertain food supplies. Some 2.5 million years later, grocery store shelves are reliably stocked with high-sugar and high-fat foods, especially in wealthy countries. It is no coincidence that >65 million Americans are now classified as overweight and obese.
In mammals, the liver is the major site of carbohydrate metabolism and triglyceride synthesis. Glucose and other simple sugars obtained by digestion of dietary starches and polysaccharides, i.e., carbohydrates, can be metabolized by the liver to provide substrates such as acetyl CoA for fatty acids for the synthesis of numerous molecules. Fatty acids are incorporated into triglycerides that function as a long-term energy reservoir.
Ingesting large amount in excess of carbohydrates leads to short- and long-term activation of many liver enzymes necessary for converting glucose to fatty acids. In the short term, key regulatory enzymes are activated by dephosphorylation/allosteric mechanisms (1). The long-term response is the transcriptional activation of genes encoding many of these same enzymes (2-5). The expression of >15 enzymes in liver is increased by high levels of glucose, primarily as the result of increased gene transcription. These enzymes include liver-type pyruvate kinase (LPK), a regulatory enzyme in the pathway of liver glycolysis, fatty acid synthase (FAS), which uses acetyl-CoA and malonyl-CoA to form long-chain fatty acids, acetyl-CoA carboxylase 1 (ACC1), whose activity provides malonyl-CoA, and S14, a nuclear protein thought to be involved in stimulating lipogenesis (reviewed in ref. 6).
Dietary carbohydrates also stimulate increased secretion of insulin and decreased secretion of glucagon; these pancreatic hormones play essential roles in regulating carbohydrate and fat metabolism. Sterol regulatory element-binding protein 1c (SREBP-1c), an isoform of the SREBP protein family of transcription factors, is responsible for the insulin-dependent increase in gene expression of lipogenic enzymes required for fatty acid and triglyceride synthesis (5, 7-9). However, SREBP-1c activity alone does not appear to fully account for stimulation of liver triglyceride synthesis by carbohydrates because the deletion of SREBP-1c in mice only results in an ≈50% reduction in fatty acid synthesis. In addition, the mRNA induction of several enzymes required for fatty acid synthesis in response to a high-carbohydrate diet, although significantly diminished, is not completely eliminated in SREBP-1c knockout mice (10). Studies using primary hepatocytes isolated from wild-type mice showed a pronounced synergistic increase in ACC, FAS, and S14 by insulin and high glucose, which could not be accounted for solely by SREBP-1c activity (11).
We recently identified a transcription factor carbohydrate response element-binding protein (ChREBP) that binds to the carbohydrate response element of the LPK gene (12). In primary hepatocytes, ChREBP stimulates LPK gene transcription in response to high concentrations of glucose without any apparent requirement for insulin. The stimulation of ChREBP by glucose occurs at two levels: (i) translocation from cytosol to nucleus and (ii) activation of DNA binding/transcription activity (13). In fasted rodent liver, the amount of the active ChREBP protein in the nucleus is low and it increases 2- to 3-fold upon refeeding a high-carbohydrate diet but not a high-fat diet. In transfected hepatocytes, ChREBP stimulates the transcription of reporter constructs containing carbohydrate response elements of the ATP citrate lyase (ACL), ACC, FAS, and S14 genes (unpublished data). The ability of ChREBP to bind and activate transcription of several lipogenic enzyme genes suggest that activation of ChREBP may be the glucose-dependent mechanism resulting in synergistic induction of fatty acid synthesis by glucose and insulin.
To gain insight into the physiological roles of ChREBP in vivo, a mouse model with a targeted disruption of the ChREBP gene (ChREBP-/-) was produced. The studies reported in this communication demonstrate that ChREBP coordinately regulates genes required for the conversion of glucose to fatty acids in liver.
Materials and Methods
Materials. Glucose, ATP, NADP(+), NADH, perchloric acid, KHCO3, and sucrose were purchased from Sigma. Hexokinase, glucose-6-phosphate dehydrogenase, pyruvate kinase, amyloglucosidase, and lactate dehydrogenase were purchased from Roche Diagnostics. Taq polymerase for PCR was purchased from Promega. Casein, mineral, and vitamin mix were purchased from Harlan Teklad.
Tissue Distribution of ChREBP mRNA Expression. mRNA from C57BL/6J mice (6 weeks old) was extracted from various tissues by using RNA STAT 60 (Tel-Test Inc., Friendswood, TX) according to manufacturer's protocols. Poly(A+) RNA (5 μg) from various tissues was subjected to Northern blot analysis using a 32P-labeled ChREBP cDNA probe as described (14).
Animals and Diets. All studies were approved by University of Texas Southwestern Medical Center Institutional Animal Care and Research Advisory Committee. All mice were male and 6-9 weeks old at the time of study. The wild-type (CHREBP+/+) and homozygous ChREBP knockout (ChREBP-/-) mice were housed and bred in a pathogen-free barrier facility, operating at room temperature in 12 h light/12 h dark cycle, at the Veterans Affairs Medical Center (Dallas). Before initiation of diet studies, the mice were maintained on a standard laboratory chow diet (Harlan Teklad Mouse/Rat Diet 7002, Harlan Teklad Premier Laboratory Diets). The high-starch diet contained 60% starch, 20% casein, 15% cellulose, 2.5% vitamins, and 2.5% minerals. Simple carbohydrate diets contained 60% glucose or sucrose instead of starch. The high-fat diet contained 31% casein, 31% cellulose, 3% peanut oil, 27% lard, 2.5% vitamin, 2.5% mineral, and 3% corn oil.
Mouse genotyping was done by PCR amplification of genomic DNA. In ChREBP-/- mice, primers targeting the PGK-neo cassette were: 5′-ACTGAGTGTCCACCTGTCTCCC (sense) and 5′-GCGTTGAGCTCCTCTATTTCATCCC-3′ (antisense); for Neo-ChREBP fusion, primers were 5′-ACTGAGTGTCCACCTGTCTCCC (the same primer as ChREBP sense) and 5′-TGATGCCGCCGTGTTCC-3′ (antisense). The PCR protocol was 35 cycles of 95°C for 30 sec, 59°C for 30 sec, and 72°C for 2 min.
Blood and Tissue Sampling. Plasma insulin, free fatty acids (FFA), triglyceride, and cholesterol concentrations were measured by using rat insulin kit (Linco Research, St. Louis), NEFA-C test (Wako Pure Chemical, Osaka), INFINITY Triglycerides Reagent (Sigma), and INFINITY Cholesterol Reagent (Sigma), respectively. Liver triglyceride concentrations were measured as described (15). Plasma glucose concentrations were measured by using ACCU-Chek Active (Roche Diagnostics). Liver and muscle glycogen concentrations were determined as described (16). Briefly, freeze-clamped tissues (100 mg) were homogenized in 2 ml of cold 6% perchloric acid, neutralized, and centrifuged. Glycogen in the extract (20 μl) was digested with amyloglycosidase at 40°C for 2 h, and the supernatant solution was then assayed. Glucose was assayed with a coupled assay using hexokinase and glucose 6-phosphate dehydrogenase (16).
Quantitative Real-Time RT-PCR. Total RNA was prepared from individual mouse livers, and equal aliquots were pooled for each group for real-time RT-PCR as described (10). Specific primers for each gene were designed by using primer express software (PE Biosystems, Foster City, CA). The relative amounts of all mRNAs were calculated by using the Comparative CT method (User Bulletin no. 2, PE Applied Biosystems). Cyclophilin mRNA was used as the invariant control.
Glucose and Insulin Tolerance Tests. Glucose tolerance tests were performed as follows. Mice were fasted overnight and injected with glucose (1 g/kg body weight) i.p. Blood was collected by retro-orbital puncture immediately before injection and at 30, 60, and 120 min after injection for determination of plasma glucose levels. Insulin tolerance tests were performed as follows. Fed mice were injected i.p. with 0.5 units/kg body weight of human insulin (Sigma), and plasma glucose concentrations were measured by using ACCU-Chek Active (Roche Diagnostics)
In Vivo Measurements of Hepatic Cholesterol and Fatty Acid Synthesis. Rates of cholesterol and fatty acid synthesis were measured in littermate 8-week-old mice during the early light cycle after a 2-hr fast exactly as described (17).
Immunoblot Analysis. Immunoblot analyses of mouse SREBP-cleavage activating protein (SCAP), SREBP-1, and SREBP-2 were carried out as described (10).
Liver Metabolites of Glycolysis and Gluconeogenesis in Wild-Type and ChREBP-/- Mouse Liver. Animals were killed by cervical dislocation, and livers were removed and immediately pressed between aluminum clamps cooled in liquid nitrogen. Perchloric acid extracts were used for measurements of metabolites. Pyruvate and phosphoenolpyruvate (PEP) were measured with lactate dehydrogenase and pyruvate kinase (16).
Results and Discussion
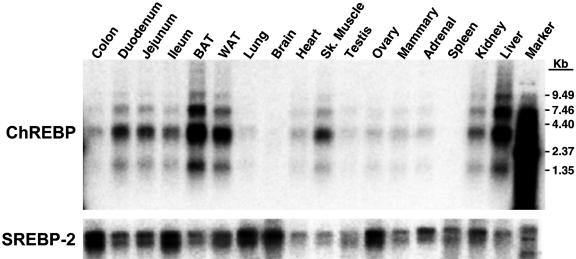
Tissue Distribution of ChREBP. Distribution of ChREBP mRNA in various tissues indicated that ChREBP expression is ubiquitous, but most highly expressed in liver, brown and white adipose tissues, small intestine, kidney, and muscle (Fig. 1).
Fig. 1.
Tissue distribution of ChREBP mRNA expression. Poly(A+) mRNA (5 μg) from various mouse tissues was subjected to Northern blot analysis using a 32P-labeled mouse ChREBP cDNA probe. The blot was stripped and reprobed with a 32P-labeled mouse SREBP-2 cDNA probe to demonstrate the presence of mRNA in all lanes. BAT, brown adipose tissue; Sk., skeletal; WAT, white adipose tissue.
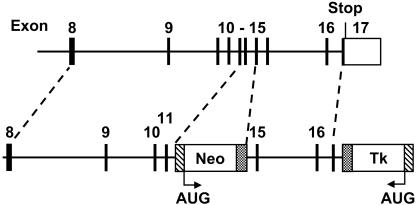
Characterization of ChREBP Knockout Mice. ChREBP-/- mice were generated as described in Fig. 2. The absence of ChREBP mRNA expression in livers of ChREBP knockout mice was confirmed by real-time RT-PCR (see Table 2). ChREBP-/- mice are viable and appear to have a normal life span. Matings between ChREBP+/- mice produced +/+, +/-, and -/- mice in the expected 1:2:1 ratio, indicating that ChREBP deficiency is not associated with any embryonic lethality. Because ChREBP induces LPK expression and also was predicted to be required for the full induction of several lipogenic enzymes in response to excess glucose, we hypothesized that ChREBP-/- mice would have diminished glucose utilization for fat synthesis in comparison to wild-type mice, resulting in lower fat storage and body weight.
Fig. 2.
Generation of the ChREBP-/- mice. The schematic diagram of genomic mouse DNA is shown for the region surrounding the basic helix-loop-helix-encoding exons (13 and 14) of the ChREBP gene (GenBank accession no. AC084109). The genomic region spanning coding exons 12-14 was replaced with a neomycin-resistance cassette provided by the pKO Scrambler NTKV-1901 vector (Stratagene). Targeted disruption of the ChREBP allele was generated in 129S6/SvEvTac-derived embryonic stem cells with the resulting progeny comprised of 129S6/SvEvTac:C57BL/6J mixed-strain mice. Homologous recombination of the targeting construct at the appropriate site was confirmed by Southern blot analysis (data not shown). Loss of ChREBP expression was confirmed by real-time PCR (Table 2).
Table 2. Relative liver mRNA levels in ChREBP−/− mice fed a standard rodent chow or a high-carbohydrate diet.
| Diet
|
||
|---|---|---|
| Gene | Standard | Starch |
| ChREBP | 0.00 | 0.00 |
| ATP citrate lyase | 0.82 | 0.77 |
| ACC1 | 0.76 | 0.62 |
| ACC2 | 0.62 | 0.49 |
| CPT1 | 0.86 | 0.67 |
| Fructokinase | 0.59 | 0.39 |
| FAS | 0.51 | 0.63 |
| Glucokinase | 2.00 | 1.03 |
| G6P dehydrogenase | 0.97 | 0.84 |
| G6Pase | 0.88 | 0.44 |
| Glut2 | 0.32 | 0.07 |
| Glycogen phosphorylase | 0.71 | 0.57 |
| Glycogen synthase | 0.76 | 0.74 |
| LCE elonelongase CE | 1.19 | 0.58 |
| LPK | 0.27 | 0.12 |
| Malic enzyme | 0.41 | 0.24 |
| PEPCK | 1.66 | 0.80 |
| PFK | 1.00 | 0.74 |
| SCD | 1.00 | 0.30 |
| SREBP-1c | 1.11 | 1.21 |
| SREBP-1a | 0.79 | 0.91 |
| SREBP-2 | 1.08 | 0.98 |
| S14 | 0.98 | 0.61 |
| Triose kinase | 0.35 | 0.25 |
Wild-type and ChREBP−/− mice were housed in individual cages with ad lib access to the diets unless otherwise noted. The standard rodent chow (Harlan Teklad Mouse/Rat Diet 7002) contains ≈30% (wt/vol), starch, 3% sucrose, and 6% fat. The high-starch diet contained 60.2% starch, 20% casein, 1.0% fat, 15% cellulose, and 2.5% vitamin and mineral mix (AIN-76, Harlan Teklad). Mice were fed the high-starch diet for 1 week before death. Equal amounts of liver mRNA pooled from four to five mice of each group, and specific mRNA levels were determined by real-time RT-PCR. The comparative cycle threshold method was used to determine mRNA levels in ChREBP−/− mice relative to age- and diet-matched wild-type mice, which are arbitrarily assigned a value of 1 for each mRNA species. Cyclophilin mRNA level was used as the invariant control.
To test this hypothesis, several physiologic parameters of 7-week-old male mice were measured and are listed in Table 1. Plasma glucose and insulin levels were somewhat elevated in ChREBP-/- mice fed the standard diet, consistent with decreased hepatic LPK expression and reduced liver glycolysis. Similarly, the mutant mice deposited a large amount of glycogen in liver, but not in muscle, which is likely a result of inhibited glycolysis. Plasma FFAs in ChREBP-/- mice were ≈50% of that measured in the wild-type mice. Adipose tissue was also significantly reduced in ChREBP-/- mice. Epididymal and brown fat weights of 7-week-old mice were 27% and 43% less, respectively, than those of age-matched controls.
Table 1. Phenotypic characteristics of wild-type and ChREBP−/− mice fed either a standard rodent chow or a high-starch diet.
| Standard rodent chow
|
High-starch diet
|
|||
|---|---|---|---|---|
| Parameter measured | WT | ChREBP−/− | WT | ChREBP−/− |
| Body weight, g | 22 ± 0.6 | 22 ± 0.7 | 26 ± 0.7 | 26 ± 1.1 |
| Liver weight, g | 0.97 ± 0.11 | 1.01 ± 0.02 | 1.17 ± 0.04 | 1.63 ± 0.10* |
| Epididymal fat weight, g | 0.37 ± 0.02 | 0.27 ± 0.02* | 0.28 ± 0.03 | 0.26 ± 0.04 |
| Brown fat weight, g | 0.14 ± 0.01 | 0.08 ± 0.02* | ND | ND |
| Plasma glucose, mg/dl | 157 ± 7 | 190 ± 6* | 271 ± 13 | 290 ± 13 |
| Plasma insulin, ng/ml | 0.84 ± 0.07 | 1.07 ± 0.2 | 0.78 ± 0.08 | 1.34 ± 0.20* |
| Plasma FFA, mM | 0.76 ± 0.09 | 0.40 ± 0.03* | 0.45 ± 0.03 | 0.24 ± 0.02* |
| Plasma triglycerides, mg/dl | 63.6 ± 13.5 | 65.8 ± 8.4 | 136 ± 18 | 119 ± 7 |
| Plasma cholesterol, mg/dl | ND | ND | 77 ± 7.6 | 39 ± 3.7* |
| Liver glycogen, μmol/g | 78.8 ± 18.8 | 214.5 ± 10.7* | 91.1 ± 8.3 | 612.7 ± 46.1* |
| Liver triglyceride, mg/g | 7.13 ± 0.92 | 7.11 ± 0.83 | 6.11 ± 0.42 | 2.68 ± 0.28* |
| Muscle glycogen, μmol/g | 22.8 ± 2.4 | 20.6 ± 2.5 | 23.0 ± 1.9 | 23.3 ± 2.0 |
Mice fed the standard rodent chow were killed at 7 weeks of age. For the high-starch diet, mice (9 weeks of age) were fed the high-starch diet for 1 week before death. All tissue determinations were made in mice killed between 8 and 9 a.m. Plasma glucose, insulin, triglycerides, FFA, and cholesterol were measured by using commercial kits. Tissue measurements were carried out as described in Materials and Methods. All values are the mean ± SE for n = 6 mice. Asterisks represent significant differences of at least P < 0.05 compared to wild-type (WT) mice. ND, not determined.
ChREBP Regulates the Expression of Glycolytic and Lipogenic Genes in Liver. To investigate whether deletion of ChREBP decreases gene expression of either key glycolytic or lipogenic enzymes, we measured the mRNA levels of LPK and several other genes involved in lipogenesis in livers from ChREBP-/- and wild-type mice fed a standard rodent diet (Table 2). In ChREBP-/- mouse liver, the mRNA level of LPK was only 27% of that measured in age-matched wild-type mice. ACL, ACC1, and FAS mRNA levels also were significantly lower in ChREBP-/- mice on the standard diet. Of all lipogenic enzyme mRNA levels examined, the greatest reduction (59%) was measured in the mRNA for malic enzyme. Malic enzyme generates NADPH needed for fatty acid synthesis. These results suggest that, in ChREBP-/- mice, not only is glycolysis reduced, resulting in decreased acetyl-CoA production for fat synthesis, but the expression of lipogenic enzymes also was reduced, suggesting that ChREBP coordinately regulates glucose utilization and fatty acid synthesis.
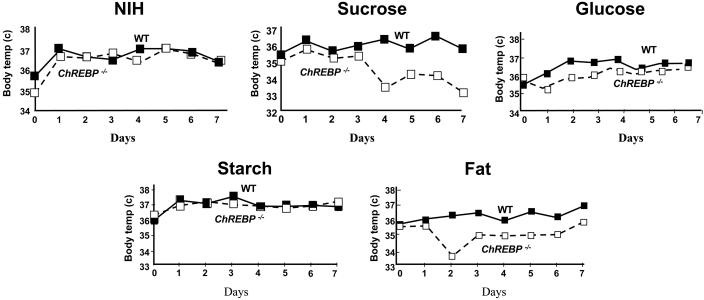
ChREBP Deficiency Causes Intolerance of Simple Carbohydrates. During the course of feeding mice various high-carbohydrate diets, it became apparent that ChREBP-/- mice would not ingest diets composed largely of simple sugars. To induce lipogenesis from excess carbohydrate, we first fed ChREBP-/- mice a high-sucrose diet (70% sucrose, 15% protein, and 2% fat). Sucrose is a disaccharide comprised of glucose and fructose. This diet resulted in a marked decline in plasma FFA levels and progressive hypothermia, culminating in death in <1 week for >50% of the ChREBP-/- mice (Fig. 3). ChREBP-/- mice fed a high-fructose diet became moribund in a few days.
Fig. 3.
ChREBP-/- mice were unable to ingest sucrose and developed hypothermia. Wild-type and ChREBP-/- mice were fed the indicated diet for 7 days, and changes in body temperature were followed daily. ChREBP deficiency caused hypothermia and death in mice because of their inability to metabolize fructose. Data are means of four animals.
To investigate possible mechanisms responsible for the intolerance to fructose, we measured the mRNA levels for several enzymes involved in fructose metabolism by quantitative PCR. The expression of two enzymes required for fructose entry into the glycolytic pathway in liver, fructokinase and triose kinase, were markedly reduced in the ChREBP-/- mice (Table 2). This reduction may be responsible for the absolute intolerance of diets containing substantial amounts of either fructose or sucrose. Glucose intolerance, although less severe than fructose, is probably due to inhibited glycolysis caused by repressed LPK expression.
ChREBP-/- mice were able to ingest complex carbohydrates in the form of starch, consuming approximately the same amount of food as when fed standard rodent chow. Therefore, we used the high-starch diet to study mice under conditions of induced glycolysis and lipogenesis.
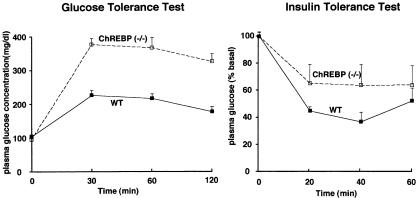
Feeding wild-type and ChREBP-/- mice the high-starch diet predictably resulted in high plasma glucose levels (Table 1). Plasma insulin levels in ChREBP-/- mice fed the high-starch diet also were significantly higher than ChREBP-/- mice fed the standard diet, and wild-type mice fed either diet. Glucose tolerance tests indicated that the ChREBP-/- mice were moderately insulin-resistant (Fig. 4). Plasma triglycerides were ≈2-fold higher in mice of both genotypes fed the high-starch diet but tended to be lower in the ChREBP-/- mice (Table 1). FFAs in plasma from ChREBP-/- mice fed high starch diet were ≈50% of the wild-type value; although levels in both groups were significantly lower than in mice fed the standard diet. The liver weights of ChREBP-/- mice were ≈40% greater than wild-type mice, which most likely resulted from increased glycogen storage in the ChREBP-/- mice in response to the excess dietary carbohydrate.
Fig. 4.
Glucose and insulin tolerance tests of wild-type and ChREBP-/- mice were conducted as described in Materials and Methods (n = 6 each). ChREBP deficiency causes mild insulin resistance.
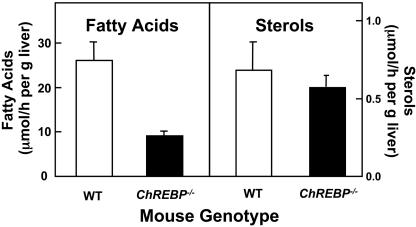
ChREBP Deficiency Decreases Lipogenesis. Despite the increased glucose and insulin levels in ChREBP-/- mice fed the high-starch diet, liver mRNA levels for several key lipogenic enzymes in the ChREBP-/- mice remained markedly lower than those in comparably fed wild-type mice (Table 2). Reductions in ACL, ACC1, and FAS mRNA levels in ChREBP-/- compared to wild-type mice on the high starch diet were similar to those measured in livers of mice fed the standard diet. In addition, the mRNA levels of malic enzyme, stearoyl-CoA desaturase-1 (SCD-1), the desaturase responsible for the production of monounsaturated fatty acids, and long-chain fatty acyl elongase (LCE) were significantly lower in ChREBP-/- mice fed the high-starch diet. As shown in Fig. 5, the reduced expression of lipogenic enzyme mRNAs in ChREBP-/- mouse liver resulted in hepatic fatty acid synthesis rates that were 65% lower in ChREBP-/- mice compared to wild-type mice, as measured by the incorporation of tritiated water.
Fig. 5.
Hepatic synthesis of fatty acids and sterols were determined in wild-type and ChREBP-/- mice as described in Materials and Methods to compare rates of lipogenesis and steroidgenesis in intact animals.
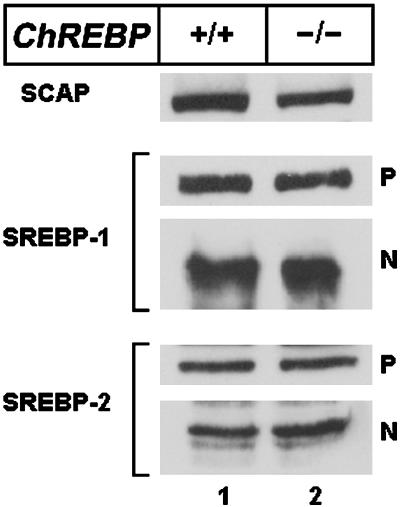
The reduced mRNA levels of enzymes required for fatty acid synthesis in ChREBP-/- mice do not appear to result from decreased expression or activation of SREBP-1c. The mRNA levels of all three SREBP isoforms and the amounts of membrane-bound and proteolytically processed nuclear SREBP-1 and SREBP-2 proteins were not different in either ChREBP-/- or wild-type mice (Table 2 and Fig. 6). These results suggest that the reduced lipogenic enzyme expression in ChREBP-/- mice is a direct effect of ChREBP rather than a secondary response mediated via reduced SREBP-1c expression.
Fig. 6.
Immunoblot analysis of SREBP-cleavage activating protein (SCAP), SREBP-1, and SREBP-2 in livers from wild type and ChREBP-/- mice fed the high-starch diet described in Table 2. Livers from each group were separately pooled, and 30-μg aliquots of the membrane and nuclear extract fractions were subjected to SDS/PAGE and immunoblot analysis. The precursor and nuclear forms of SREBPs are denoted as P and N, respectively.
Glycolysis and Gluconeogenesis in ChREBP-/- In ChREBP-/- mice fed the high-starch diet, the LPK mRNA level remained markedly lower than in those of wild-type mice, and the mRNA for Glut-2, the non-insulin-dependent glucose transporter was <10% of that measured in wild-type mice. Decreased Glut-2 expression does not appear to be rate-limiting for liver glycolysis in ChREBP-/- mice, because hepatic glucose and glucose 6P concentrations were higher in ChREBP-/- than wild-type mice on both standard and high-starch diets (Table 3). However, the decreased hepatic pyruvate/PEP ratio in ChREBP-/- mice indicates that hepatic glycolysis is inhibited at the level of pyruvate kinase (Table 3). It is interesting to note that the pyruvate level is lower in ChREBP-/- mice than in wild-type animals on standard diet, as expected, but on high-starch diet it is same in both animals on high-starch diet, suggesting that pyruvate is produced by some other enzyme(s) in ChREBP-/-. The source of pyruvate requires investigation. Decreased mRNA expression of the gluconeogenic enzymes, glucose 6-Pase, and PEP carboxykinase (PEPCK) in ChREBP-/- mice on the high+carbohydrate diet (Table 2) suggests that the increased hepatic glucose accumulation in ChREBP-/- mice does not result from increased gluconeogenesis. Based on these results, we suggest that the ChREBP-dependent transcriptional induction of genes required for glycolysis and fatty acid synthesis coordinates the conversion of excess carbohydrate to fat in liver. The markedly reduced levels of hepatic LPK mRNA in ChREBP knockout mice extends our previous findings on ChREBP regulation of LPK gene transcription. The current studies demonstrate that ChREBP is the dominant transcription factor required both for basal levels of LPK expression in mice fed a standard diet and for induced levels of LPK expression in mice fed a high-carbohydrate diet.
Table 3. Metabolites in ChREBP−/− and wild-type mouse livers.
| Parameter measured, μmol/g liver
|
Standard diet
|
High-starch diet
|
||
|---|---|---|---|---|
| WT | ChREBP−/− | WT | ChREBP−/− | |
| Glucose | 4.6 ± 0.3 | 6.7 ± 0.2 | 6.0 ± 0.6 | 7.8 ± 0.5 |
| Glu 6-P | 0.13 ± 0.2 | 0.25 ± 0.03 | 0.13 ± 0.01 | 0.31 ± 0.03 |
| PEP | 0.11 ± 0.03 | 0.20 ± 0.08 | 0.11 ± 0.01 | 0.29 ± 0.02 |
| Pyruvate | 0.13 ± 0.027 | 0.043 ± 0.003* | 0.115 ± 0.012 | 0.118 ± 0.009 |
| Pyruvate/PEP | 1.2 | 0.22 | 1.0 | 0.40 |
Wild-type (WT) and ChREBP−/− mice were fed standard rodent chow or the high-starch diet for 1 week. The mice were killed; livers were removed and immediately freeze-clamped between aluminum blocks cooled in liquid nitrogen. The metabolites were measured according to Bergmeyer (16). n = 4; P < 0.05.
The decreased mRNA expression of enzymes required for fatty acid synthesis in ChREBP-/- mice, despite apparently normal SREBP-1c activation, indicates that activation of both transcription factors are required for normal expression levels of ACL, ACC, FAS, and malic enzyme. ChREBP is also required for the carbohydrate-induced transcriptional activation of several additional enzymes involved in fatty acid synthesis, most notably SCD-1. ChREBP activation is regulated almost entirely posttranslationally by phosphorylation and dephosphorylation of the ChREBP protein (13, 18). Phosphorylation by AMP-dependent protein kinase (AMPK) inhibits the DNA-binding activity of ChREBP, whereas both the DNA binding activity and nuclear import of ChREBP are blocked by phosphorylation by cAMP-dependent protein kinase (PKA). PKA activity is high when the ratio of insulin to glucagon is low (as occurs during fasting), whereas AMPK activity increases in response to dietary fat. Dephosphorylation of ChREBP, which results in nuclear import and restoration of DNA-binding activity, is mediated by a xylulose 5-P (Xu5P)-activated protein serine/threonine phosphatase (Ppase) that is found in both the cytoplasm and the nucleus (19). The concentration of Xu5P, an intermediate in the pentose shunt pathway, increases under conditions of high glucose and serves as a glucose signaling molecule.
The ChORE (carbohydrate-response element) of the LPK gene contains a palindromic pair of modified E-box elements that mediates ChREBP binding. The ACC, FAS, and S14 gene ChOREs contain similar palindromic E-box pairs, whereas a single modified E-box element is found in the ChORE of ACL gene. Although no formal promoter studies have been reported with ChREBP, it is likely that ChREBP directly activates the transcription of these genes in vivo by binding to promoter elements previously shown to be involved in glucose-mediated transcriptional activation in vitro. It is also likely that ChREBP directly activates the transcription of several additional lipogenic enzyme genes such as malic enzyme and SCD-1, whose expression levels were significantly decreased in ChREBP-/- mice. Finally, ChREBP promotes the transcription of the enzymes required for fructose entry into glycolysis, providing for the coordinated activation of glycolysis and metabolism of other sugars, such as common table sugar (sucrose), in addition to glucose.
In summary, the studies in the ChREBP-/- mice have revealed a previously unrecognized role for ChREBP in liver. They predictably showed that ChREBP is required for normal LPK expression, and that the reduced ability to metabolize glucose results in glycogen accumulation in liver. However, these studies also demonstrated that ChREBP is required for the normal lipogenic response to a carbohydrate load, strongly suggesting that ChREBP is the transcriptional mediator of the well described carbohydrate induction of lipogenesis in liver.
Acknowledgments
We thank Drs. Bonnie Miller and Steven L. McKnight for their critical reading of this manuscript. We also thank Norma Anderson, Jeff Cormier, and Scott Clark for excellent technical assistance. This work was supported in part by National Institutes of Health Grant HL-20948 (to G.L. and J.D.H.) and Veterans Affairs Merit Review (to K.U.). J.D.H. is a Pew Scholar in the Biomedical Sciences and recipient of an Established Investigator Grant from the American Heart Association.
Abbreviations: ChREBP, carbohydrate response element-binding protein; FFA, free fatty acid; LPK, liver-type pyruvate kinase; ACC1, acetyl-CoA carboxylase 1; SREBP, sterol regulatory element-binding protein; ACL, ATP citrate lyase; FAS, fatty acid synthase; PEP, phosphoenolpyruvate.
References
- 1.Hillgartner, F. B., Salati, L. M. & Goodridge, A. G. (1995) Physiol. Rev. 75, 47-76. [DOI] [PubMed] [Google Scholar]
- 2.Towle, H. C., Kaytor, E. N. & Shih, H. M. (1997) Annu. Rev. Nutr. 17, 405-433. [DOI] [PubMed] [Google Scholar]
- 3.Girard, J., Ferre, P. & Foufelle, F. (1997) Annu. Rev. Nutr. 17, 325-352. [DOI] [PubMed] [Google Scholar]
- 4.Vaulont, S., Vasseur-Cognet, M. & Kahn, A. (2000) J. Biol. Chem. 275, 31555-31558. [DOI] [PubMed] [Google Scholar]
- 5.Osborne, T. F. (2000) J. Biol. Chem. 275, 32379-32382. [DOI] [PubMed] [Google Scholar]
- 6.Towle, H. C. (1995) J. Biol. Chem. 270, 23235-23238. [DOI] [PubMed] [Google Scholar]
- 7.Brown, M. S. & Goldstein, J. L. (1997) Cell 89, 331-340. [DOI] [PubMed] [Google Scholar]
- 8.Horton, J. D., Bashmakov, Y., Shimomura, I. & Shimano, H. (1998) Proc. Natl. Acad. Sci. USA 95, 5987-5992. [DOI] [PMC free article] [PubMed] [Google Scholar]
- 9.Foretz. M., Guichard, C., Ferre, P. & Foufelle, F. (1999) Proc. Natl. Acad. Sci. USA 96, 12737-12742. [DOI] [PMC free article] [PubMed] [Google Scholar]
- 10.Liang, G., Yang, J., Horton, J. D., Hammer, R. E., Goldstein, J. L. & Brown, M. S. (2002) J. Biol. Chem. 277, 9520-9528. [DOI] [PubMed] [Google Scholar]
- 11.Koo, S. H., Dutcher, A. K. & Towle, H. C. (2001) J. Biol. Chem. 276, 9437-9445. [DOI] [PubMed] [Google Scholar]
- 12.Yamashita, H., Takenoshita, M., Sakurai, M., Bruick, R. K., Henzel, W. J., Shillinglaw, W., Arnot, D. & Uyeda, K. (2001) Proc. Natl. Acad. Sci. USA 98, 9116-9121. [DOI] [PMC free article] [PubMed] [Google Scholar]
- 13.Kawaguchi, T., Takenoshita, M., Kabashima, T. & Uyeda, K. (2001) Proc. Natl. Acad. Sci. USA 98, 13710-13715. [DOI] [PMC free article] [PubMed] [Google Scholar]
- 14.Moon, Y. A. & Horton, J. D. (2001) J. Biol. Chem. 276, 45358-45366. [DOI] [PubMed] [Google Scholar]
- 15.Yokode, M., Hammer, R. E., Ishibashi, S., Brown, M. S. & Goldstein, J. L. (1990) Science 250, 1273-1275. [DOI] [PubMed] [Google Scholar]
- 16.Bergmeyer, H. U. (1974) Methods of Enzymatic Analysis (Academic, New York), 2nd Ed., Vol. 3.
- 17.Horton, J. D., Shimomura, I., Brown, M. S., Hammer, R. E., Goldstein, J. L. & Shimano, H. (1998) J. Clin. Invest. 101, 2331-2339. [DOI] [PMC free article] [PubMed] [Google Scholar]
- 18.Kawaguchi, T., Osatomi, K., Yamashita, H., Kabashima, T. & Uyeda, K. (2002) J. Biol. Chem. 277, 3829-3835. [DOI] [PubMed] [Google Scholar]
- 19.Kabashima, T., Kawaguchi, T., Wadzinski, B. E. & Uyeda, K. (2003) Proc. Natl. Acad. Sci. USA 100, 5107-5112. [DOI] [PMC free article] [PubMed] [Google Scholar]


