

Abstract
Purpose. The aim was to explore the effect of the chromium picolinate (CrPic) administration on the pancreas and macroangiopathy of type II diabetes mellitus rats. Methods. The type II diabetes mellitus (T2DM) rat model was induced by low-dose streptozotocin (STZ). The rats were randomly divided into 5 groups (ten rats in each group). After supplementing CrPic for 15 weeks, the histopathological examination was performed by hematoxylin-eosin (HE) staining. Serum insulin and NO level were determined by radioimmunoassay and colorimetry, respectively. Serum glycosylated hemoglobin (HbA1C), adiponectin (APN), advanced glycation end products (AGES), and apelin were measured by ELISA. Real-time reverse transcription polymerase chain reaction (RT-PCR) was applied for detecting the mRNA expression of APN and apelin. Results. After CrPic treatment, compared with the T2DM control group (group 2), pancreas sections stained with HE showed the completed pancreatic cells structure and no inflammatory infiltration in groups 4 and 5. In addition, the levels of serum NO and insulin were significantly increased and the serum levels of HbA1C, AGES, APN, and apelin were significantly decreased in groups 4 and 5 compared with group 2. The mRNA expression of APN and apelin in groups 4 and 5 was also recovered to the normal level. Conclusion. CrPic can recover the function of Β-cells and alleviate macroangiopathy in STZ-induced T2DM rats.
1. Introduction
Diabetes mellitus (DM) is one kind of metabolic syndromes characterized by chronic hyperglycemia [1]. The cases of diabetes fall into two broad pathogenetic categories: type I and type II diabetes mellitus (T1DM and T2DM). T2DM, which is previously referred to as noninsulin-dependent diabetes mellitus (NIDDM), accounts for approximately 90% of the diabetes patients [2, 3]. There were many complications, such as nephropathy [4], cataracts [5], microangiopathy, and macroangiopathy [6] in T2DM. Among them, macroangiopathy is the most frequent complication in the patients with T2DM [7–9], which manifests as atherosclerosis like in nondiabetic patients and is characterized by formation of plaques that follows in stages but with an accelerated course due to the several risk factors [10].
In current clinical treatment, western medicines are widely used to control the hyperglycemia, hyperlipidemia, and insulin resistance of type 2 diabetes mellitus, such as sulfonylurea, biguanides, thiazolidinediones, and glycosidase inhibitors [11]. However, the clinical efficacy of these drugs in treating T2DM is limited. Thus, it is urgently needed to explore the novel drugs and therapies to improve the treatment effect and reduce the risk of complications of T2DM.
Chromium (Cr), as an essential element, is directly related to the activity of glucose tolerance factor (GTF) [12]. Cr can alleviate glucose intolerance and insulin resistance [13] and it is involved in the metabolism of glucose, lipid, protein, and nucleic acid [14–17]. However, as supplementary drug, Cr could not be effectively used due to the poor absorption rate (dietary chromium: 0.4–2%; chromium chloride: 0.5–2%) [18–20]. Chromium picolinate (CrPic), also named as picolinic acid chromium, is a convenient form of chromium that is used more efficiently than some other forms of chromium [10]. The absorption rate of it is about 0.7–5.2% [19]. Several studies have proved that CrPic, as the source of Cr, can alleviate the high level of blood glucose, blood lipid, insulin, and cholesterol in the patients with metabolic syndrome [10, 21, 22]. Therefore, the efficacy of CrPic in treating T2DM is undisputed. However, the efficacy of CrPic in treating macroangiopathy in patients with T2DM has not been known.
In the present study, we evaluated the effect of CrPic on pancreas and macroangiopathy in T2DM rat model by detecting the levels of serum and fat markers of T2DM. The model was induced by streptozotocin (STZ).
2. Materials and Methods
2.1. Animals and Diets
Male Wistar rats (n = 50) weighting 250 ± 20 g were purchased from the animal center of Chinese academy of science. The animals were reared in a specific pathogen-free (SPF) laminar flow cabinet with temperature of 25 ± 1°C, humidity of 40–60%, and a 12:12 h light-dark cycle. The conventional diet and sterilized water were used to feed these rats.
The conventional diet and the high fat diet (HFD) were purchased from the laboratory animal center of Peking Union Medical College (PUMC). The conventional diet contains 41.47% carbohydrate, 14.42% fat, and 21.06% protein. The HFD contains 10% lard, 20% sucrose, 1% Choline chloride, 2.5% cholesterol, and 66.5% conventional diet.
2.2. Model Establishment of T2DM, Grouping, and Sample Collection
After adaptive feeding for one week, the rats were divided into five groups of ten rats in each group as follows: group 1, normal control rats; group 2, T2DM control rats; group 3, T2DM rats supplemented with 25 μg/kg CrPic; group 4, T2DM rats supplemented with 50 μg/kg CrPic; and group 5, T2DM rats supplemented with 100 μg/kg CrPic. Ten rats of normal control group were fed with conventional diet. Forty rats of the other four groups were fed with HFD. After four weeks, the forty rats of the other four groups were injected intraperitoneally with low dose (30 mg/kg) of STZ (Sigma) which was prepared in sterile citrate buffer (w/v: 2%). Ten rats of the normal control group were injected intraperitoneally with the same volume of sterile citrate buffer. After 72 h, the peripheral blood glucose level in tails of rats was detected by the Precision Xtra blood glucose monitoring system (Alameda, CA, USA). The model was successfully established if the blood glucose of the rats was over 16.7 mmol/L and polyuria and polydipsia appeared in these rats. After the levels of blood glucose stably were maintained for one week, the blood glucose and serum insulin concentrations of the rats in each group were determined before supplementing CrPic (Spectrum chemical & laboratory products, China). The rats of groups 3, 4, and 5 were supplemented with CrPic by gavage with equal volume of normal saline (NS; 0.9% NaCl) that contained different concentration of CrPic at every morning for 15 weeks. The rats of groups 1 and 2 were only supplemented with equal volume of NC that did not contain CrPic. After last time of CrPic administration, the rats were fasted but were not prohibited from drinking water for 12 h. The weight change and food intake of the rats in each group were monitored once a week and the behaviors and mental state of all the rats were observed during the whole experiment. Finally, all the rats were decapitated and the blood and the fat from the abdomen were collected for biochemical analyses. The pancreas was collected for hematoxylin-eosin (HE) staining.
2.3. Histopathological Analysis
The histopathological examinations of the pancreatic sections of the rats in each group were performed by standard histological techniques with HE staining. The collected pancreas tissue was fixed in 10% buffered formalin and embedded in paraffin and sections of pancreatic tissue were deparaffinized and stained with HE. The pathological changes of the lesion and its vicinity were observed by the light microscopy.
2.4. Determination of Serum Markers of T2DM
The detection of serum nitric oxide (NO) level was detected by using the Nitric Oxide Colorimetric Assay Kit (Nanjing Jiancheng Bioengineering Institute, China) following manufacturer's instruction. The serum insulin level was determined by using the radioimmunoassay kit (China Institute of Atomic Energy) according to the procedure described by the manufacturer. The serum levels of glycosylated hemoglobin (HbA1C), advanced glycation end products (AGES), adiponectin (APN), and apelin were assayed with an ELISA kit (R&D System, Minneapolis, MN).
2.5. Determination of mRNA Expression of APN and Apelin
The fat tissues obtained from abdomen were processed for RNA extraction. The TRIzol reagent (Invitrogen, Carlsbad, CA) was used to extract total RNAs for analyzing the mRNA expression of APN and apelin mRNA. The cDNA was synthesized out of the total RNA with a cDNA synthesis kit (Promega, Southampton, UK). The β -actin was regarded as control. The primer sequences of APN, apelin, and β -actin were shown in Table 1. Real-time reverse transcription polymerase chain reaction (RT-PCR) was performed using a reverse transcription Kit (Promega, Southampton, UK) following the manufacturer's protocol. The reaction condition of the real-time RT-PCR was 40 cycles of 95°C for 15 s, 55°C for 15 s, and 72°C for 15 s. Relative quantification of gene expression was done using the comparative CT (2−ΔΔCT) method.
Table 1.
The primer sequences of the APN, apelin, and β-actin.
| Gene name | Forward primer | Reverse primer |
|---|---|---|
| APN | CTG GAG AGA AGG GAG AGA AG | GCT GAA TGG TGA GTG ATA CA |
| Apelin | CTG CTC TGG CTC TCC TTG AC | ATG GGT CCC TTA TGG GAG AG |
| β -Actin | TCT TCC AGC CTT CCT TCC TG | TAG AGC CAC CAA TCC ACA CA |
APN: adiponectin.
2.6. Statistical Analyses
The data was analyzed by using the SPSS 13.0 software. Comparisons among four experimental groups were analyzed by one-way analysis of variance (ANOVA) followed by Bonferroni's test to evaluate statistical difference between two groups. P values less than 0.05 were defined as statistically significant. All data are presented as mean ± standard deviation.
3. Results
3.1. Establishment of T2DM Rat Model
After injecting STZ for 72 h, the average concentrations of blood glucose of the rats in groups 2 to 5 all reached 16.7 mmol/L. Then, the levels of blood glucose were stably maintained for one week. The blood glucose and serum insulin concentrations of the rats are shown in Table 2. Compared with group 1, the blood glucose and serum insulin concentrations of the rats in the other four groups were significantly higher, which indicated that the rats suffered T2DM induced by STZ. In addition, the apathetic state and behaviors of polyuria and polydipsia appeared in the rats of groups 2 to 5. Therefore, the T2DM rat model was successfully established.
Table 2.
The blood glucose and serum insulin concentrations of the rats after the blood glucose levels were stably maintained for one week.
| Group | CN | T2DM | CrPic groups | ||
|---|---|---|---|---|---|
| (25 μg/kg) | (50 μg/kg) | (100 μg/kg) | |||
| Blood glucose (mmol/L) | 4.63 ± 1.02 | 16.81 ± 3.65∗ | 17.52 ± 2.76∗ | 17.91 ± 2.89∗ | 18.03 ± 1.15∗ |
| Serum insulin (mIU/L) | 16.88 ± 0.83 | 11.51 ± 1.07∗ | 10.75 ± 1.23∗ | 9.98 ± 1.03∗ | 11.96 ± 0.74∗ |
CN: the normal control group, group 1; T2DM: T2DM (type II diabetes mellitus) control group, group 2; CrPic groups: group 3 (25 μg/kg), group 4 (50 μg/kg), and group 5 (100 μg/kg); and *compared with group 1, P < 0.01.
3.2. Effects of Chromium Picolinate on Histopathology of Pancreas
The pancreatic sections stained with HE are shown in Figure 1. It showed that the rats in group 1 had normal pancreatic endocrine and exocrine architecture, acinar cells, and pancreatic islets. Moreover, there was no edema or inflammatory cells infiltration (Figure 1(a)). However, administration of STZ caused necrotic changes (karyolysis and disappearance of nucleus) of pancreatic islets, degeneration of acinar cells, and inflammatory cells infiltration in STZ-induced T2DM rats (Figure 1(b): group 2). After CrPic treatment, some improvements on the morphology of pancreas were observed. In the rats supplemented with 50 μg/kg (Figure 1(d): group 4) and 100 μg/kg CrPic (Figure 1(e): group 5), there was completed pancreatic cells structure and no inflammatory cell infiltration was observed. In the rats supplemented with 25 μg/kg CrPic (Figure 1(c): group 3), the improvement on the morphology of pancreas was not significant compared with the rats supplemented with 50 μg/kg and 100 μg/kg CrPic.
Figure 1.
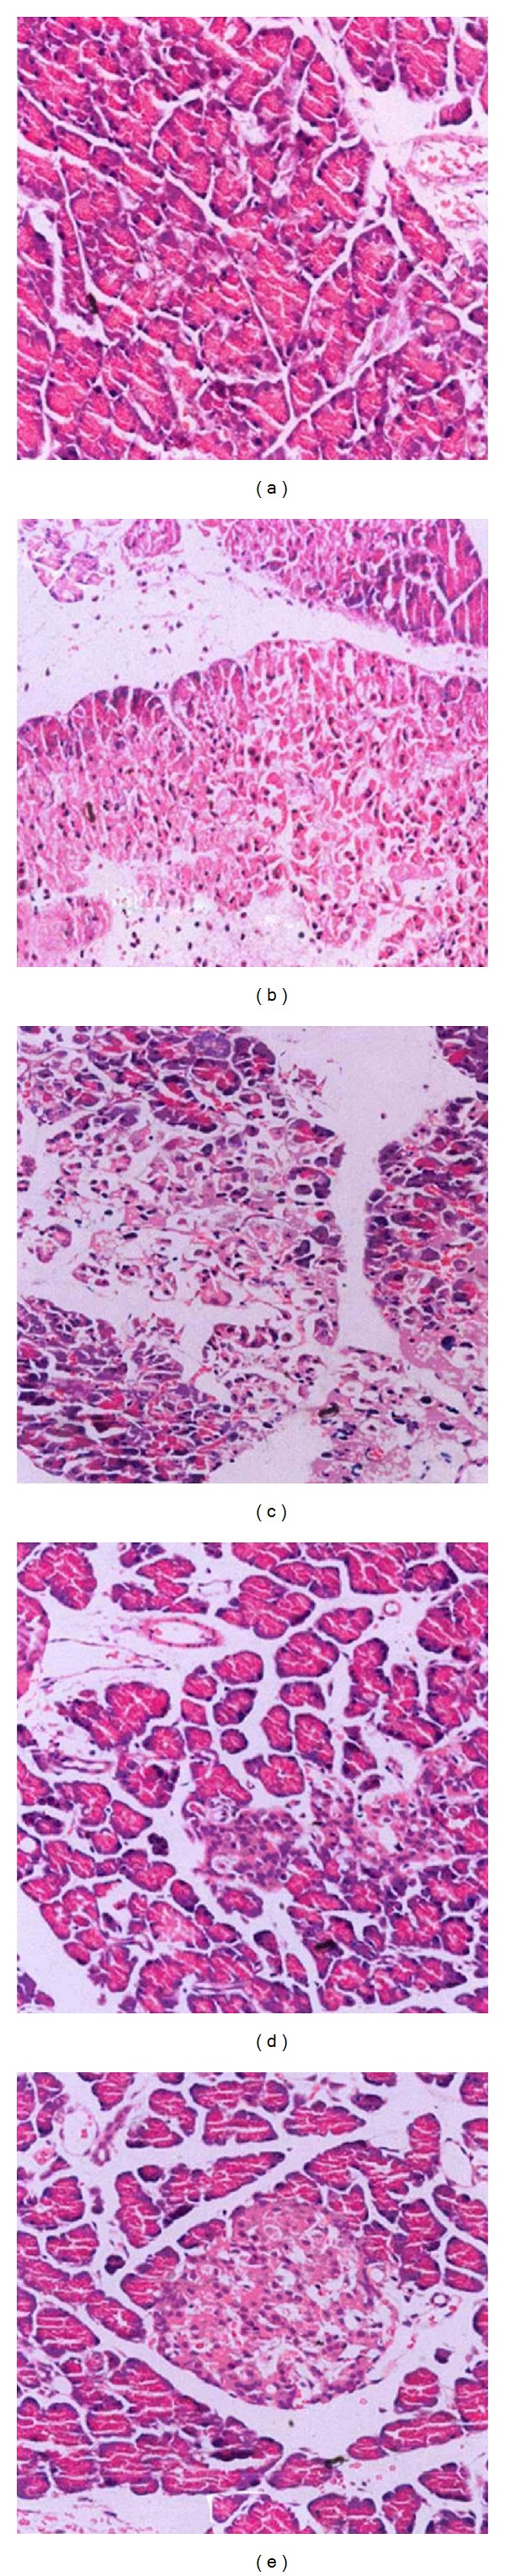
The HE staining of pancreas (HE 400x) in five groups. (a) Group 1, normal control group; (b) group 2, T2DM (type II diabetes mellitus) control group; (c) group 3, 25 μg/kg CrPic group; (d) group 4, 50 μg/kg CrPic group; and (e) group 5, 100 μg/kg CrPic group.
3.3. Effects of Chromium Picolinate on Serum Markers
Compared with group 1, NO and insulin level of the rats in group 2 were significantly decreased (P < 0.01). After CrPic treatment, the NO and insulin levels of the rats in groups 4 (P < 0.05) and 5 (P < 0.01) were significantly increased compared with group 2. The NO and insulin level of the rats in group 3 were also higher than those in group 2, but the statistical difference was not significant. The dose dependent effect was observed in the effect of CrPic on NO and insulin level of STZ-induced T2DM rats which were raised with the increase of the dose of CrPic. The NO and insulin level of the rats in group 5 were very close to group 1 (Figures 2(a) and 2(b)).
Figure 2.
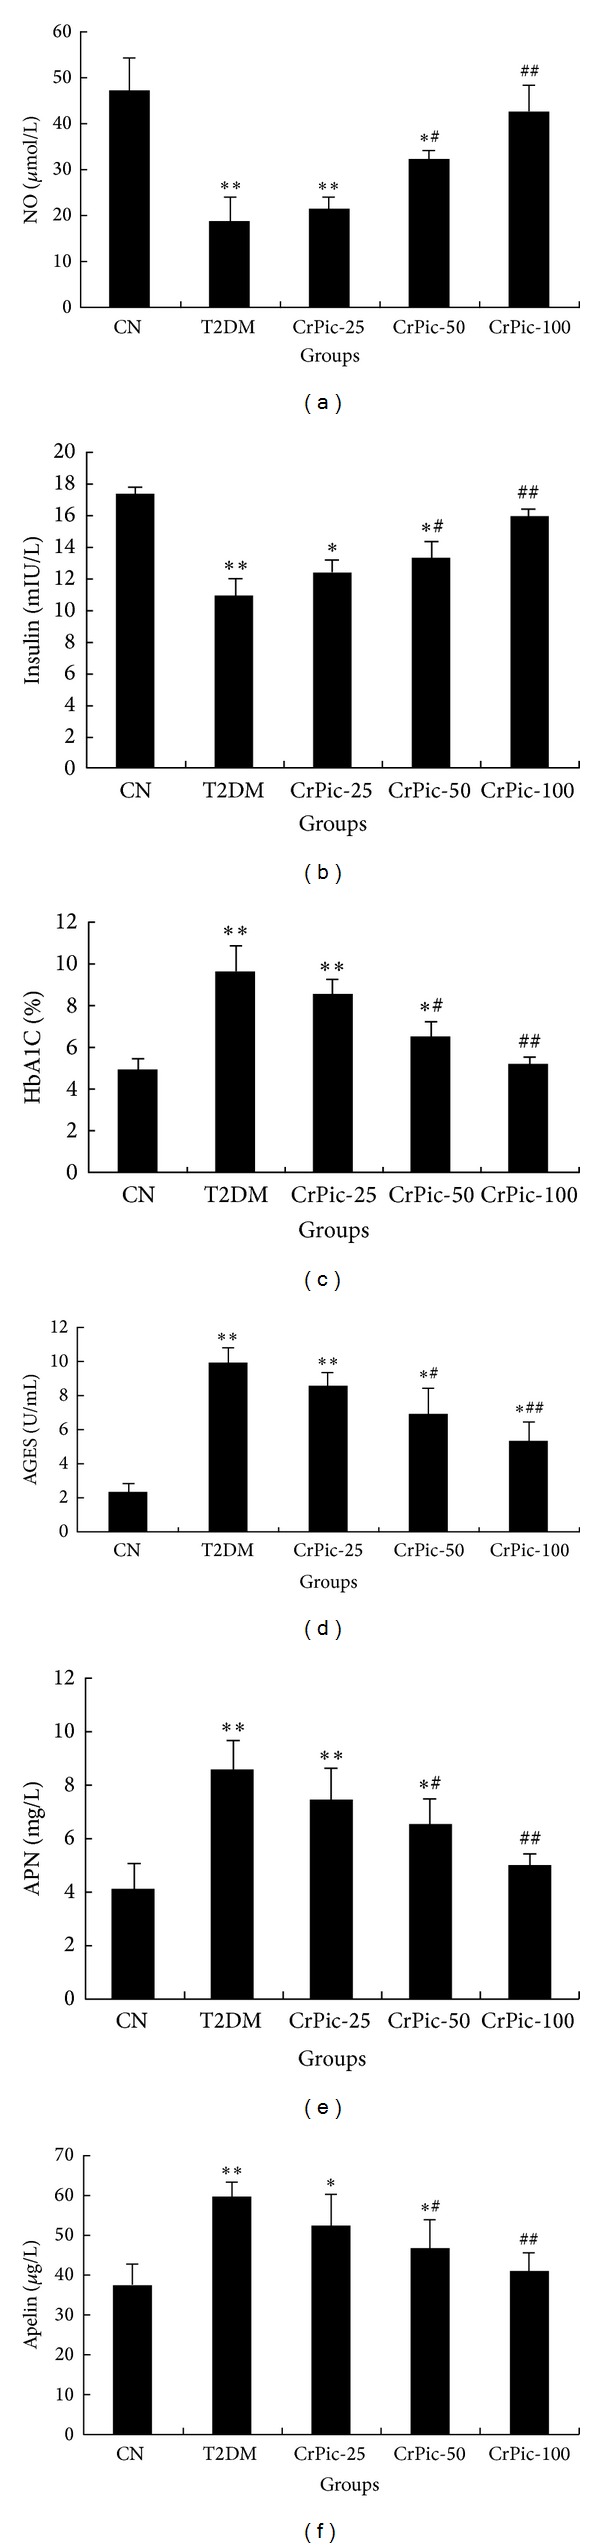
The effect of CrPic on the levels of serum NO (a), insulin (b), HbA1C (c), AGES (d), APN (e), and apelin (f). CN: the normal control group, group 1; T2DM: T2DM (type II diabetes mellitus) control group, group 2; CrPic-25: group 3 (25 μg/kg); CrPic-50: group 4 (50 μg/kg); and CrPic-100: group 5 (100 μg/kg). ∗∗ P < 0.01 compared with group 1; ∗ P < 0.05 compared with group 1; ## P < 0.01 compared with group 2; and # P < 0.05 compared with group 2.
According to Figures 2(c), 2(d), 2(e), and 2(f), the levels of HbA1C, AGES, APN, and apelin of rats in group 2 were significantly higher than those in group 1 (P < 0.01). After CrPic treatment, the levels of HbA1C, AGES, APN, and apelin of the rats in groups 4 (P < 0.05) and 5 (P < 0.01) were significantly reduced compared with group 2. The dose dependent effect was also observed in the effect of CrPic on levels of HbA1C, AGES, APN, and apelin of STZ-induced T2DM rats which were reduced with the decrease of the dose of CrPic. The decrease of the levels of HbA1C, AGES, APN, and apelin of the rats in group 3 was not significant compared with group 2. The levels of HbA1C, AGES, APN, and apelin level of the rats in group 5 were almost close to group 1.
3.4. Effects of Chromium Picolinate on the mRNA Expression of APN and Apelin
The mRNA expression levels of APN and apelin were significantly higher in group 2 than those in group 1 (P < 0.05). After CrPic treatment, the mRNA expression levels of APN and apelin of the rats in groups 3 (P < 0.05), 4 (P < 0.01), and 5 (P < 0.01) were significantly decreased compared with group 2 (Figure 3).
Figure 3.
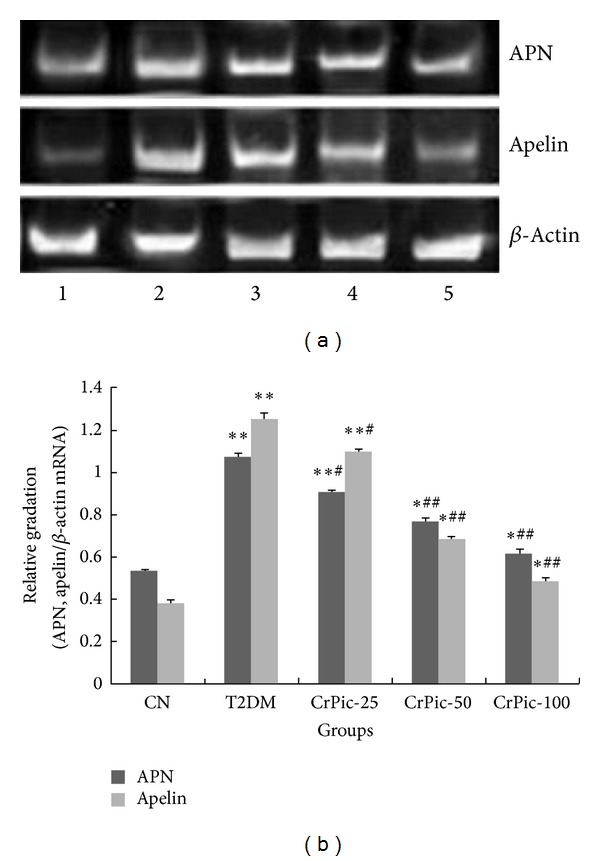
The mRNA expression levels of APN and apelin in each group. (a) Agarose gel electrophoresis of RT-PCR products. (b) The histogram of relative mRNA expression levels of APN and apelin compared with β -actin. CN: the normal control group, group 1; T2DM: T2DM (type II diabetes mellitus) control group, group 2; CrPic-25: group 3 (25 μg/kg); CrPic-50: group 4 (50 μg/kg); and CrPic-100: group 5 (100 μg/kg). ∗∗ P < 0.01 compared with group 1; ∗ P < 0.05 compared with group 1; ## P < 0.01 compared with group 2; and # P < 0.05 compared with group 2.
3.5. The Weight Change and Food Intake of the Rats
The weight change and food intake of the rats in each group during the whole experiment are shown in Table 3. Compared with group 1, the weight changes of the rats in the other four groups were significantly less while the food intake was significantly more. After the administration of CrPic, the weight changes and food intake of the STZ-induced T2DM rats in groups 3 to 5 were gradually close to group 1 with the increase of the dose of CrPic.
Table 3.
The weight change and food intake of the rats in each group during the whole experiment.
| Group | CN | T2DM | CrPic groups | ||
|---|---|---|---|---|---|
| (25 μg/kg) | (50 μg/kg) | (100 μg/kg) | |||
| Weight change (g/week) |
397.80 ± 21.74 | 349.551 ± 13.25∗ | 357.32 ± 12.93∗ | 357.11 ± 14.50∗ | 360.03 ± 21.01∗ |
| Food intake (g/day) | 16 ± 3 | 42 ± 7∗ | 37 ± 5∗ | 29 ± 4∗ | 27 ± 7∗ |
CN: the normal control group, group 1; T2DM: T2DM (type II diabetes mellitus) control group, group 2; CrPic groups: group 3 (25 μg/kg), group 4 (50 μg/kg), and group 5 (100 μg/kg); and *compared with group 1, P < 0.01.
4. Discussion
T2DM is a metabolism syndrome with multifactors and involved multiorgans, which is characterized by chronic high blood glucose. Macroangiopathy was usually seen as the complication in the patients with diabetes. The macroangiopathy is one of the main reasons of death and disability [23, 24]. In addition, the pathogenesis of T2DM was very complicated and associated with insulin resistance and secretion deficiency [25, 26], inflammatory reaction [27], and oxidative stress [28]. Therefore, it is critical to find the suitable therapy of treating T2DM and macroangiopathy based on the pathogenesis of T2DM.
CrPic is organic chromium compound with small molecular weight and low toxicity. It is promising in therapy application because it can increase the activity of insulin and slow down the development of diabetes mellitus [29]. In the present study, the T2DM model was induced by STZ; STZ liberates toxic amounts of nitric oxide that inhibits aconitase activity and participates in DNA damage [30]. As a result of the STZ action, β-cells undergo destruction by necrosis. After CrPic supplement, the inflammatory cells infiltration was reduced or appeared and the function of β-cells was recovered.
For the levels of serum markers of T2DM, the results provided evidence for the ability of CrPic in regulating the levels of NO, insulin, HbA1C, AGES, APN, and apelin. T2DM frequently results from progressive failure of pancreatic β-cell function in the presence of chronic insulin resistance [31]. Some previous studies have reported that CrPic supplementation could increase insulin sensitivity in subjects with type 2 diabetes [22, 32, 33]. The secretion of insulin comes from β-cell. Therefore, we speculated that the level of insulin was raised after CrPic treatment due to the increase of insulin sensitivity in T2DM rats and the improvement of β-cell function. In addition, HbA1C, as another indicator of diabetes, is the product of hemoglobin and glucose in the red blood cells and it can be used as the reference standard of average blood glucose level. Previous study showed that 1% decrease of the HbA1C resulted in 21% decrease in diabetes related end-point event, and the risk of the diabetes related death and myocardial infarct will decrease 21% and 14%, respectively [34]. After reconfiguration, the HbA1C can transform into AGES, so it is positively related to AGES. Then AGES can interact with its receptor and multiple cytokines and growth factors will be produced. Some articles reported that AGES could lead to vascular hyperplasia and accelerate the atherosclerosis [35, 36]. Furthermore, the increase of AGES level can result in decreasing level of NO. Serum NO is one of the inflammatory cytokines. Some clinical and epidemiological studies suggest that some processes related to low-grade inflammation may be relevant to diabetic micro- and macroangiopathy [37, 38]. Thus, the macroangiopathy was associated with the levels of serum NO. In this study, the decrease of NO level in STZ-induced T2DM rats might cause the change of angiotasis and then the macroangiopathy happened. The efficacy of CrPic on treating macroangiopathy was proved by the increase of serum NO level after CrPic treatment. Moreover, the changes of these markers were all dose dependent. In summary, CrPic may affect macroangiopathy in T2DM by increasing the NO level and decreasing the HbA1C and AGES level.
APN and apelin are the cytokines secreted by adipocytes. It was reported that the increase of the APN was observed in the patients with coronary artery disease and early atherosclerosis [39, 40]. In this study, the STZ injection with HFD will induce the mRNA expression of APN and apelin; it indicated that the macroangiopathy might occur with the T2DM. With the treatment of CrPic, the expression of the two genes was recovered back to normal level. These results indicated that the effect of CrPic on macroangiopathy in T2DM may be associated with the regulation of the lipid metabolism.
Furthermore, the weight change and food intake were also improved after CrPic treatment. The weight gain of rats was attenuated by STZ administration. It may be caused by the decrease of insulin. The dysregulation of insulin on blood glucose may affect the conversion of glucose and lipid metabolism [41]. Thus, the weight gain was decreased after STZ administration. Then, the weight gain was recovered to normal with the CrPic treatment. Based on the results of this study, the food intake was decreased after CrPic supplement. Thus, we inferred that the mechanism of the changes of weight gain in T2DM rats might be related to the effect of CrPic on the serum and fat markers such as NO, insulin, HbA1C, AGES, APN, and apelin.
5. Conclusion
In conclusion, CrPic can recover the function of β-cells and alleviate macroangiopathy in STZ-induced T2DM rats. Further studies were required to verify the results of this study.
Acknowledgments
This paper was supported by Changning District Diabetes Special Disease-Funded Project (2010301001) and Shanghai Municipal Health Bureau Project (20124248).
Conflict of Interests
The authors declare that there is no conflict of interests regarding the publication of this paper.
References
- 1.Hjelmesaeth J, Hartmann A, Leivestad T, et al. The impact of early-diagnosed new-onset post-transplantation diabetes mellitus on survival and major cardiac events. Kidney International. 2006;69(3):588–595. doi: 10.1038/sj.ki.5000116. [DOI] [PubMed] [Google Scholar]
- 2.Choi YM, Ilankumaran P, Kim HW, et al. Chroman carboxylic acid derivatives for the treatment of diabetes and lipid disorders. Google Patents, 2008.
- 3.Nöthlings U, Boeing H, Maskarinec G, et al. Food intake of individuals with and without diabetes across different countries and ethnic groups. European Journal of Clinical Nutrition. 2011;65(5):635–641. doi: 10.1038/ejcn.2011.11. [DOI] [PMC free article] [PubMed] [Google Scholar]
- 4.Ritz E, Orth SR. Nephropathy in patients with type 2 diabetes mellitus. The New England Journal of Medicine. 1999;341(15):1127–1133. doi: 10.1056/NEJM199910073411506. [DOI] [PubMed] [Google Scholar]
- 5.Krugner-Higby L, Shadoan M, Carlson C, et al. Type 2 diabetes mellitus, hyperlipidemia, and extremity lesions in California mice (Peromyscus californicus) fed commercial mouse diets. Comparative Medicine. 2000;50(4):412–418. [PubMed] [Google Scholar]
- 6.Yamamoto M, Egusa G, Okubo M, Yamakido M. Dissociation of microangiopathy and macroangiopathy in patients with type 2 diabetes. Diabetes Care. 1998;21(9):1451–1454. doi: 10.2337/diacare.21.9.1451. [DOI] [PubMed] [Google Scholar]
- 7.Tsukada K, Sekizuka E, Oshio C, Minamitani H. Direct measurement of erythrocyte deformability in diabetes mellitus with a transparent microchannel capillary model and high-speed video camera system. Microvascular Research. 2001;61(3):231–239. doi: 10.1006/mvre.2001.2307. [DOI] [PubMed] [Google Scholar]
- 8.Harris SB, Ekoé J, Zdanowicz Y, Webster-Bogaert S. Glycemic control and morbidity in the Canadian primary care setting (results of the diabetes in Canada evaluation study) Diabetes Research and Clinical Practice. 2005;70(1):90–97. doi: 10.1016/j.diabres.2005.03.024. [DOI] [PubMed] [Google Scholar]
- 9.Strojek K. Features of macrovascular complications in type 2 diabetic patients. Acta Diabetologica. 2003;40(2):S334–S337. doi: 10.1007/s00592-003-0115-x. [DOI] [PubMed] [Google Scholar]
- 10.Anderson RA, Cheng N, Bryden NA, et al. Elevated intakes of supplemental chromium improve glucose and insulin variables in individuals with type 2 diabetes. Diabetes. 1997;46(11):1786–1791. doi: 10.2337/diab.46.11.1786. [DOI] [PubMed] [Google Scholar]
- 11.Zhao Q, Hu X, Guo Q, et al. Physicochemical properties and regulatory effects on db/db diabetic mice of β-glucans extracted from oat, wheat and barley. Food Hydrocoll. 2014;37:60–68. [Google Scholar]
- 12.Sumrall KH, Vincent JB. Is glucose tolerance factor an artifact produced by acid hydrolysis of low-molecular-weight chromium-binding substance? Polyhedron. 1997;16(23):4171–4177. [Google Scholar]
- 13.Sreejayan N, Dong F, Kandadi MR, Yang X, Ren J. Chromium alleviates glucose intolerance, insulin resistance, and hepatic ER stress in obese mice. Obesity. 2008;16(6):1331–1337. doi: 10.1038/oby.2008.217. [DOI] [PubMed] [Google Scholar]
- 14.Toghyani M, Toghyani M, Shivazad M, Gheisari A, Bahadoran R. Chromium supplementation can alleviate the negative effects of heat stress on growth performance, carcass traits, and meat lipid oxidation of broiler chicks without any adverse impacts on blood constituents. Biological Trace Element Research. 2012;146(2):171–180. doi: 10.1007/s12011-011-9234-3. [DOI] [PubMed] [Google Scholar]
- 15.Davis CM, Vincent JB. Chromium in carbohydrate and lipid metabolism. Journal of Biological Inorganic Chemistry. 1997;2(6):675–679. [Google Scholar]
- 16.Tsapakos MJ, Wetterhahn KE. The interaction of chromium with nucleic acids. Chemico-Biological Interactions. 1983;46(2):265–277. doi: 10.1016/0009-2797(83)90034-0. [DOI] [PubMed] [Google Scholar]
- 17.Mikalsen A, Alexander J, Wallin H, Ingelman-Sundberg M, Andersen RA. Reductive metabolism and protein binding of chromium(VI) by P450 protein enzymes. Carcinogenesis. 1991;12(5):825–831. doi: 10.1093/carcin/12.5.825. [DOI] [PubMed] [Google Scholar]
- 18.Lukaski HC. Chromium as a supplement. Annual Review of Nutrition. 1999;19:279–302. doi: 10.1146/annurev.nutr.19.1.279. [DOI] [PubMed] [Google Scholar]
- 19.Ryan GJ, Wanko NS, Redman AR, Cook CB. Chromium as adjunctive treatment for type 2 diabetes. Annals of Pharmacotherapy. 2003;37(6):876–885. doi: 10.1345/aph.1C304. [DOI] [PubMed] [Google Scholar]
- 20.Wang M-Q, Li H, He Y-D, Wang C, Tao W, Du Y. Efficacy of dietary chromium (III) supplementation on tissue chromium deposition in finishing pigs. Biological Trace Element Research. 2012;148(3):316–321. doi: 10.1007/s12011-012-9369-x. [DOI] [PubMed] [Google Scholar]
- 21.Cefalu WT, Rood J, Pinsonat P, et al. Characterization of the metabolic and physiologic response to chromium supplementation in subjects with type 2 diabetes mellitus. Metabolism: Clinical and Experimental. 2010;59(5):755–762. doi: 10.1016/j.metabol.2009.09.023. [DOI] [PMC free article] [PubMed] [Google Scholar]
- 22.Martin J, Wang ZQ, Zhang XH, et al. Chromium picolinate supplementation attenuates body weight gain and increases insulin sensitivity in subjects with type 2 diabetes. Diabetes Care. 2006;29(8):1826–1832. doi: 10.2337/dc06-0254. [DOI] [PubMed] [Google Scholar]
- 23.Dronavalli S, Duka I, Bakris GL. The pathogenesis of diabetic nephropathy. Nature Clinical Practice Endocrinology & Metabolism. 2008;4(8):444–452. doi: 10.1038/ncpendmet0894. [DOI] [PubMed] [Google Scholar]
- 24.Hermans MP, Ahn SA, Rousseau MF. The multi-faceted outcomes of conjunct diabetes and cardiovascular familial history in type 2 diabetes. Journal of Diabetes and its Complications. 2012;26(3):187–194. doi: 10.1016/j.jdiacomp.2012.03.014. [DOI] [PubMed] [Google Scholar]
- 25.Nylander E, Svartholm S. Self care activities of patients with Diabetes Mellitus Type 2 in Ho Chi Minh City. 2010.
- 26.Wild S, Roglic G, Green A, Sicree R, King H. Global prevalence of diabetes: estimates for the year 2000 and projections for 2030. Diabetes Care. 2004;27(5):1047–1053. doi: 10.2337/diacare.27.5.1047. [DOI] [PubMed] [Google Scholar]
- 27.Fujita T, Hemmi S, Kajiwara M, et al. Complement-mediated chronic inflammation is associated with diabetic microvascular complication. Diabetes/Metabolism Research and Reviews. 2013;29(3):220–226. doi: 10.1002/dmrr.2380. [DOI] [PubMed] [Google Scholar]
- 28.Roesen P, Ferber P, Tschoepe D. Macrovascular disease in diabetes: current status. Experimental and Clinical Endocrinology and Diabetes. 2001;109(supplement 2):S474–S486. doi: 10.1055/s-2001-18603. [DOI] [PubMed] [Google Scholar]
- 29.Sahin K, Tuzcu M, Orhan C, et al. Anti-diabetic activity of chromium picolinate and biotin in rats with type 2 diabetes induced by high-fat diet and streptozotocin. British Journal of Nutrition. 2013;110(2):197–205. doi: 10.1017/S0007114512004850. [DOI] [PubMed] [Google Scholar]
- 30.Szkudelski T. The mechanism of alloxan and streptozotocin action in B cells of the rat pancreas. Physiological Research. 2001;50(6):537–546. [PubMed] [Google Scholar]
- 31.Buchanan TA, Xiang AH, Peters RK, et al. Preservation of pancreatic β-cell function and prevention of type 2 diabetes by pharmacological treatment of insulin resistance in high-risk Hispanic women. Diabetes. 2002;51(9):2796–2803. doi: 10.2337/diabetes.51.9.2796. [DOI] [PubMed] [Google Scholar]
- 32.Kim D-S, Kim T-W, Kang J-S. Chromium picolinate supplementation improves insulin sensitivity in Goto-Kakizaki diabetic rats. Journal of Trace Elements in Medicine and Biology. 2004;17(4):243–247. doi: 10.1016/S0946-672X(04)80025-7. [DOI] [PubMed] [Google Scholar]
- 33.Kim D-S, Kim T-W, Park I-K, Kang J-S, Om A-S. Effects of chromium picolinate supplementation on insulin sensitivity, serum lipids, and body weight in dexamethasone-treated rats. Metabolism: Clinical and Experimental. 2002;51(5):589–594. doi: 10.1053/meta.2002.31985. [DOI] [PubMed] [Google Scholar]
- 34.Stratton IM, Adler AI, Neil HAW, et al. Association of glycaemia with macrovascular and microvascular complications of type 2 diabetes (UKPDS 35): prospective observational study. British Medical Journal. 2000;321(7258):405–412. doi: 10.1136/bmj.321.7258.405. [DOI] [PMC free article] [PubMed] [Google Scholar]
- 35.Del Turco S, Basta G. An update on advanced glycation endproducts and atherosclerosis. BioFactors. 2012;38(4):266–274. doi: 10.1002/biof.1018. [DOI] [PubMed] [Google Scholar]
- 36.Nam J, Fettiplace R. Optimal electrical properties of outer hair cells ensure cochlear amplification. PLoS ONE. 2012;7(11) doi: 10.1371/journal.pone.0050572.e50572 [DOI] [PMC free article] [PubMed] [Google Scholar]
- 37.Jakuš V, Sándorová E, Kalninová J, Krahulec B. Monitoring of glycation, oxidative stress and inflammation in relation to the occurrence of vascular complications in patients with type 2 diabetes mellitus. Physiological Research. 2014 doi: 10.33549/physiolres.932672. [DOI] [PubMed] [Google Scholar]
- 38.Zozuliñska D, Wierusz-Wysocka B. Hyperglycaemia and inflammation are culpritis of late diabetic complications. Archives of Medical Science. 2005;1:115–118. [Google Scholar]
- 39.Hirata A, Kishida K, Nakatsuji H, Kobayashi H, Funahashi T, Shimomura I. High serum C1q-adiponectin/total adiponectin ratio correlates with coronary artery disease in Japanese type 2 diabetics. Metabolism: Clinical and Experimental. 2013;62(4):578–585. doi: 10.1016/j.metabol.2012.10.011. [DOI] [PubMed] [Google Scholar]
- 40.Xiao Y, Yao L, Li X, et al. Relationship of adipocyte fatty acid-binding protein to adiponectin ratio with femoral intima-media thickness and endothelium-dependent vasodilation in patients with newly-diagnosed type 2 diabetes mellitus. Zhonghua Yi Xue Za Zhi. 2010;90(4):231–235. [PubMed] [Google Scholar]
- 41.Saltiel AR, Kahn CR. Insulin signalling and the regulation of glucose and lipid metabolism. Nature. 2001;414(6865):799–806. doi: 10.1038/414799a. [DOI] [PubMed] [Google Scholar]