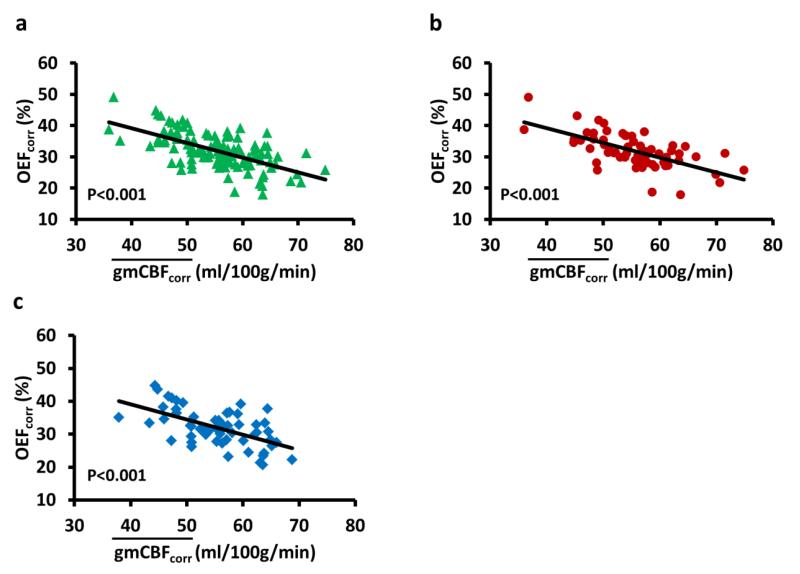
Figure 6.
The relationship between and OEF for (a) all subjects, (b) female subjects, and (c) male subjects. A strong correlation is observed in all three plots, suggesting that an individual with a higher tends to have a lower OEF (i.e. higher Yv), thus simultaneous measurement of and OEF may allow a reduction in data variation. Again, the values used in these analyses have factored out the age and sex effects, by using the age/sex regression equation. Thus, they examine the residual variance across subjects.

