

Abstract
Neuropsychiatric disorders are notoriously heterogeneous in their presentation, which precludes straightforward and objective description of the differences between affected and typical populations that therefore makes finding reliable biomarkers a challenge. This difficulty underlines the need for reliable methods to capture sample characteristics of heterogeneity using a single continuous measure, incorporating the multitude of scores used to describe different aspects of functioning. This study addresses this challenge by proposing a general method of identifying and quantifying the heterogeneity of any clinical population using a severity measure called the PUNCH (Population Characterization of Heterogeneity). PUNCH is a decision level fusion technique to incorporate decisions of various phenotypic scores, while providing interpretable weights for scores. We provide an application of our framework to a simulated dataset and to a large sample of youth with Autism Spectrum Disorder (ASD). Next we stratify PUNCH scores in our ASD sample and show how severity moderates findings of group differences in diffusion weighted brain imaging data; more severely affected subgroups of ASD show expanded differences compared to age and gender matched healthy controls. Results demonstrate the ability of our measure in quantifying the underlying heterogeneity of the clinical samples, and suggest its utility in providing researchers with reliable severity assessments incorporating population heterogeneity.
Keywords: Heterogeneity, Autism Spectrum Disorders, Severity measure
1. Introduction
Quantitative characterization of population heterogeneity is an area of critical importance, especially for studies of disorders spanning a wide spectrum in terms of pathobiology and clinical phenomenology (Jeste & Geschwind, 2014; Klin et al., 2005; Lenroot & Yeung, 2013; Levy et al., 2009; Veatch et al., 2014). Neurobehavioral disorders, such as autism spectrum disorder, are defined by difficulties in a number of discrete areas (e.g., social functioning, communication) that are, in principle, amendable to description along different severity dimensions. In fact, the National Institute of Mental Health (NIMH) has initiated a new funding mechanism to encourage researchers to move away from trying to map genetics and neurobiology onto diagnostic symptom descriptors and to instead focus on dimensions of behavior and functional dimensions grounded in neuroscience (Cuthbert & Insel, 2013; Cuthbert, 2014; Insel et al., 2010; Morris & Cuthbert, 2012). Severity measures, the focus of this research, fits well within this new “Research Domain Criteria” (RDoC) approach by the NIMH, and should prove valuable in describing individual differences and correlating those with brain imaging data. However, finding reliable biomarkers to identify attributes of heterogeneous clinical populations is challenging because the boundaries between individuals with pathology (IPs) and typically developing controls (TDCs) is blurred with significant overlap for any given phenotypic feature (Geschwind, 2009; Levy et al., 2009). It is important to be able to aggregate phenotypic information into severity dimensions that allow better separation between groups and validation through independent measure of neurobiology (i.e., biomarkers). This process also improves the quality of the phenotypic information, creating a more reliable dimension capable of portraying clinical heterogeneity by the spread of the phenotypic measures under consideration. The aim of this study is to analyze the performance of a continuous severity measure, which is obtained by combining various phenotypic scores, and to validate it by an assessment of independent brain imaging data aimed at showing group differences. A clearly defined fusion methodology can help researchers with elaborating the effects of different measures on the final severity assessment, related to the disorder being studied.
In this paper, we propose a method for quantifying biologically-based heterogeneity by means of a severity measure that we call the Population Characterization of Heterogeneity (PUNCH) score. PUNCH is explicitly designed to derive a severity distribution over IPs that can be used for sub-grouping the sample by defining several thresholds over the resulting distribution, in order to facilitate subsequent statistical analyses. The interpretability and generalizability of the measure makes it applicable to any disorder.
To design PUNCH, we exploit the fact that each standardized score collected to describe the behavioral phenotype provides an explicit ranking, and therefore a preliminary severity measure by itself. One requirement is to normalize these individual measures to a common metric so that they can be compared and combined as needed. As a decision level fusion technique, PUNCH deals with the individual decision of each score. By this process, we can alleviate difficulties with combining scores that have distributions with different magnitudes, ranges, and shapes. Additionally, we define weights over decisions of scores, summarizing the contributions of individual scores. Lastly, PUNCH does not require any recalculation when new scores are introduced, or existing scores are removed.
In the literature of machine learning, the heterogeneity of a population is usually characterized by unsupervised learning methods such as clustering (finite mixture models or latent class analysis) and factor analysis models (Alpaydin, 2010). Both try to find latent organization of data, either by explicit groupings as in clustering or by thresholding some latent variables as in factor analysis. The main difference between these approaches can be identified as the assumed source of the heterogeneity in the sample (Lubke & Muthen, 2005). In clustering, the source is an observed variable (or several variables) that causes separation between subgroups such as age, gender, or some phenotypic scores. On the other hand, from the perspective of factor analysis, the heterogeneity in the sample is caused by some unobserved, latent variables. As a more sophisticated choice, factor mixture models (FMM) (Lazarsfeld & Neil, 1968; Muthen & Shedden, 1999) can be employed as they combine clustering and factor analysis models.
Factor analysis models are popular choices to study the inter-relationship of items of questionnaires and measures that are used to quantify effects of disorders e.g. eliminating items that don’t load with the rest of the items, or designing subscales that are embedded within the overall test. Factor analysis of clinical samples has been also studied to validate commonly used scoring criteria such as ADI-R scoring for Autism Spectrum Disorder (ASD) samples (Boomsma et al., 2008; Snow et al., 2009). In (Frazier et al., 2012; Georgiades et al., 2012; Lubke & Muthen, 2005), FMM models were used to characterize the heterogeneity of the clinical samples. These studies combined different phenotypic scores and described heterogeneity with clustering based inferences.
The main drawback of such techniques is the difficulty in interpreting the derived clusters or latent traits. For instance, clusters based on the whole sample are characterized by multiple features and may include a mixture of TDCs and IPs. While these techniques can also be applied to TDCs and IPs separately, in this case, they neither quantify the heterogeneity of the sample nor provide a continuous severity measure over it. In any case, it is difficult to use clustering to create groups that will facilitate analysis of other modalities, or characterize the sample overlap precisely.
The framework we propose provides a method of combining different phenotypic scores to obtain a common quantitative metric that characterizes each study participant along a linear measure. Various scores characterizing totally different aspects of the disorder can be fused at the decision level, using a probabilistic voting scheme. Different multimodality fusion techniques have been proposed in the medical imaging domain (Sui, Adali, et al., 2012; Sui, Yu, et al., 2012), but none of them provides a probabilistic quantification of the heterogeneity.
Although previous studies have used threshold based clustering of single scores to obtain sample subgroupings (Gotham et al., 2009), this is challenging if there are multiple scores producing different groupings. Moreover, any single clinical tool will always pose limitations in reliability and robustness and in its ability to sample the full range of information, relevant to the manifestation of the disorder. PUNCH overcomes these problems by combining attributes across an unlimited number of primary data sources, thus smoothing measurement error and accentuating the available information within individual phenotypic measures. To our knowledge, this is the first study in the literature to characterize the underlying heterogeneity of clinical samples in a fully probabilistic and quantitative way.
We demonstrate the usage of PUNCH on a sample of adolescent with ASD, that has been assessed with dozens of clinical symptom inventories and cognitive tests. Many of these clinical evaluations contain redundant information, and all entail a degree of measurement error that will lead to overlapping as well as conflicting information. The resulting PUNCH distribution over such samples is Gaussian, which makes the clustering of individuals based on distribution statistics easy and tractable. The groupings of the population, determined by PUNCH, are used to study differences based on diffusion weighted imaging (DWI) data acquired on the same sample. The DWI data provides a type of external, biologically grounded validation, and is based on the assumption that brain based differences exist between TDCs and ASD but that group differences become obscured with the ASD sample having too many more mildly affected study participants (which can be common in study samples in the autism literature). The ability to capture imaging based differences based on a severity score, underlines the usefulness of PUNCH as a heterogeneity measure, especially in identifying imaging correlates of different scores. We therefore expect our contribution to be impactful and significant for spectrum disorders like ASD, where a standard for determining the severity is crucial to the understanding of these disorders.
We compare subgroupings of ASD using PUNCH to that of using the current standard in the field, the Social Responsive Scale (SRS) (Constantino et al., 2000), which focuses on the core diagnostic symptoms. Here, we aim to show that the combination of several independent measures that are rather ancillary to the core of ASD can provide a similar or even better ontological coverage of ASD domain with respect to what is provided by a single standard (SRS). We therefore expect PUNCH to reveal more affected areas in the brain when used to stratify samples in experiments with imaging data. Such an analysis is clearly helpful to investigate the contribution of such measures for the final clinical assessments with ASD samples.
2. Material and methods
Here we describe the method for creating PUNCH scores for a population. The main empirical substance of the study is a set of experiments establishing that heterogeneity of a clinical sample can be identified by using PUNCH. In addition to several simulated experiments, the proposed PUNCH score was calculated for a sample of youth with an ASD and used to analyze these for group differences.
2.1 Dataset
Our dataset includes 370 males with an ASD and 118 male TDCs described by 50 phenotypic scores collected as part of several overlapping studies designed to understand relationships between genes, brain and behavior in ASD. Participants with a community diagnosis of an ASD were recruited in part through autismMatch (https://autismmatch.org), and diagnoses were confirmed using diagnostic instruments (ADOS (Lord et al., 2000) and ADI-R (Lord et al., 1994)) and expert consensus clinical judgment by two independent psychologists following Collaborative Programs of Excellence in Autism (CPEA) diagnostic guidelines. Children with known genetic conditions associated with ASD were excluded from the study. Tests include performance based measures collected by a psychologist for each study participant, as well as parent rating forms designed to quantify behavioral features of ASD.
Each participant was described by 50 phenotypic scores i.e. selected diagnostic and neurobehavioral assessment instruments. Instruments used in this study are listed in Table 1. The final ASD sample had a mean age of 10.4 years (std=3.07, range=6 to 18 years). TDCs (mean age is 11.2 years with std=3.06, range=6 to 18 years) were recruited from the community and ASD symptomatology was screened using the Social Responsiveness Scale-Parent Report Version (SRS) (Constantino et al., 2000) and the Social Communication Questionnaire (Eaves et al., 2006). TDCs were also excluded if they reported having a first or second degree relative with an ASD diagnosis. All scores are age corrected and z-normalized. These scores were fused into a PUNCH score that provides a severity measure for this sample.
Table 1.
Names of phenotypic scores used in tests.
| Test Instrument | # Items | Variable Used in Analyses |
|---|---|---|
| Social Responsiveness Scale -Parent Report Version (Constantino et al., 2000) | 1 | Total (t) score |
| Differential Ability Scales, Second Edition (Elliott, 2007) | 5 | Global IQ (GCA) and constituent subscales: verbal ability, non verbal ability, spatial ability, special nonverbal composite |
| Behavior Rating Inventory of Executive Function (Gioia et al., 2000) | 10 | inhibit, shift, emot, behave, initiate, work, plan, org, monitor, metacog |
| Vineland Adaptive Behavior Scale: Parent/Caregiver Rating Form (Sparrow et al., 2007) | 3 | communication, daily living, socialization |
| ADHD Rating Scale-Parent Report Version (DuPaul et al., 1994) | 2 | inattention, hyper |
| Children Communication Checklist-2 (D. V. M. Bishop, 2003) | 10 | speech, syntax, semantic, coherence, initiation, scripted, context, nvcomm, social relations, interests |
| Screen for Child Anxiety Related Disorders-Revised (SCARED-R) (Birmaher B, Khetarpal S, Cully M, Brent D, 1995) | 5 | panic, anx, sep_anx, social_anx, school avoid |
| Children’s Sleep Habits Questionnaire (Owens et al., 2000) | 8 | bedtime_resis, sleep_onset, sleep_dur, sleep_anx, night_walk, parasomnia, sleep_dis_breath, day_sleepy |
| Broader Autism Phenotype Questionnaire (BAPQ) (Hurley et al., 2007) | 6 | bapqfa_aloof, bapqfa_rigid, bapqfa_prag, bapqmo_aloof, bapqmo_rigid, bapqmo_prag |
The heterogeneity characterization ability of PUNCH was tested on the subset of study participants who also had diffusion imaging data of the brain. DTI data was acquired on a Siemens 3T Verio™ scanner, using a 32 channel head coil and a single shot spin-echo, echo-planar sequence with the following parameters: TR/TE = 11000/76 ms, b-value of 1000 s/mm2, 30 gradient directions. The DTI data were spatially normalized to a standard WM atlas with 176 ROIs (Wakana et al., 2004). These ROIs were used to perform region based morphometry based on average Fractional Anisotropy (FA) values in the regions. 69 youth with ASD and 54 TDCs having DTI data were used for studying diffusion imaging based differences among different sub-groupings of the sample created using the PUNCH measure.
2.2. PUNCH Score
The proposed framework uses probabilistic voting (Alpaydin, 2010), to fuse individual decisions of different phenotypic scores. Here, we first elaborate the fusion model by defining the individual decisions of phenotypic scores. Computation of these individual decisions is described in Section 2.3. The weighting over these individual decisions is discussed in Section 2.4. Finally, we introduce a noise model in Section 2.5 to make the framework more robust to uncertainties caused by different sources of noise in scoring of individuals.
We start with the assumption that each individual can be characterized by a feature vector consisting of m different phenotypic scores, x ≡ (x1,…, xm). Here, a single feature, xj is a random variable related to jth phenotypic score. Again, each individual is provided with a binary diagnosis label y ∈ {0,1}. The severity of an individual is determined by a latent ranking function f which assigns a rank f(x) ∈ Y for each individual, where Y is a finite set of ordered severity categories. The fact that we do not have any ground truth ranks or categorical identifications, f(x) ∈ Y, for individuals, poses an obstacle while using a ranking approach for severity calculation. We therefore approximate the output of the ranking function f(x) by defining several thresholds over the probability p(y = 1 | x).
Each feature xj provides a preliminary measure of severity, called severity belief, by characterizing a distinct aspect of the pathology. We quantify this belief by a probability p(y = 1 | xj, sj), where the variable sj indicates that the decision model of jth score is used. Then, the Population Characterization of Heterogeneity (PUNCH) score is defined as
| (1) |
The probability p(sj) plays the role of the vote/weight in the voting scheme. With this formulation, the contribution of each feature to the final decision is clearly described. Moreover, it provides the flexibility of introducing new features or discarding existing ones by re-normalizing weights, without altering any individual severity belief.
As an alternative to fusion of individual decisions, multivariate classification techniques such as logistic regression, support vector machines (Alpaydin, 2010), or Gaussian process classification (Rasmussen & Williams, 2005) can be considered, each providing a probabilistic class membership measure that can be used to approximate latent ranking function. Nevertheless, rankings estimated by such measures comes with several limitations. Figure 1 demonstrates two problematic cases where illustrated problems are induce by the use of posterior class probability as the decision function. For two phenotypic scores from our dataset, distributions for TDC and IP samples are shown, along with final decision functions P(y = 1|x) (green curves), which are calculated through Bayes’ rule (i.e. P(y = 1|x) ∝ P(x|y = 1)P(y = 1)). In Figure 1.a, P(y = 1|x) is constantly 1 for all individuals having a score higher than 0 due to good separation between TDCs and IPs. A second limitation is shown in Figure 1.b, where P(y = 1|x) fluctuates due to variations in likelihoods P(x|y = 1) and P(x|y = 0). This behavior contradicts the linear decision model of clinical scores that requires monotonically increasing or decreasing ranking (i.e. the severity must increase monotonically as the clinical score increases/decreases). Such limitations can be addressed by using intermediate level measures as an estimate of ranking, instead of posterior probability. For instance, distance from optimal hyperplane in support vector classification has been shown to provide better rankings (Ecker, Marquand, et al., 2010; Ecker, Rocha-Rego, et al., 2010). Instead of using classification, outlier detection has also been considered in which the degree of being an outlier can be used as an estimate for ranking (Mourão-Miranda et al., 2011). PUNCH alleviates these limitations by defining a simple probit regression model over each phenotypic score.
Figure 1.
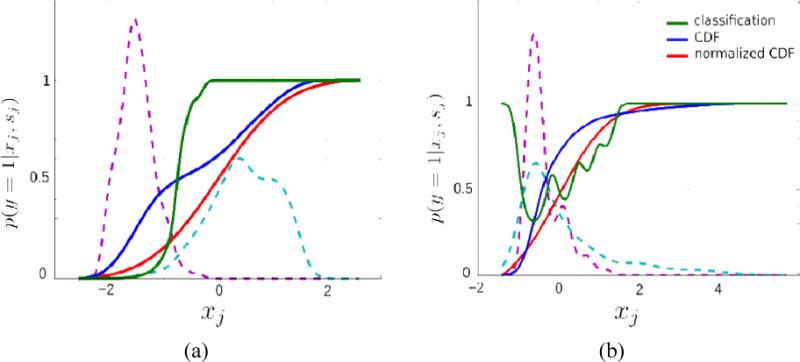
Three different decision functions for two phenotypic scores from our dataset. The dashed lines show distributions of score values for TDCs and IPs. Green curves show decision functions (posterior class probability) calculated by P(y = 1|x) ∝ P(x|y = 1)P(y = 1). Blue curves show cumulative distribution functions (CDF) of actual sample while red curves show the CDF response of the standard normal distribution over this sample.
2.3. Individual Severity Belief
In equation (1), the individual severity belief p(y = 1 | xj, sj) is the decision regarding the severity provided by the score sj. The derivation of such decisions can vary depending on the selected feature. As using posterior class probabilities to estimate p(y = 1 | xj,sj) has several issues, as explained in Section 2.2 (see also Figure 1), we use the cumulative distribution function (CDF) of the whole sample (without separating TDCs and IPs). The idea of using CDF as a feature-wise severity belief is based on the fact that the severity of an individual is proportional to the fraction of individuals having lower scores than the individual’s. Blue curves in Figure 1 show such CDFs. They are monotonically increasing and provide rankings for every pair of individuals.
One issue with using CDF for severity assessments is that the difference between sample sizes of TDCs and IPs becomes significant as we estimate the CDF empirically from the total sample. We therefore propose to use the CDF response of a standard normal distribution as in probit model (Long, 1997), to standardize the shape of the CDF of scores.
| (2) |
where Φ(xj) is the CDF response of the standard normal distribution, , with mean 0 and standard variation 1, and is defined as
| (3) |
The standardization of the shape of the CDF, while being helpful, cannot address issues introduced by sample size ratio between IPs and TDCs completely, which becomes significant especially during normalization of data. Thus, having a reliable ratio of group sizes seems to be a crucial requirement in practice.
2.4. Weights of Scores
In Equation 1, the probability p(sj) defines the weight of the severity belief of the score sj and plays a critical role in the final PUNCH score, p(y = 1 | x). The probit regression model as defined in Section 2.3 is an incomplete approach by itself, since each score provides a severity belief in the range 0 – 1, regardless of separation between TDCs and IPs. Here, we present a way of computing these probabilities, which defines the weights of the scores, in an objective and data-driven manner.
For each score sj, the best separation threshold is determined by minimizing the Type-1 and Type-2 errors (see Figure 2) i.e. finding the intersection point of the two distributions (TDCs and IPs). The weight of a score is inversely proportional to the total error (summation of Type-1 and Type-2), and we define the initial weight of a score sj as
| (4) |
where εj is the total classification error (in percentages) when using score sj alone. Then, the probability p(sj) is calculated by normalizing all weights so that the sum of all weights will add up to 1.
Figure 2.
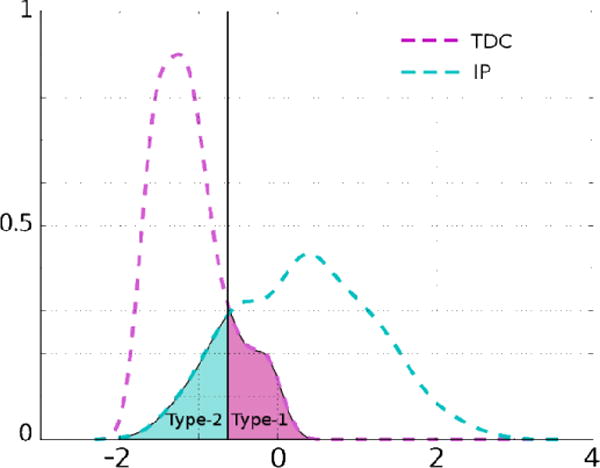
Type-1 and Type-2 errors of classification illustrated by shaded areas under the curves. The solid black line is the threshold for this score to get the best classification performance.
When the set of scores to be used for the computation of PUNCH is changed as a result of adding or deleting a score, the initial weights, wj, stay the same and we only need to re-normalize them. Such an approach provides an integration of classification and ranking; the final decision over severity is accomplished by blending rankings of individuals and the separation between TDCs and IPs.
2.5. Noise Model
All previous calculations performed in Sections 2.3 and 2.4 assume that the score set, x, is noise free and we can directly calculate p(y = 1 | x). Here, we introduce a noise model into the formulation to handle uncertainty. We assume an additive Gaussian noise model as
| (5) |
where is the true score that we do not observe, and x is the noisy score, that we observe. The score x is assumed to be z-normalized. The vector n is a collection of individual noise terms nj defined for each score sj separately, by Gaussians ; n ≡ (n1, n2,…, nm). Noise variance, for each score can be different. Such information is usually available in terms of psychometric reliability e.g. Chronbach’s Alpha; (Cronbach, 1951).
Then, instead of calculating the exact value of , we calculate an expected value, with respect to posterior probability of the real scores given the observed scores, .
| (6) |
The integral in equation (6) is not tractable since the probability does not obey a standard distribution. We use a sampling method for an approximate solution. The detailed algorithm for PUNCH measure is given in Table 2.
Table 2.
The detailed algorithm for PUNCH.
| Given a sample of n individuals with their corresponding score sets X ≡ {x1, x2,…, xn}, each having m different scores, x ≡ {x1,x2,…, xm}, their diagnosis labels y ∈ {0,1}, and noise variances of scores, |
1. For each score sj
|
| 2. Calculate probabilities p(sj) by normalizing weights wj |
| 3. Fuse individual severity beliefs to get (Equation 1) |
| 4. Repeat 1–3 to get a distribution over |
| 5. Calculate expected value by averaging |
3. Results
We first validate our claim that ranking of individuals with ASD can be attained by using phenotypic scores; and that PUNCH can provide better rankings compared to classification or clustering techniques. Validation is performed with simulated datasets for which we have ground truth severity values. Then, we derive the PUNCH measure for a sample with ASD described by 50 phenotypic scores. PUNCH-based subgroups of individuals have been analyzed for diffusion imaging based differences, to identify an imaging correlate of the underlying pathology-based heterogeneity.
We used 10 fold cross validation for experiments with both simulated and real life data. With simulated experiments, we randomly generated 100 different data sets and applied cross validation to each of them separately, resulting in 100 sets of statistics (100 averages and 100 variances). Plots show statistics over these averages. For the real life data set, we used the standard setting of 10 fold cross validation with the single data set we have, and statistics of cross validation are shown with plots. Data was z-normalized inside the cross validation, by calculating the transformation using only training data and applying it to the test data. For comparison purposes, three other methods were used in classification and ranking experiments, namely support vector machine (SVM), logistic regression, and clustering (Gaussian mixture model). All three methods were implemented using scikit-learn Python library (Pedregosa et al., 2011) with their default parameters.
3.1. Simulated Experiments
For simulated experiments, we have generated datasets that are characterized by different kinds of heterogeneity. We have compared PUNCH with classification and clustering methods to show (1) discriminatory ability between two groups that emulate IPs and TDCs, (2) ranking of the group that simulates IPs.
We have run tests on 100 randomly generated datasets. Each dataset consists of 500 individuals (200 TDCs and 300 IPs). The ground truth severity values for these individuals are randomly sampled from two Beta distributions with(α,β)values of (4,11) for IPs and (7,3) for TDCs. The parameters of distributions are selected so that the two groups are separated with a region of overlap. Then, these ground truth severity values are used to generate different types of scores that emulate the behavior of phenotypic scores in a clinical sample.
As in a real life scenario, we assume that scores are either directly or indirectly related to a disorder, providing varying degrees of information about the separation and ranking of the groups. To simulate this behavior, we randomly generate two families of scores, namely, informative and less informative. We believe that these simulations adequately describe a real life scenario with phenotypic scores.
For the informative scores, an additive noise sampled from a Gaussian with zero mean and variance is applied directly to the ground truth severity values. For each individual score, the variance is randomly sampled from a uniform distribution with a range of (0,0.8) to prepare 15 scores with different levels of descriptive capacity.
Less informative scores are generated by an extra step of quantization to have smaller capacities of ranking. The original severity values are quantized by K-means clustering (C. M. Bishop, 2006) (by assigning the cluster center value to all individuals in the same cluster) where the K value is randomly sampled from a uniform distribution with a range of (2,10). Then an additive noise sampled from a Gaussian with zero mean and variance is applied to the quantized values similar to the informative scores. A uniform distribution with a range of (0,1.2) is used to sample variance values for each score to have relatively higher noise levels compared to the informative scores. We have generated 30 scores of the second type, resulting in 45 scores in total. A randomly generated sample is illustrated in Figure 3 along with three randomly generated scores with different noise levels.
Figure 3.
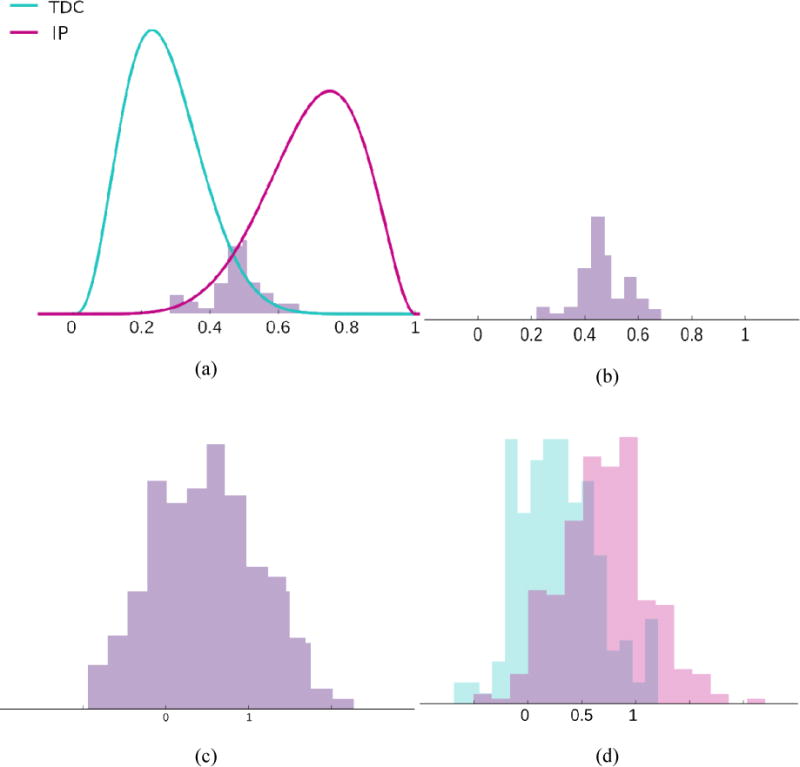
(a) Randomly generated sample of TDCs and IPs; x-axis gives the original severity value. (b), (c), and (d) Three randomly generated scores with different noise and quantization levels, based on the original severity values in (a).
Using these 100 random datasets each described with 45 scores, we analyzed whether the PUNCH score can: (1) discriminate between TDCs and IPs, and (2) create a ranking of IPs. First, we tested the discriminatory ability of PUNCH in the setting of a classification problem, between TDCs and IPs. This was compared with classification using support vector machines (SVM) with a linear kernel (C. M. Bishop, 2006) and logistic regression (Alpaydin, 2010). Figure 4 gives comparisons of classification performances of these three methods with 10-fold cross validation. There are no significant differences between classification performances of the different methods, although PUNCH performs slightly better, suggesting at least similar discriminative ability.
Figure 4.
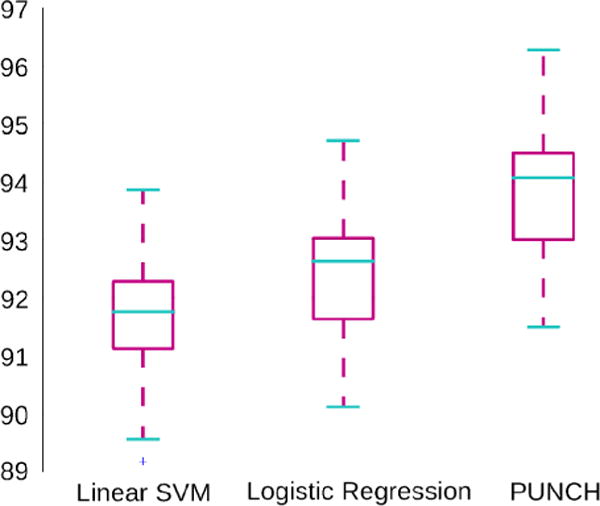
Box plot for classification performance (%) of three methods. Statistics for 100 simulated datasets are shown.
On the other hand, PUNCH outperforms other methods in terms of ranking, as seen in Figure 5. For ranking tests, we have compared PUNCH with the probabilistic output of the classification (logistic regression) and likelihood measure of clustering (mixture of Gaussians) (C. M. Bishop, 2006). With mixture of Gaussians, two clusters are generated based on the best Bayesian Information Criterion (BIC) value (C. M. Bishop, 2006). The first cluster includes mostly TDCs and the second one, mostly IPs. Then, the severity value of an individual is calculated by the likelihood of its being a member of the second cluster. Figure 5 gives several statistics of correlation with the ground truth severity values and the mean absolute error of ranking (difference between suggested ranking and the original ranking) for the 100 data sets. These simulated experiments validate the fact that PUNCH can provide reliable severity values enabling ranking of the population.
Figure 5.
Box plots for (a) correlation with the original severity values and (b) mean absolute ranking error (difference between suggested ranking and the actual ranking). Statistics for 100 simulated datasets are shown.
3.2. Application to a Clinical Sample
We have applied our framework for characterizing the heterogeneity, to a sample of youth with ASD, which is described by a large number of standardized measures in a research setting, to yield a collection of phenotypic scores. Then, subgroups of ASD based on the PUNCH score of the sample have been analyzed for imaging based brain differences, to determine whether the heterogeneity described by PUNCH has an imaging correlate. This is done with the aim of determining whether the ranking provided by PUNCH can be used to probe group differences in other modalities. Also by analyzing imaging differences between low and high PUNCH scores, we will assess the validity of the PUNCH ranking.
First, we tested the discriminatory ability of PUNCH by comparing its classification accuracy with other methods. The classification is performed between TDC and ASD. Next, a single clinical score that is widely used in the current literature was chosen as a ground truth measure of symptom severity (in our case SRS) to validate the rankings provided by PUNCH and other methods. SRS was chosen because it is one of the most frequently used proxies for ASD severity both for clinical and research purposes. The SRS, therefore, was not included in the computation of the PUNCH score for it to remain an independent criterion score to assess predictive and convergent validity.
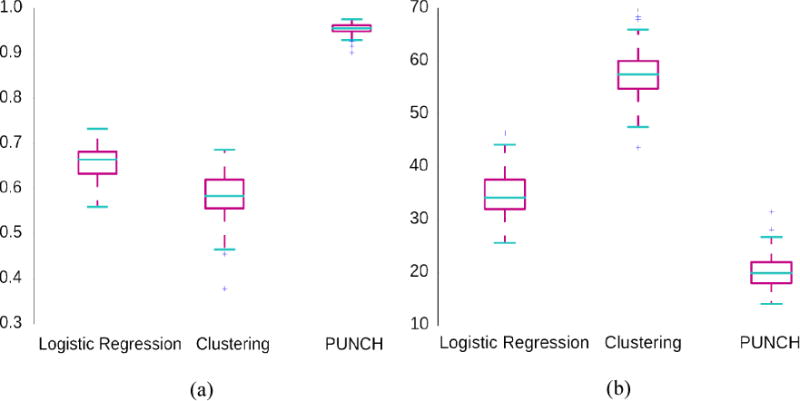
Table 3 gives classification performance with 10-fold cross validation and correlation to SRS for different methods. SVM with a linear kernel and logistic regression are used for classification comparisons as in Section 3.1. For the correlation experiment, we compared PUNCH score with the probabilistic output of logistic regression and the likelihood value of clustering, again as in Section 3.1. Both comparisons yield results similar to the simulated experiments. The difference between accuracies of methods, in terms of classification between TDCs and ASD, is not significant. On the other hand, PUNCH provides better severity assessments compared to other methods since the correlation to SRS is much higher with PUNCH. For all pairs of comparisons, we compared correlation coefficients using Fisher’s r to z transform (Cohen & Cohen, 1983) and estimate the statistical significance; p values are less than 1e-10. As suggested in (Ecker, Marquand, et al., 2010; Ecker, Rocha-Rego, et al., 2010), we also tried to correlate SRS with distance to the optimal hyperplane in SVM, instead of correlating with posterior class probability. This approach indeed boosts the ranking capability of SVM significantly by alleviating limitations of using a decision function relying on the class probabilities, which are illustrated in Figure 1. PUNCH performs better in comparison with this boosted performance.
Table 3.
Comparison of different methods in terms of their classification performance (%) and correlation with a diagnosis phenotypic score, SRS. For logistic regression, only probabilistic output is used for ranking while the distance to the optimal hyperplane (wT x) is also considered for SVM.
| Method | SVM | Logistic Regression | PUNCH | |||||
|---|---|---|---|---|---|---|---|---|
| Classification Performance | 0.95 | 0.96 | 0.95 | |||||
| Method | SVM | SVM (wT x) | Logistic Regression | Clustering | PUNCH |
|---|---|---|---|---|---|
| Correlation with SRS | 0.42 | 0.63 | 0.46 | 0.34 | 0.76 |
The PUNCH distribution of the whole clinical sample is illustrated in Figure 6. For both TDC and ASD groups, we have well behaved Gaussian distributions, which enable us to determine statistically meaningful regions of interest. For instance, the ASD group can be easily divided into three regions, as depicted in Figure 6, corresponding to least severe with a PUNCH interval (0, μ − σ), average severity with a PUNCH interval (μ − σ, μ + σ), and most severely affected with a PUNCH interval (μ + σ, 1), where μ and σ are the mean and the standard deviation of the ASD distribution.
Figure 6.
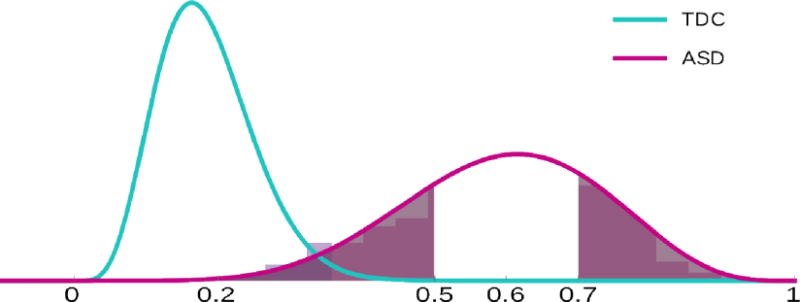
PUNCH distributions of TDCs and ASD for the clinical sample. Both tails of ASD distribution are shaded depicting least severely affected cases with PUNCH value between (0, μ − σ) and most severely affected cases with PUNCH value between (μ + σ, 1). Background histograms show real distributions while curves show fitted normal distributions.
The ASD distribution approximates a normal curve, with the bulk of those with ASD having average severity (see Figure 6). We can define the heterogeneity in terms of variance. In this case, distributions in Figure 6 provide a picture that is consistent with the common belief that the ASD sample suffers from high phenotypic variability, with an overlapping region between TDCs and ASD groups that corresponds to lower end of the ASD severity distribution.
In order to validate the ranking ability of PUNCH, we use the calculated scores to interrogate group differences in brain measurements from DWI data. By defining subgroups of the ASD sample according to this measure, and analyzing differences between these groups and TDCs, we should be able to reveal differences that are not apparent when the whole sample is used. We first divided the ASD sample into three subgroups according to the PUNCH measure that is calculated using only phenotypic scores. Then group differences between each of these subgroups and the TDC group were determined in terms of the imaging data.
Figure 7 shows results of such a study. The middle column of Figure 7 shows ROIs out of 176 WM regions (Wakana et al., 2004) with significant (p < 0.01) Fractional Anisotropy (FA) differences between TDCs and the entire ASD sample. When we discard the lower tail of the severity distribution within the ASD sample, more differences are revealed, as seen in the third column of Figure 7. Similarly, when the most severely affected in the ASD group are discarded, as in the first column of Figure 7, some differences disappear. Table 4 lists the regions that have significantly different FA values between TDC and ASD subgroups shown in representative slices in Figure 7, with the number of regions increasing with the increase in severity. From the table, it can be seen that parts of the corona radiata and the corpus callosum are implicated in all the ASD subgroups. However, it is only in the comparison of the most severely impaired group that the WM tracts like the superior longitudinal fasciculus (SLF) and the inferior fronto-occipital fasciculus (IFOF) are shown to be affected in ASD.
Figure 7.
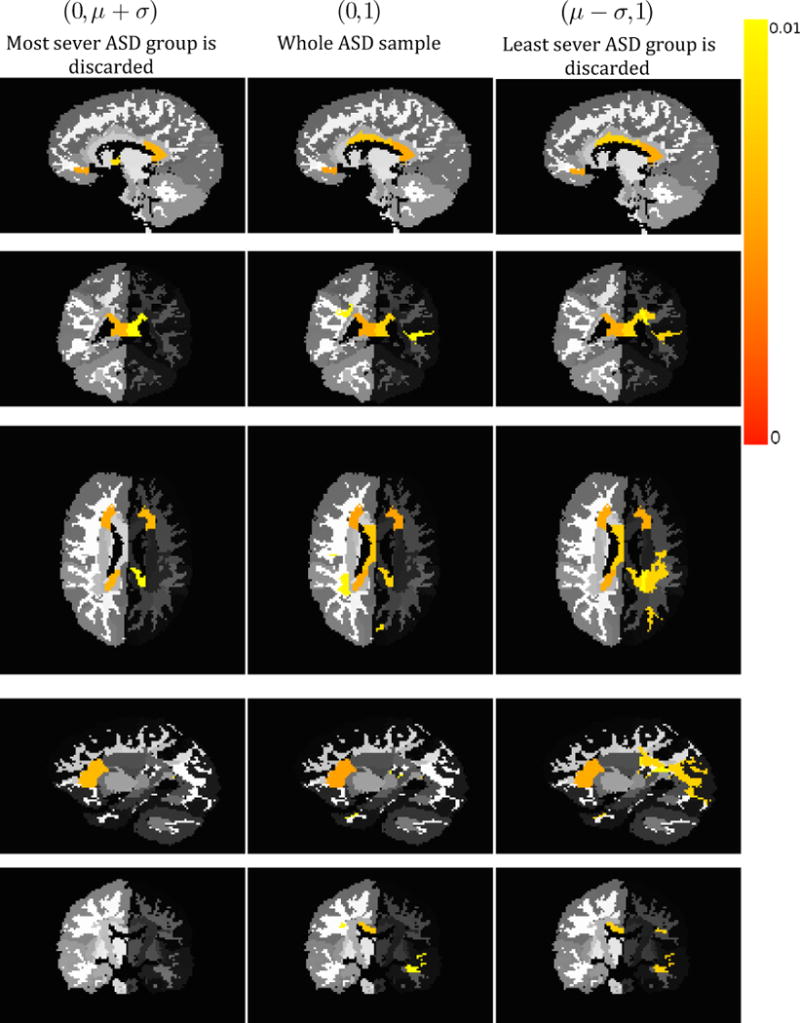
Regions with significant difference of FA values between TDC and ASD groups, color coded by p-value. Each column shows a comparison between a specific subgroup of ASD whose severity values are shown in parentheses as a range and a fixed group of TDCs. Different views and slices are given for better comprehension.
Table 4.
Regions with significant difference of FA values between TDC and ASD groups as compared in Figure 7. Region names with statistically important p-values (p < 0.01) of t-test comparison between all TDCs and three different subgroups of ASD sample are provided (✓: ROI is significantly affected, ✗: ROI is not significantly affected).
| ROI Name | Most sever ASD group is discarded (0, μ + σ) | Whole ASD sample (0, 1) | Least sever ASD group is discarded (μ − σ, 1) |
|---|---|---|---|
| Anterior Corona Radiata Right | ✓ | ✓ | ✓ |
| Anterior Corona Radiata Left | ✓ | ✓ | ✓ |
| Splenium of Corpus Callosum Right | ✓ | ✓ | ✓ |
| Splenium of Corpus Callosum Left | ✓ | ✓ | ✓ |
| Body of Corpus Callosum Right | ✗ | ✓ | ✓ |
| Superior Temporal WM Left | ✗ | ✓ | ✓ |
| Anterior Limb of Internal Capsule Right | ✓ | ✗ | ✗ |
| Cuneus WM Left | ✗ | ✓ | ✗ |
| Superior Longitudinal Fasciculus Right | ✗ | ✓ | ✗ |
| Superior Longitudinal Fasciculus Left | ✗ | ✗ | ✓ |
| Inferior Fronto-Occipital Fasciculus Right | ✗ | ✗ | ✓ |
| Middle Occipital WM Left | ✗ | ✗ | ✓ |
| Posterior Corona Radiata Left | ✗ | ✗ | ✓ |
Finally, we compared our ASD subgroupings with those that are generated by the current standard in the ASD field (SRS). Figure 8 demonstrates the success of PUNCH for the most severely affected individuals. When using PUNCH, with or without including SRS in the instrument list, more affected regions are revealed compared to that of using SRS alone. Even though SRS focuses clearly on the core diagnostic symptoms of ASD, PUNCH is able to fuse various measures that are rather ancillary to the core of ASD and characterize underlying heterogeneity of the sample as well or even better.
Figure 8.
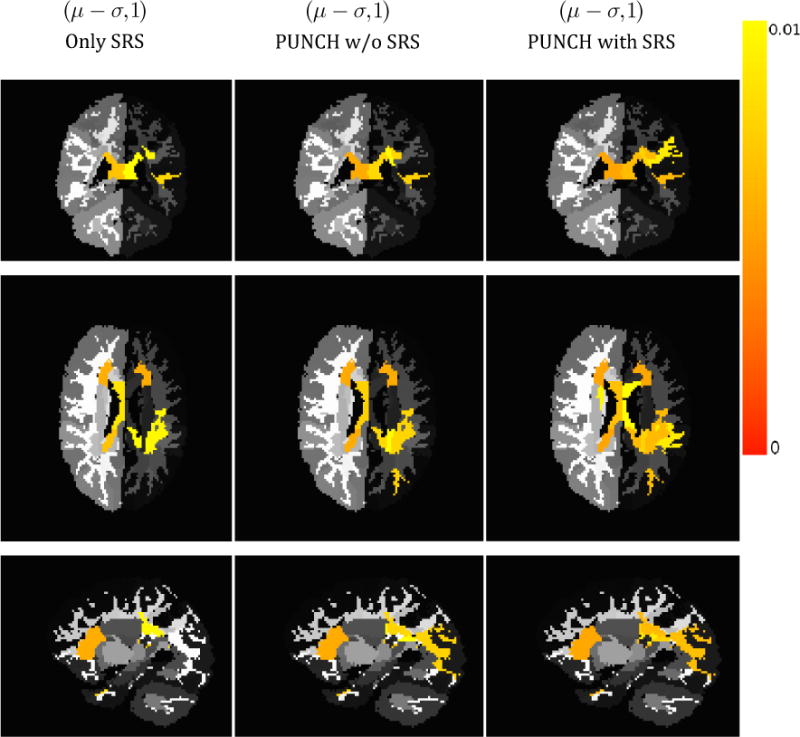
Comparison of significantly affected regions using different severity scores for individuals that are severely affected by ASD. The columns show results when (1) using only SRS, (2) fusing instruments given in Table 1 by PUNCH excluding SRS, and (3) fusing instruments given in Table 1 by PUNCH including SRS. PUNCH assessments reveal more affected regions.
4. Discussion
We have proposed a new severity measure for clinical samples that incorporates information from all the phenotypic scores that describe the sample. PUNCH provides a continuous severity score, in the process introducing a ranking of the sample. It does so by exploiting the fact that each phenotypic score provides a preliminary ranking decision due to its monotonic trajectory. Additionally, different phenotypic scores include different aspects of symptom severity but none of them individually provides a complete characterization of the sample heterogeneity. PUNCH fuses these individual severity beliefs into a final severity decision, by incorporating relevant weighted information from all these multitude scores of severity.
An important advantage of PUNCH score is its flexibility. Inclusion or exclusion of scores into the computation of PUNCH, requires just the re-normalization of weights as explained in Section 2.4. Furthermore, as the scores for TDCs are only used in calculating these weights, a distribution of the variability of these scores over the TDCs from previously published studies is sufficient. This is a significant feature of the proposed measure, as it can be computed for any ASD sample, without the need for these measures on TDCs. Additionally, flexibility over the inclusion or exclusion of scores can be useful when analyzing the effect that a particular score will have on PUNCH and its ability to rank the sample.
This segues into another crucial feature of PUNCH, that being its ability to rank a sample. This is evident from the results of the experiment on simulated data, described in Section 3.1. In these experiments, the groups were assigned ground truth severity scores, as well as simulated phenotypic scores that described different aspects of the sample heterogeneity, emulating a real life clinical sample. Then the computation of PUNCH based on these samples demonstrated an ability to discriminate the two groups, as well as any other classification methods, but surpassed alternate methods in its ranking ability, based on the comparison with the ground truth severity ranking available for this data. This underlines the importance of PUNCH, as a ranking score of severity.
Providing a reliable severity measure can be very helpful in the case of population studies that involve statistical comparison of groups. Due to the large underlying heterogeneity, some group differences may be hidden by the fact that the groups being compared include individuals of varying degrees of severity. The group differences are difficult to discern because the sample being compared with the TDCs consists of individuals only mildly impacted by the disorder. In order to study this problem, PUNCH was computed for an ASD sample that has diffusion imaging data associated with it, as described in Section 3.2. The aim was to determine whether the groupings based on the ranking provided by PUNCH were able to identify group differences that were unique to the sample subgroups, but were lost when the sample was analyzed as whole owing to the underlying heterogeneity. Figure 7 shows differences between the subgroups created by removing the least severe individuals, the most severe individuals and by including all the individuals. The gradual change in regions between the three groups seen in the representative slices of this figure is enhanced by the examination of the regions listed in Table 4. In all the three groups, the splenium of the corpus callosum is affected, although the effect on the body of the corpus callosum is only seen in the most severe group. This is in line with diffusion-based studies in ASD (Alexander et al., n.d.; Barnea-Goraly et al., 2004) which have shown the corpus callosum to be affected by pathology, with varying degrees of severity. The difference between these results may be indicative of the variation in heterogeneity of the samples being studied, as is captured by our study of various subgroups. The corona radiata shows a similar trend; the anterior part of it is affected in all the ASD groups, however the severe subgroup shows an increased area of the corona radiata implicated by pathology. Most interestingly, two important white matter tracts, namely the SLF and the IFOF are only affected in the most severe ASD subgroup. These tracts have been implicated in several ASD studies in the literature (Fletcher et al., 2010; Ingalhalikar et al., 2011).
Experiments with the ASD sample collectively suggests that PUNCH is a promising tool to analyze the contribution of different measures, which are directly or indirectly related to the disorder, for clinical assessments. The clinical scores as listed in Table 1 characterize different aspects of ASD each covering a different subdomain of ASD ontology, with most of them being auxiliary to clinical decision making. The quantified ASD domain concept(s) can change critically from score to score. Their correlation to SRS range in the interval (−0.68,0.57). The variables with these extreme correlation values are non verbal communication variable (−0.68) of Children Communication Checklist-2 and behavioral variable (0.57) of Behavior Rating Inventory of Executive Function. The least correlated variable is the pragmatic language variable (0.002) of Broader Autism Phenotype Questionnaire. The high correlation of PUNCH with SRS as shown in Table 3 suggests that the ranking that is provided by PUNCH is significantly reliable. Even though this is expected behavior due to the high correlation of several individual variables with SRS, poor performance of other techniques (see Table 3) suggests that a lower correlation maybe due to an improper combination of these scores. SRS is a single questionnaire based on just one source of information i.e. parent opinion whereas PUNCH combines scores with different sources that encode different concepts of ASD domain. Indeed, PUNCH should be considered as a framework to extend the ontological coverage of scores by fusing them, but not as an alternative scoring criterion. This fact is validated in Figure 8, showing that fusing decisions of several instruments using PUNCH can provide similar yet better clinical diagnostic assessments than those that are provided by an instrument like SRS.
The ASD sample that we used to demonstrate the imaging correlate of PUNCH score suffers from the fact that it is relatively small and most of the individuals are mildly affected by ASD as seen in Figure 6. This fact prevents us from analyzing the sample heterogeneity in detail i.e. showing imaging characteristics of subgroups that reside at the tails of distribution by grouping individuals having PUNCH scores in the range (0, μ − σ) or (μ + σ, 1), where μ is the sample mean and σ is the sample variance. For this reason, we showed results in Figure 7 with an overlapping setting, by analyzing subgroups of individuals with PUNCH scores in intervals of (0, μ + σ) and (μ − σ, 1). Even with this constraint, PUNCH is able to capture the heterogeneity of the ASD sample, and with the imaging study showing the gradual effect of the underlying pathology.
Besides performing more imaging studies using different modalities, there are several methodological improvements that should be done in the future work. One possible improvement is introducing score specific parameters in the probit regression model as defined in Section 2.3. This will increase the specificity of the decision model of phenotypic scores over the one generated by the use of cumulative distribution function (CDF) of the standard normal distribution. Moreover, for future work, we are planning to incorporate a new weighting scheme that encodes information not only on discrimination between TDCs and individuals with ASD, but also on ranking. Sample statistics like variance may be employed to simulate such information. Additionally, in the current formulation, the inclusion/exclusion of scores can change the final PUNCH score considerably, depending on the weights of the scores. The contributions of scores to the final PUNCH value is determined by their weights that are calculated solely based on their classification performance. This means that the change in the PUNCH score in a case of inclusion or exclusion, is determined by how well the new/discarded score classifies the sample, relative to the remaining scores. For instance, in the case of inclusion of a score that has a substantially higher classification accuracy compared to other scores, the final ranking value is predominantly determined by the ranking of this single score. However, since we know the scores that are available in the clinical inventory, and their individual uses, the robustness to unknown and unpredictable scores is not a crucial practical issue.
It is our expectation that PUNCH scores taken from a highly specific domain (compared to the broad range of phenotypic scores used in this study), such as measures of motor function only or measures of language function only, will yield within domain severity metrics that are even better at parsing differences in brain anatomy between patients and controls. One would expect the total volume of the brain areas that differ between IPs and controls to be smaller, with a more specific set of measures feeding into a PUNCH severity score. However, such an approach can provide a much greater degree of specificity such that a motor PUNCH score would highlight group differences in the motor systems and the a language PUNCH score would reflect specifically on language circuitry. With this approach, a future study could propose a small set of targeted brain-behavior comparisons across two or more groups, which shows an equal or greater range of biological correlates in comparison to the current performance of PUNCH with a large but not very specific set of phenotypic inputs.
5. Conclusions
We have designed a framework to fuse severity decisions of individual phenotypic scores that are provided to characterize clinical samples. PUNCH uses probabilistic voting to combine different phenotypic scores of a sample and provides an explicit ranking of the individuals with pathology to estimate a continuous severity measure with the aim of capturing sample heterogeneity.
Both simulated and real life experiments were used to validate the discriminative and ranking abilities of PUNCH, which are shown to be better than traditional classification or clustering based approaches. Experiments with an ASD sample were performed to show that PUNCH can quantify pathology induced sample heterogeneity by defining a continuous severity metric and a corresponding distribution. PUNCH distribution of the sample is used to analyze groupings of individuals, which depicts the heterogeneity in terms of group differences. Comparing brain imaging data from TDC and ASD groups enabled us to determine that PUNCH provides a useful measure of phenotypic heterogeneity since imaging measurements correlate with the estimated severity ranking of individuals with ASD.
Our DTI based imaging analysis also showed a successful application of PUNCH by revealing differences between subgroups of ASD and TDC sample, in terms of white matter diffusion statistics (FA in our case), which could not be observed without separating out the least severely affected members of the ASD group. It is a common problem in the ASD literature that study results do not always replicate, and one reason could be that the percentage of milder cases cause a loss of statistical power in finding true group differences, when the group is represented only by moderate and severe cases. Patterns revealed by this imaging analysis are in line with previous diffusion-based studies in ASD literature. Moreover, FA changes in two important white matter tracts, namely the SLF and the IFOF, which are known to be affected in ASD, were found to be present only in the more severely affected subgroup of ASD in our sample.
Future directions for this line of research include two obvious next steps as possible improvements. First, with respect to methodological design, individual severity beliefs related to the scores should be enhanced by introducing more specificity to each score instead of simply using the CDF of standard normal distribution. In this way, the slight differences between scores can be simulated and information loss in different aspects of the pathology as described by different scores can be prevented. Additionally, sample statistics related to the ranking, such as variance and statistics of measurement reliability, can be incorporated into the calculation of weights of scores during fusing decisions of individual scores. Second, additional imaging modalities can be studied, again by examining group differences between groups of individuals as determined by PUNCH scorings, to capture other characteristics of the disorder that are affected by the sample heterogeneity.
Highlight.
Designed fusion technique to combine phenotypic scores with interpretable weights.
Obtained continuous measure for population heterogeneity quantification.
Evaluated exhaustively on simulated data.
Validated measure based on group analysis of diffusion imaging data.
Applied on a large sample of youth with Autism Spectrum Disorder.
Acknowledgments
This research was supported by grants from National Institutes of Health (NIMH 1RC1MH088791 to Robert T. Schultz and R01-MH092862, R21-MH098010 to Ragini Verma) and grants from the Pennsylvania Department of Health (SAP # 4100042728, SAP # 4100047863 to Robert T. Schultz)
Footnotes
Publisher's Disclaimer: This is a PDF file of an unedited manuscript that has been accepted for publication. As a service to our customers we are providing this early version of the manuscript. The manuscript will undergo copyediting, typesetting, and review of the resulting proof before it is published in its final citable form. Please note that during the production process errors may be discovered which could affect the content, and all legal disclaimers that apply to the journal pertain.
References
- Alexander AL, Lee JE, Lazar M, Boudos R, DuBray MB, Oakes TR, Lainhart JE. Diffusion tensor imaging of the corpus callosum in Autism. NeuroImage. 34(1):61–73. doi: 10.1016/j.neuroimage.2006.08.032. (n.d.) [DOI] [PubMed] [Google Scholar]
- Alpaydin E. Introduction to Machine Learning. 2. The MIT Press; 2010. [Google Scholar]
- Barnea-Goraly N, Kwon H, Menon V, Eliez S, Lotspeich L, Reiss AL. White matter structure in autism: preliminary evidence from diffusion tensor imaging. Biol Psychiatry. 2004;55(3):323–326. doi: 10.1016/j.biopsych.2003.10.022. [DOI] [PubMed] [Google Scholar]
- Birmaher B, Khetarpal S, Cully M, Brent D, M S. Screen for Child Anxiety Related Disorders (SCARED) Parent Version. Western Psychiatric Institute and Clinic, Univeristy of Pittsburgh; 1995. [Google Scholar]
- Bishop CM. Pattern Recognition and Machine Learning (Information Science and Statistics) Secaucus, NJ, USA: Springer-Verlag New York, Inc; 2006. [Google Scholar]
- Bishop DVM. The Children’s Communication Checklist Second Edition (CCC-2), Manual. Harcourt Assessment, University of Oxford; 2003. [Google Scholar]
- Boomsma A, Van Lang NDJ, De Jonge MV, De Bildt AA, Van Engeland H, Minderaa RB. A new symptom model for autism cross-validated in an independent sample. Journal of Child Psychology and Psychiatry. 2008;49(8):809–816. doi: 10.1111/j.1469-7610.2008.01897.x. [DOI] [PubMed] [Google Scholar]
- Cohen J, Cohen P. Applied multiple regression/correlation analysis for the behavioral sciences. Hillsdale, NJ: Erlbaum; 1983. [Google Scholar]
- Constantino JN, Przybeck T, Friesen D, Todd RD. Reciprocal social behavior in children with and without pervasive developmental disorders. Journal of Developmental and Behavioral Pediatrics. 2000;21(1):2–11. doi: 10.1097/00004703-200002000-00002. [DOI] [PubMed] [Google Scholar]
- Cronbach LJ. Coefficient alpha and the internal structure of tests. Psychometrika. 1951;16(3):297–334. [Google Scholar]
- Cuthbert BN. The RDoC framework: facilitating transition from ICD/DSM to dimensional approaches that integrate neuroscience and psychopathology. World psychiatry: official journal of the World Psychiatric Association (WPA) 2014;13(1):28–35. doi: 10.1002/wps.20087. [DOI] [PMC free article] [PubMed] [Google Scholar]
- Cuthbert BN, Insel TR. Toward the future of psychiatric diagnosis: the seven pillars of RDoC. BMC medicine. 2013;11:126. doi: 10.1186/1741-7015-11-126. [DOI] [PMC free article] [PubMed] [Google Scholar]
- DuPaul GJ, Anastopoulos AD, Power TJ, Murphy K, Barkley RA. ADHD Rating Scale-IV. 1994 Unpublished rating scale. [Google Scholar]
- Eaves LC, Wingert HD, Ho HH, Mickelson ECR. Screening for autism spectrum disorders with the social communication questionnaire. Journal of Developmental and Behavioral Pediatrics. 2006;27(2):S95–S103. doi: 10.1097/00004703-200604002-00007. [DOI] [PubMed] [Google Scholar]
- Ecker C, Marquand A, Mourão-Miranda J, Johnston P, Daly EM, Brammer MJ, Murphy DGM. Describing the brain in autism in five dimensions–magnetic resonance imaging-assisted diagnosis of autism spectrum disorder using a multiparameter classification approach. The Journal of neuroscience: the official journal of the Society for Neuroscience. 2010;30(32):10612–23. doi: 10.1523/JNEUROSCI.5413-09.2010. [DOI] [PMC free article] [PubMed] [Google Scholar]
- Ecker C, Rocha-Rego V, Johnston P, Mourao-Miranda J, Marquand A, Daly EM, Murphy DG. Investigating the predictive value of whole-brain structural MR scans in autism: a pattern classification approach. NeuroImage. 2010;49(1):44–56. doi: 10.1016/j.neuroimage.2009.08.024. [DOI] [PubMed] [Google Scholar]
- Elliott CD. Differential ability scales – second edition: Administration and scoring manual. San Antonio, TX: Harcourt Assessment, Inc; 2007. [Google Scholar]
- Fletcher PT, Whitaker RT, Tao R, DuBray MB, Froehlich A, Ravichandran C, Lainhart JE. Microstructural connectivity of the arcuate fasciculus in adolescents with high-functioning autism. NeuroImage. 2010;51(3):1117–1125. doi: 10.1016/j.neuroimage.2010.01.083. [DOI] [PMC free article] [PubMed] [Google Scholar]
- Frazier TW, Youngstrom EA, Speer L, Embacher R, Law P, Constantino J, Eng C. Validation of proposed DSM-5 criteria for autism spectrum disorder. Journal of the American Academy of Child and Adolescent Psychiatry. 2012;51(1):28–40. doi: 10.1016/j.jaac.2011.09.021. [DOI] [PMC free article] [PubMed] [Google Scholar]
- Georgiades S, Szatmari P, Boyle M, Hanna S, Duku E, Zwaigenbaum L, Thompson A. Investigating phenotypic heterogeneity in children with autism spectrum disorder: a factor mixture modeling approach. Journal of Child Psychology and Psychiatry. 2012 doi: 10.1111/j.1469-7610.2012.02588.x. [DOI] [PubMed] [Google Scholar]
- Geschwind DH. Advances in autism. Annual Review of Medicine. 2009;60:367–380. doi: 10.1146/annurev.med.60.053107.121225. [DOI] [PMC free article] [PubMed] [Google Scholar]
- Gioia GA, Isquith PK, Guy SC, Kenworthy L. Behavior Rating Inventory of Executive Function: Professional Manual. Psychological Assessment Resources, Inc; 2000. [Google Scholar]
- Gotham K, Pickles A, Lord C. Standardizing ADOS scores for a measure of severity in autism spectrum disorders. Journal of Autism and Developmental Disorders. 2009;39(5):693–705. doi: 10.1007/s10803-008-0674-3. [DOI] [PMC free article] [PubMed] [Google Scholar]
- Hurley RSE, Losh M, Parlier M, Reznick JS, Piven J. The broad autism phenotype questionnaire. Journal of Autism and Developmental Disorders. 2007;37(9):1679–1690. doi: 10.1007/s10803-006-0299-3. [DOI] [PubMed] [Google Scholar]
- Ingalhalikar M, Parker D, Bloy L, Roberts TPL, Verma R. Diffusion based abnormality markers of pathology: Toward learned diagnostic prediction of ASD. NeuroImage. 2011;57(3):918–927. doi: 10.1016/j.neuroimage.2011.05.023. [DOI] [PMC free article] [PubMed] [Google Scholar]
- Insel T, Cuthbert B, Garvey M, Heinssen R, Pine DS, Quinn K, Wang P. Research domain criteria (RDoC): toward a new classification framework for research on mental disorders. The American journal of psychiatry. 2010;167(7):748–51. doi: 10.1176/appi.ajp.2010.09091379. [DOI] [PubMed] [Google Scholar]
- Jeste SS, Geschwind DH. Disentangling the heterogeneity of autism spectrum disorder through genetic findings. Nature reviews Neurology. 2014;10(2):74–81. doi: 10.1038/nrneurol.2013.278. [DOI] [PMC free article] [PubMed] [Google Scholar]
- Klin A, Pauls D, Schultz R, Volkmar F. Three diagnostic approaches to Asperger syndrome: implications for research. Journal of autism and developmental disorders. 2005;35(2):221–34. doi: 10.1007/s10803-004-2001-y. Retrieved from http://www.ncbi.nlm.nih.gov/pubmed/15909408. [DOI] [PubMed] [Google Scholar]
- Lazarsfeld PF, Neil HW. Latent Structure Analysis. Boston: Houghton Mifflin; 1968. [Google Scholar]
- Lenroot RK, Yeung PK. Heterogeneity within Autism Spectrum Disorders: What have We Learned from Neuroimaging Studies? Frontiers in human neuroscience. 2013;7:733. doi: 10.3389/fnhum.2013.00733. [DOI] [PMC free article] [PubMed] [Google Scholar]
- Levy SE, Mandell DS, Schultz RT. Autism. Lancet. 2009;374(9701):1627–1638. doi: 10.1016/S0140-6736(09)61376-3. [DOI] [PMC free article] [PubMed] [Google Scholar]
- Long SJ. Regression Models for Categorical and Limited Dependent Variables. Sage Publ; 1997. [Google Scholar]
- Lord C, Risi S, Lambrecht L, Cook EH, Jr, Leventhal BL, DiLavore PC, Rutter M. The autism diagnostic observation schedule-generic: a standard measure of social and communication deficits associated with the spectrum of autism. Journal of Autism and Developmental Disorders. 2000;30(3):205–223. [PubMed] [Google Scholar]
- Lord C, Rutter M, Le Couteur A. Autism Diagnostic Interview-Revised: a revised version of a diagnostic interview for caregivers of individuals with possible pervasive developmental disorders. Journal of Autism and Developmental Disorders. 1994;24(5):659–685. doi: 10.1007/BF02172145. [DOI] [PubMed] [Google Scholar]
- Lubke GH, Muthen B. Investigating population heterogeneity with factor mixture models. Psychological Methods. 2005;10(1):21–39. doi: 10.1037/1082-989X.10.1.21. [DOI] [PubMed] [Google Scholar]
- Morris SE, Cuthbert BN. Research Domain Criteria: cognitive systems, neural circuits, and dimensions of behavior. Dialogues in clinical neuroscience. 2012;14(1):29–37. doi: 10.31887/DCNS.2012.14.1/smorris. Retrieved from /pmc/articles/PMC3341647/?report=abstract. [DOI] [PMC free article] [PubMed] [Google Scholar]
- Mourão-Miranda J, Hardoon DR, Hahn T, Marquand AF, Williams SCR, Shawe-Taylor J, Brammer M. Patient classification as an outlier detection problem: an application of the One-Class Support Vector Machine. NeuroImage. 2011;58(3):793–804. doi: 10.1016/j.neuroimage.2011.06.042. [DOI] [PMC free article] [PubMed] [Google Scholar]
- Muthen B, Shedden K. Finite mixture modeling with mixture outcomes using the EM algorithm. Biometrics. 1999;55(2):463–469. doi: 10.1111/j.0006-341x.1999.00463.x. [DOI] [PubMed] [Google Scholar]
- Owens JA, Spirito A, McGuinn M. The Children’s Sleep Habits Questionnaire (CSHQ): psychometric properties of a survey instrument for school-aged children. Sleep. 2000;23:1043–1051. [PubMed] [Google Scholar]
- Pedregosa F, Varoquaux G, Gramfort A, Michel V, Thirion B, Grisel O, Duchesnay E. Scikit-learn: Machine Learning in {P}ython. Journal of Machine Learning Research. 2011;12:2825–2830. [Google Scholar]
- Rasmussen CE, Williams CKI. Gaussian Processes for Machine Learning (Adaptive Computation and Machine Learning) The MIT Press; 2005. [Google Scholar]
- Snow AV, Lecavalier L, Houts C. The structure of the Autism Diagnostic Interview-Revised: diagnostic and phenotypic implications. Journal of Child Psychology and Psychiatry. 2009;50(6):734–742. doi: 10.1111/j.1469-7610.2008.02018.x. [DOI] [PubMed] [Google Scholar]
- Sparrow SS, Cicchetti DV, Balla DA. Vineland Adaptive Behavior Scale II. Upper Saddle River, NJ: Pearson Education; 2007. [Google Scholar]
- Sui J, Adali T, Yu Q, Chen J, Calhoun VD. A review of multivariate methods for multimodal fusion of brain imaging data. Journal of Neuroscience Methods. 2012;204(1):68–81. doi: 10.1016/j.jneumeth.2011.10.031. [DOI] [PMC free article] [PubMed] [Google Scholar]
- Sui J, Yu Q, He H, Pearlson GD, Calhoun VD. A selective review of multimodal fusion methods in schizophrenia. Frontiers in Human Neuroscience. 2012;6:27. doi: 10.3389/fnhum.2012.00027. [DOI] [PMC free article] [PubMed] [Google Scholar]
- Veatch OJ, Veenstra-Vanderweele J, Potter M, Pericak-Vance MA, Haines JL. Genetically meaningful phenotypic subgroups in autism spectrum disorders. Genes, brain, and behavior. 2014;13(3):276–85. doi: 10.1111/gbb.12117. [DOI] [PubMed] [Google Scholar]
- Wakana S, Jiang H, Poetscher NLM, van Zijl PC, Mori S. Fiber tract-based atlas of human white matter anatomy. Radiology. 2004;230(1):77–87. doi: 10.1148/radiol.2301021640. [DOI] [PubMed] [Google Scholar]