

Abstract
Donor chimerism following allogeneic stem cell transplantation (allo-SCT) commonly is used to predict overall survival (OS) and disease-free survival (DFS) time. Because chimerism is observed at one or more times after allo-SCT, and not at baseline, if chimerism is in fact associated with OS or DFS then the occurrence of either disease progression or death informatively censors (terminates) the observed chimerism process. This violates the assumptions underlying standard statistical regression methods for survival analysis, which may lead to biased conclusions. To assess association between the longitudinal post-allo-SCT donor chimerism process and OS or DFS, we analyzed data from 195 patients with acute myelogenous leukemia (n=157) or myelodysplastic syndrome (n=38) who achieved complete remission after allo-SCT following a reduced-toxicity conditioning regimen of fludarabine/intravenous busulfan. Median follow-up was 31 months (range, 1.1–105 months). Fitted joint longitudinal-survival time models showed that a binary indicator of complete (100%) donor chimerism, and increasing percent donor T-cells, both were significantly associated with longer OS, while decreasing percent donor T-cells was highly significantly associated with shorter OS. Our analyses illustrate the usefulness of modeling repeated post-allo-SCT chimerism measurements as individual longitudinal processes jointly with OS and DFS in order to estimate their relationships.
Keywords: Chimerism, Allogeneic stem cell transplantation, AML, MDS
INTRODUCTION
Allogeneic stem cell transplantation (allo-SCT) is an effective and potentially curative treatment modality for patients with acute myeloid leukemia (AML) and myelodysplastic syndrome (MDS). The two primary goals of allo-SCT are to reestablish hematopoiesis in the patient after receiving a myeloablative preparative regimen and to mount a graft versus leukemia (GvL) immune response to eliminate residual leukemia. Numerous prognostic factors currently are followed post-allo-SCT to detect disease relapse in patients who achieve complete remission (CR), including hematologic parameters, and cytogenetic and molecular mutations in the bone marrow. Early detection and treatment of minimal residual disease prior to overt hematologic relapse following allo-SCT are associated with better outcomes, as it often leads to implementation of adaptive therapeutic decisions such as decreasing immunosuppression, donor lymphocyte infusions or administration of a chemotherapeutic agent, such as azacitidine (Vidaza™), to consolidate and maintain remission [1–3].
Chimerism (percent donor-derived blood cells) following allo-SCT also has been used prognostically for disease relapse [2, 4–8]. This requires measuring chimerism at one or more time points following allo-SCT. The presence of cells of host origin following allo-SCT in the absence of an overt diagnosis of residual AML may indicate inadequate myeloablation or persistence of host-derived malignant cell clones, which ultimately can lead to clinical disease recurrence. Consequently, a high percentage of patient cells following allo-SCT may predict impending disease relapse.
Assessing possible association between chimerism and disease free survival (DFS) time or overall survival (OS) time is not entirely straightforward because chimerism is measured longitudinally at one or more times post allo-SCT, consequently chimerism is a treatment outcome process and not simply a baseline covariate. If the chimerism process is associated with DFS or OS time, then the direction and rate of change of the chimerism process, specifically the slope of the chimerism-time line, may be the key aspect that is predictive of OS or DFS. Standard statistical survival time regression methods, such as a Cox model analysis, cannot reveal such relationships because they require covariates to be measured only at baseline (allo-SCT) or, alternatively, require a landmark analysis [9] wherein time is measured from a single chimerism measurement. Another problem is that relapse or death may be an informative censoring variable for the longitudinal chimerism process, which leads to biased estimates. A valid approach accounts for the joint distribution of the longitudinal process of successive chimerism measurements and the time of the terminating event (relapse or death) [10–12]. The chimerism process, DFS time, or OS time, also may be influenced by other factors recorded at the time of allo-SCT, including the intensity of the preparative regimen, T-cell composition of the graft [13, 14], chimerism lineage (lymphoid vs. myeloid), sample source (bone marrow [BM] vs. peripheral blood [PB]), timing of the chimerism evaluations post allo-SCT, and method used to measure chimerism.
Studies examining the predictive ability of percent chimerism have produced conflicting results. While some have shown that early chimerism detection can be used to predict relapse in pediatric patients with acute lymphoblastic leukemia (ALL) and AML [6, 7, 15], other studies have concluded that the prognostic value of chimerism is limited or not associated with disease relapse in patients, specifically in patients with ALL whose chimerism status was evaluated 80 days post allo-SCT [16, 17]. Despite these conflicting conclusions, there remains a need for a reliable prognostic variable for disease relapse following allo-SCT. A recent report by the National Cancer Institute on the prevention and treatment of relapse after allo-SCT has highlighted the need for surrogate markers and has proposed several specific objectives concerning the predictive value of early detection methods such as percent chimerism. The workshop highlights the critical role of determining the frequency for monitoring minimal residual disease and chimerism after allo-SCT and assessment of the efficacy of interventional strategies based on changes in minimal residual disease and/or chimerism to prevent overt clinical relapse [18].
Since the value of chimerism at a single time point after allo-SCT may be misleading because it ignores the path (direction and slope) of the chimerism process over time, we sought to determine whether longitudinal chimerism measurements can be used to more accurately predict relapse in patients post allo-SCT. Here, we describe a retrospective analysis investigating the significance of chimerism measurements over time as a prognostic factor for DFS and/or OS. To account for association between chimerism and the event time, we performed analyses based on “shared random effects” models [10–12], wherein patient-specific random effects are included in both the mean of the longitudinal chimerism process and the linear predictor in the hazard function of the event time model.
MATERIALS AND METHODS
Patient selection
We studied 206 patients with AML (n=165) or MDS (n=41) transplanted at The University of Texas M. D. Anderson Cancer Center (MDACC) between April 2001 and October 2007. All protocols, including this retrospective analysis, were approved by the institutional review board of the MDACC. Patients provided written informed consent for their treatment and were treated in accordance with the Declaration of Helsinki.
All preparative regimens included intravenous (IV) busulfan and fludarabine at a myeloablative dose intensity [19, 20]. Of the 206 patients, fifty one percent of patients (n=105) had received matched-related donor transplants (MRD), 40% (n=82) received matched unrelated donor (MUD) transplants and 9% (n=19) received a one-antigen-mismatched transplant. Antithymocyte globulin (ATG) was administered to patients who received grafts from MUD or mismatched grafts [19, 20]. All patients received tacrolimus and mini-dose methotrexate for graft-versus-host disease (GvHD) prophylaxis.
Cytogenetic risk categories were defined as follows: favorable-risk cytogenetics included patients with translocation (t)(8;21); inversion (inv)(16) or t(16;16); or t(15;17). Adverse-risk cytogenetics included patients with a complex karyotype (≥4 abnormalities); inv(3) or t(3;3); t(6;11); del (5q); del 7q; 11q23 abnormalities excluding t(9;11) and t(11;19). Intermediate risk cytogenetics were defined as patients with a normal karyotype, as well as those who did not fit the criteria for favorable- or adverse-risk cytogenetics [21, 22].
DNA chimerism in blood and bone marrow was measured using polymerase chain reaction (PCR)-based technology, as previously described [20]. Briefly, DNA microsatellite polymorphisms were analyzed by PCR using standard primers followed by analysis using GeneScan software (Applied Biosystems, Foster City, CA). Percent chimerism was calculated using the fraction of donor to total DNA in the analyzed sample.
Statistical Methods
Frequencies and percentages were used to summarize patient characteristics. OS and DFS times were recorded from the time of allo-SCT. Unadjusted OS and DFS distributions were estimated using the method of Kaplan and Meier [23]. To assess association between chimerism measured at one or more of days 30, 60, and 90 post allo-SCT, and OS or DFS, a joint model for the longitudinal chimerism process and the event time distribution [10–12] was fit. This was done (1) for the longitudinal process of complete (100%) T-cell chimerism and event time (OS or DFS), and (2) for the longitudinal process of percent T-cell chimerism and event time. In each joint model, to account for association between chimerism and event time, one or more random patient-specific parameters were included in both the linear term of the mean chimerism process and the hazard function of the event time. Details are given in supplemental methods section. Computations for all statistical analyses were conducted in R (R Development Core Team, Version 2.14.1) and SAS (SAS Institute Inc., Version 9.2).
RESULTS
Patient Characteristics
Two hundred and six patients with either AML (n=165) or MDS (n=41) received allo-SCT between April 2001 and October 2007. The median age at time of transplant was 47 years; 83 patients (40%) were >50 years. Ninety-eight (48%) patients were female, and 108 (52%) were male. One hundred ninety-five patients achieved CR following allo-SCT and were used in the chimerism analysis. We focused our chimerism analysis on this subgroup of patients because patients who fail to achieve CR by definition have a mixed chimera and worse outcomes, and therefore intrinsically bias the effect of chimerism on OS and DFS. Pre-transplant patient characteristics for this subgroup of patients are presented in Table 1. CR was defined as the achievement of a normalized marrow maturation profile and less than 5% blasts (cytological CR). No specialized data regarding the assessment of minimal residual disease such as flow cytometry, fluorescence in situ hybridization (FISH) or cytogenetics were included, neither were strict peripheral blood criteria for CR, such as platelet >100,000 or absolute neutrophil count (ANC) ≥1,500 applied [24].
Table 1.
Characteristics of patients who achieved CR following allo-SCT (n=195).
| Variable | Value | Number (%) |
|---|---|---|
| Gender | Male | 104(53.3) |
| Female | 91 (46.7) | |
| Age (years) | >50 | 72 (36.9) |
| ≤50 | 123 (63.1) | |
| Disease | AML | 157 (80.5) |
| MDS | 38 (19.5) | |
| Disease status at transplantation | CR | 112 (57.4) |
| Active disease | 83 (43.6) | |
| Cytogenetics | Good | 18 (9.2) |
| Intermediate | 102 (52.3) | |
| Poor | 74 (37.9) | |
| Unknown | 1 (0.5) | |
| Donor type | MRD | 98 (50.2) |
| MUD | 78 (40.0) | |
| Mismatched | 19 (9.7) | |
| Stem cell source | Bone Marrow | 87 (44.6) |
| Peripheral Blood | 108 (55.4) |
Abbreviations: MRD, matched related donor; MUD, matched unrelated donor; CR, complete remission.
Unadjusted OS and DFS
The median follow up period for all patients and those who achieved CR following allo-SCT was 28.2 months (range, 0.8 –104.6 months) and 31 months (range, 1.1–105 months), respectively. The 2-year OS rates for all patients and those who achieved CR after allo-SCT were 54% and 57%, respectively. The 2-year DFS rates for all patients and those who achieved CR after allo-SCT were 47% and 50%, respectively. Kaplan-Meier plots of OS and DFS distributions for the patients who achieved CR following allo-SCT are shown in Figure 1.
Figure 1. Survival curves of overall survival (A) and disease-free survival (B).
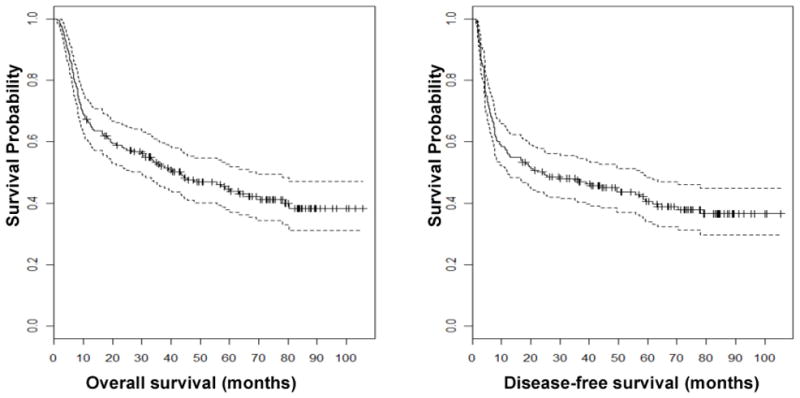
Kaplan-Meier plots showing OS and DFS for patients who achieved CR after allo-SCT (n=195). Dashed lines indicate 95% confidence intervals.
Transplant outcomes for patients who achieved CR following allo-SCT
Engraftment was achieved in all patients who achieved CR following allo-SCT (n=195). There were no deaths reported by day 30. One hundred-day mortality for this subgroup of patients was 3% (n=5) and was caused by recurrent disease (n=3), graft failure (n=1) and acute GvHD (aGvHD) (n=1). Thirty-three percent of patients (n=65) developed grade II–IV aGvHD, 9% (n=18) developed grade III–IV aGvHD, and 53% (n=104) developed chronic GvHD.
Individual Chimerism Measurement Effects on OS or DFS
Table 2 summarizes landmark Cox model analyses [9] of the effects of day 30, 60, and 90 chimerism and OS or DFS. Each fitted model evaluates the effect of one post-SCT chimerism measurement, with times to recurrence or death recorded from the day chimerism was evaluated. The fitted models indicate that a higher fraction of donor myeloid cells at day 90 had a beneficial effect on both OS and DFS, while a higher fraction of donor myeloid or T-cells at day 60 had a beneficial effect on DFS but not OS.
Table 2.
Fitted landmark Cox models for overall survival (OS) or disease free survival (DFS) time as a function of percent donor chimerism at day 30, 60, or 90. In each model, the event time was recorded from the day chimerism was measured. A negative coefficient estimate corresponds to a lower event rate, hence a beneficial effect.
| Overall Survival | Disease Free Survival | |||||||
|---|---|---|---|---|---|---|---|---|
|
| ||||||||
| Na | Nc | Coef (95% CI) | P-value | Na | Nc | Coef (95% CI) | P-value | |
|
| ||||||||
| Percent donor T cells | ||||||||
| Day | ||||||||
| 30 | 195 | 121 | −0.007(−0.019,0.005) | 0.230 | 195 | 121 | −0.012(−0.022,−0.002) | 0.027 |
| 60 | 193 | 103 | −0.008(−0.022,0.006) | 0.220 | 187 | 102 | −0.022(−0.036,−0.008) | <0.001 |
| 90 | 187 | 114 | −0.007(−0.019,0.005) | 0.290 | 172 | 110 | −0.003(−0.017,0.011) | 0.620 |
| Percent donor myeloid cells | ||||||||
| Day | ||||||||
| 30 | 195 | 123 | 0.006(−0.053,0.065) | 0.850 | 195 | 123 | −0.025(−0.090,0.040) | 0.450 |
| 60 | 193 | 101 | −0.009(−0.031,0.013) | 0.390 | 187 | 100 | −0.058(−0.099,−0.017) | 0.007 |
| 90 | 187 | 113 | −0.056(−0.076,−0.036) | <0.001 | 172 | 113 | −0.063(−0.096,−0.030) | <0.001 |
Abbreviations: Na, number of subjects alive at the given day; Nc, number of subjects alive with chimerism evaluated at the given day.
Inferences from joint models of longitudinal chimerism processes and OS or DFS
Among the 206 patients, 154 (75%) achieved complete (100%) donor T-cell chimerism and 162 (79%) achieved complete donor myeloid cell chimerism. While interval censoring of the times complicates estimation, the median time to complete T-cell chimerism was between 1 and 2 months, and the median time to complete myeloid chimerism was less than 1 month.
The fitted joint longitudinal-event time models utilize each patient’s entire chimerism process over time (Figure 2). Because longitudinal indicators of complete donor chimerism in this dataset were nearly identical in each patient for T-cells and myeloid cells, an indicator of cell type cannot be included in the joint model of probability of complete (100%) donor T-cell chimerism post allo-SCT and OS time (Table 3). Because the T-cell and myeloid donor cell percentages differed among patients with incomplete chimerism, an indicator for cell type was included in the fitted joint model for the longitudinal percent donor T-cells or myeloid cells post allo-SCT and OS time (Table 4).
Figure 2. Longitudinal measurements of T cell and myeloid chimerism.
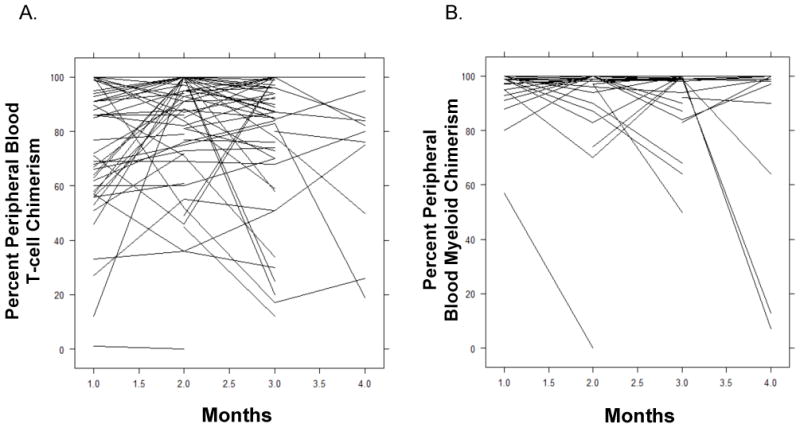
Plots of longitudinal T cell (A) and myeloid cell (B) chimerism measurements for patients who achieved CR following allo-SCT (n=195).
Table 3.
Fitted joint model for longitudinal complete (100%) T-cell chimerism indicator and OS time, for patients who achieved CR following allo-SCT (n=195).
| Coefficient | SE | P-value | 95% CI | |
|---|---|---|---|---|
|
|
||||
| Longitudinal model for complete donor T-cell chimerism1 | ||||
| Time after allo-SCT | 0.146 | 0.027 | <0.001 | (0.093, 0.199) |
| Disease status at time of allo-SCT | ||||
| CR vs. Active | 0.799 | 0.529 | 0.135 | (−0.238,1.836) |
| Allotype | ||||
| MRD vs. MUD | 0.380 | 0.836 | 0.650 | (−1.259,2.019) |
| Mismatched vs. MUD | −0.253 | 0.558 | 0.651 | (−1.347, 0.841) |
| Cytogenetic risk group | ||||
| Good vs. poor | 0.066 | 0.476 | 0.890 | (−0.867,1.000) |
| Intermediate vs. poor | 0.186 | 0.833 | 0.824 | (−1.447,1.819) |
| Cox model for OS time2 | ||||
| Shared random effect | −0.164 | 0.068 | 0.017 | (−0.297, −0.031) |
| Disease status at time of allo-SCT | ||||
| CR vs. Active | −1.151 | 0.238 | <0.001 | (−1.617, −0.685) |
| Allotype | ||||
| MRD vs. MUD | −0.465 | 0.256 | 0.071 | (−0.967,0.037) |
| Mismatched vs. MUD | 0.302 | 0.318 | 0.342 | (−0.321, 0.925) |
| Cytogenetic risk group | ||||
| Good vs. poor | −0.318 | 0.361 | 0.381 | (−1.026,0.390) |
| Intermediate vs. poor | −0.452 | 0.237 | 0.058 | (−0.916,0.014) |
A positive (negative) coefficient estimate in the longitudinal model corresponds to higher (lower) probability of complete T-cell chimerism.
A positive (negative) coefficient estimate in the Cox model corresponds to a higher (lower) risk of death and thus on average a shorter (longer) OS time.
Table 4.
Fitted joint model for longitudinal chimerism percentage and OS time, for patients who achieved CR following allo-SCT (n=195).
| Coefficient | SE | P-value | 95% CI | |
|---|---|---|---|---|
| Longitudinal model for T-cell or myeloid cell percent donor cells* | ||||
| Type of chimerism | ||||
| Myeloid vs. T-cell† | 8.641 | 0.861 | <0.001 | (6.953,10.329) |
| Time after allo-SCT | −0.378 | 0.418 | 0.366 | (−1.197,0.441) |
| Disease status at time of allo-SCT | ||||
| CR vs. Active | 3.448 | 1.949 | 0.079 | (−0.372, 7.268) |
| Allotype | ||||
| MRD vs. MUD | −4.171 | 2.063 | 0.045 | (−8.214, −0.128) |
| Mismatched vs. MUD | −1.709 | 3.267 | 0.602 | (−8.112, 4.694) |
| Cytogenetic risk group | ||||
| Good vs. poor | 1.494 | 2.079 | 0.474 | (−2.581, 5.569) |
| Intermediate vs. poor | 2.795 | 3.517 | 0.428 | (−4.098,9.688) |
| Cox model for OS time‡ | ||||
| Shared Random Effects | ||||
| Increasing donor chimerism | −0.479 | 0.217 | 0.027 | (−0.904, −0.053) |
| Decreasing donor chimerism | 0.166 | 0.047 | <0.001 | (0.074,0.258) |
| Disease status at time of allo-SCT | ||||
| CR vs. Active | −0.884 | 0.208 | <0.001 | (−1.292, −0.476) |
| Allotype | ||||
| MRD vs. MUD | −0.026 | 0.240 | 0.912 | (−0.496,0.444) |
| Mismatched vs. MUD | 0.174 | 0.318 | 0.583 | (−0.449, 0.797) |
| Cytogenetic risk group | ||||
| Good vs. poor | −0.390 | 0.223 | 0.081 | (−0.827, 0.047) |
| Intermediate vs. poor | −0.780 | 0.411 | 0.057 | (−1.585, 0.026) |
A positive (negative) coefficient estimate in the longitudinal model corresponds to higher (lower) percent donor cells.
Indicates that the percentage of myeloid cell chimerism is significantly higher than T cell chimerism.
A positive (negative) coefficient estimate in the Cox model corresponds to a higher (lower) risk of death and thus on average a shorter (longer) OS time.
The fitted joint model for probability of complete donor T-cell chimerism post allo-SCT and OS (Table 3) showed that this probability increased significantly over time (P< 0.001) and a higher complete chimerism probability was significantly associated with longer OS (P = 0.017). A similar joint model for complete donor T-cell chimerism with DFS in place of OS (Supplemental Table S1) gave similar results and the same substantive conclusions.
The fitted joint model for percent donor T-cells or myeloid cells post allo-SCT and OS (Table 4) showed that increasing donor cell chimerism was significantly associated with better OS (P=0.027), while decreasing donor cell chimerism was highly significantly associated with worse OS (P <0.001). A similar joint model for percent donor cells with DFS in place of OS (Supplemental Table S2) also showed that decreasing percent donor cells was significantly associated with worse DFS (P = 0.019), but increasing percent donor cells was not significantly associated with DFS (P = 0.379).
Table 5 applies the fitted joint model in Table 4 by giving predicted 1-year OS and DFS probabilities for particular combinations of baseline covariates and percent T-cell or myeloid cell chimerism at days 30 and 90. The strongest message in Table 5 is that patients having an increase from 95% chimerism at day 30 to 100% chimerism at day 90 had the highest 1-year OS probabilities. Table 5 also illustrates the well-known beneficial effects of being in CR, having good cytogenetics, and a matched related donor.
Table 5.
Predicted 1-year overall survival and disease free survival probabilities for nine combinations obtained from three specific combinations of patient prognostic covariates and three pairs of percent chimerism values at days 30 and 90. Predicted values are based on the fitted joint models for percent T-cell or myeloid cell chimerism and OS or DFS time summarized in Table 3.
| Predicted Probabilities at 1 Year Post SCT | |||||
|---|---|---|---|---|---|
|
| |||||
| Patient Characteristics | % Chimerism at days (30, 90) | Overall Survival | Disease Free Survival | ||
|
| |||||
| Prob | 95% CI | Prob | 95% CI | ||
|
|
|||||
| Complete Remission | (95, 95) | 0.780 | (0.689, 0.884) | 0.737 | (0.643, 0.845) |
| Allotype=MRD | (95, 100) | 0.949 | (0.918, 1.000) | 0.638 | (0.459, 0.887) |
| Cytogenetics=Good | (95, 90) | 0.718 | (0.616, 0.836) | 0.615 | (0.478, 0.792) |
| Active Disease | (95,95) | 0.402 | (0.269, 0.601) | 0.412 | (0.287, 0.593) |
| Allotype=MUD | (95, 100) | 0.826 | (0.648, 1.000) | 0.272 | (0.083, 0.895) |
| Cytogenetics=Poor | (95, 90) | 0.296 | (0.176, 0.498) | 0.244 | (0.113, 0.529) |
| Active Disease | (95, 95) | 0.842 | (0.724, 0.978) | 0.687 | (0.505, 0.935) |
| Allotype=MRD | (95,100) | 0.918 | (0.816, 1.000) | 0.576 | (0.326, 1.000) |
| Cytogenetics=Intermed. | (95, 90) | 0.581 | (0.367, 0.918) | 0.550 | (0.322, 0.940) |
Abbreviations: SCT, stem cell transplantation; Prob, probability; MUD, matched unrelated donor; MRD, matched related donor; Inermed., intermediate.
DISCUSSION
Establishment of donor cell chimerism provides useful information regarding the prognosis of AML/MDS patients following allo-SCT. Although the importance of chimerism status following allo-SCT in leukemia has been validated and compared with other methods of measuring minimal residual disease, studies have used absolute chimerism values and qualitative criteria of chimerism changes to determine its role as a prognosticator [7, 15, 25]. In this study of 195 patients with AML or MDS in CR, we have shown that longitudinal chimerism measurements are highly predictive of both OS time and DFS time following allo-SCT.
Our results are supported by two other studies that have shown a benefit in following chimerism over time. In one study of one hundred one pediatric patients with ALL, Bader et al. reported higher 3-year DFS in patients with complete chimerism/low level mixed chimerism (DFS=66%) and increasing donor cell chimerism (DFS=66%), in contrast with patients who had decreasing donor cell chimerism (DFS=23%; P<0.0001) [6], which was defined as >5% increase in the proportion of host-derived cells between two consecutive chimerism assessments at predefined time points. Eighty five percent of patients received total body irradiation (TBI)-based preparative regimens and 41% received T-cell depleted stem cell grafts. Similar to childhood ALL, in another study in eighty-one pediatric patients with AML, decreasing donor cell chimerism was also shown to be a poor prognostic indicator [7]. In this aforementioned study, 59% probability of 3-year DFS was shown for patients with complete chimerism/low level mixed chimerism, 60% for patients with increasing donor cell chimerism and 28% for patients with decreasing donor cell chimerism (P<0.005). Eighty-eight percent of patients in the study received busulfan-based conditioning regimen and 40% received T-cell depleted stem cell grafts. The results from this study were corroborated in a prospective multicenter trial that confirmed the clinical significance of chimerism as a prognostic indicator in childhood AML[15]. All three studies employed a semi-quantitative PCR approach based on the amplification of short tandem repeat markers to measure chimerism [26]. Furthermore, in these three studies, early immunotherapeutic intervention based on chimerism results was advocated to improve outcome, i.e. prevent clinical relapse.
Other studies, however, have questioned the value of chimerism in prognosticating disease outcomes. In one retrospective study of eighty-nine patients with ALL who received allo-SCT, achievement of <90% and ≥ 90% donor CD3+ T cells was associated with a non-significant difference in 3 year actuarial DFS probability (62% vs. 48%; P=0.49) [16]. The patients enrolled in that study had received TBI-based preparative regimens and chimerism analyses were performed at a median of 77 days (range, 65 – 113 days) after transplantation using conventional cytogenetic analysis and fluorescence in situ hybridization (FISH) for sex mismatched donors, and molecular methodology for same sex donors. Another study by Mossallam et al. that included 673 patients with a variety of malignancies, including MDS/AML (n=380), ALL (n=111), chronic lymphocytic leukemia (n=118) and other malignancies (n=64) and who received a wide variety of preparative regimens, showed a lack of correlation between chimerism and survival outcomes following allo-SCT [17]. Specifically, there were no significant correlations between donor chimerism and overall mortality or relapse. Chimerism was measured using FISH for sex-mismatched donors and using molecular techniques for same sex donors.
A principal factor that may have caused the conflicting results in the aforementioned studies is the relative heterogeneity in the patient populations that were investigated in each of the studies, the preparative regimens used and the different methods employed to measure chimerism. Our analysis here is homogeneous and conducted in adult patients with only a diagnosis of AML/MDS and having received the same myeloablative, reduced-toxicity conditioning regimen of IV busulfan/fludarabine followed by infusion of allogeneic stem cells, as well as a uniform GvHD prophylaxis regimen. We used a standard molecular PCR-based methodology to analyze chimerism in all the patients. Furthermore, our results emphasize the value of the rate of change of chimerism as being the most important factor in predicting outcomes, and not the chimerism status or absolute value at individual time points. This observation is very important as it highlights the significance of the evolution of the donor graft over time, which can change independent of the underlying disease due to exposure to a variety of factors that affect the immune system. On the other hand, the change in the percentage of donor cells over time may be a direct function of disease relapse and in turn could decrease the ability of the donor graft to control the underlying malignancy. Furthermore, since malignant cells likely have a higher proliferative rate in comparison with normal hematopoietic stem cells, a slowly decreasing mixed chimerism may reflect proliferation of host-derived normal hematopoietic cells rather than AML.
In conclusion, we show that serial chimerism measurement is a valuable tool in prognosticating survival outcomes in patients with AML/MDS following allo-SCT. Our results highlight the value of the rate of change in chimerism rather than the absolute percent chimerism or chimerism status in predicting survival following allo-SCT in patients receiving myeloablative IV busulfan/fludarabine and who achieve CR following allo-SCT for AML/MDS.
Supplementary Material
Acknowledgments
This research is supported in part by the MD Anderson Cancer Center Support Grant CA016672, NIH/NCI P0I-CA55164 and NIH/NCI R01 CA83932.
The authors thank the editor and two referees for their detailed and constructive comments.
Footnotes
Financial Disclosure Statement: The authors declare no conflict of interest.
Supplementary data related to this article can be found online.
References
- 1.van Rhee F, Lin F, Cullis JO, Spencer A, Cross NC, Chase A, et al. Relapse of chronic myeloid leukemia after allogeneic bone marrow transplant: the case for giving donor leukocyte transfusions before the onset of hematologic relapse. Blood. 1994;83:3377–83. [PubMed] [Google Scholar]
- 2.Bader P, Klingebiel T, Schaudt A, Theurer-Mainka U, Handgretinger R, Lang P, et al. Prevention of relapse in pediatric patients with acute leukemias and MDS after allogeneic SCT by early immunotherapy initiated on the basis of increasing mixed chimerism: a single center experience of 12 children. Leukemia. 1999;13:2079–86. doi: 10.1038/sj.leu.2401581. [DOI] [PubMed] [Google Scholar]
- 3.de Lima M, Giralt S, Thall PF, de Padua Silva L, Jones RB, Komanduri K, et al. Maintenance therapy with low-dose azacitidine after allogeneic hematopoietic stem cell transplantation for recurrent acute myelogenous leukemia or myelodysplastic syndrome: a dose and schedule finding study. Cancer. 2010;116:5420–31. doi: 10.1002/cncr.25500. [DOI] [PMC free article] [PubMed] [Google Scholar]
- 4.Collins RH, Jr, Shpilberg O, Drobyski WR, Porter DL, Giralt S, Champlin R, et al. Donor leukocyte infusions in 140 patients with relapsed malignancy after allogeneic bone marrow transplantation. J Clin Oncol. 1997;15:433–44. doi: 10.1200/JCO.1997.15.2.433. [DOI] [PubMed] [Google Scholar]
- 5.Serrano J, Roman J, Sanchez J, Jimenez A, Castillejo JA, Herrera C, et al. Molecular analysis of lineage-specific chimerism and minimal residual disease by RT-PCR of p210(BCR-ABL) and p190(BCR-ABL) after allogeneic bone marrow transplantation for chronic myeloid leukemia: increasing mixed myeloid chimerism and p190(BCR-ABL) detection precede cytogenetic relapse. Blood. 2000;95:2659–65. [PubMed] [Google Scholar]
- 6.Bader P, Kreyenberg H, Hoelle W, Dueckers G, Handgretinger R, Lang P, et al. Increasing mixed chimerism is an important prognostic factor for unfavorable outcome in children with acute lymphoblastic leukemia after allogeneic stem-cell transplantation: possible role for pre-emptive immunotherapy? Journal of clinical oncology. 2004;22:1696–705. doi: 10.1200/JCO.2004.05.198. [DOI] [PubMed] [Google Scholar]
- 7.Bader P, Kreyenberg H, Hoelle W, Dueckers G, Kremens B, Dilloo D, et al. Increasing mixed chimerism defines a high-risk group of childhood acute myelogenous leukemia patients after allogeneic stem cell transplantation where pre-emptive immunotherapy may be effective. Bone marrow transplantation. 2004;33:815–21. doi: 10.1038/sj.bmt.1704444. [DOI] [PubMed] [Google Scholar]
- 8.Lamba R, Abella E, Kukuruga D, Klein J, Savasan S, Abidi MH, et al. Mixed hematopoietic chimerism at day 90 following allogenic myeloablative stem cell transplantation is a predictor of relapse and survival. Leukemia. 2004;18:1681–6. doi: 10.1038/sj.leu.2403468. [DOI] [PubMed] [Google Scholar]
- 9.Anderson JR, Cain KC, Gelber RD. Analysis of survival by tumor response. J Clin Oncol. 1983;1:710–9. doi: 10.1200/JCO.1983.1.11.710. [DOI] [PubMed] [Google Scholar]
- 10.Ibrahim JG, Chu H, Chen LM. Basic concepts and methods for joint models of longitudinal and survival data. J Clin Oncol. 2010;28:2796–801. doi: 10.1200/JCO.2009.25.0654. [DOI] [PMC free article] [PubMed] [Google Scholar]
- 11.Tsiatis AA, Davidian M. Joint modeling of longitudinal and time-to-event data: An overview. Stat Sin. 2004;14:809–34. [Google Scholar]
- 12.Tsiatis AA, DeGruttola V, Wulfsohn MS. Modeling the relationship of survival to longitudinal data measured with error: Applications to survival and CD4 counts in patients with AIDS. Journal of the American Statistical Association. 1995;90:27–37. [Google Scholar]
- 13.Mackinnon S, Barnett L, Bourhis JH, Black P, Heller G, O’Reilly RJ. Myeloid and lymphoid chimerism after T-cell-depleted bone marrow transplantation: evaluation of conditioning regimens using the polymerase chain reaction to amplify human minisatellite regions of genomic DNA. Blood. 1992;80:3235–41. [PubMed] [Google Scholar]
- 14.van Leeuwen JE, van Tol MJ, Joosten AM, Wijnen JT, Verweij PJ, Khan PM, et al. Persistence of host-type hematopoiesis after allogeneic bone marrow transplantation for leukemia is significantly related to the recipient’s age and/or the conditioning regimen, but it is not associated with an increased risk of relapse. Blood. 1994;83:3059–67. [PubMed] [Google Scholar]
- 15.Rettinger E, Willasch AM, Kreyenberg H, Borkhardt A, Holter W, Kremens B, et al. Preemptive immunotherapy in childhood acute myeloid leukemia for patients showing evidence of mixed chimerism after allogeneic stem cell transplantation. Blood. 2011;118:5681–8. doi: 10.1182/blood-2011-04-348805. [DOI] [PubMed] [Google Scholar]
- 16.Doney K, Loken M, Bryant E, Smith A, Appelbaum F. Lack of utility of chimerism studies obtained 2–3 months after myeloablative hematopoietic cell transplantation for ALL. Bone marrow transplantation. 2008;42:271–4. doi: 10.1038/bmt.2008.155. [DOI] [PMC free article] [PubMed] [Google Scholar]
- 17.Mossallam GI, Kamel AM, Storer B, Martin PJ. Prognostic utility of routine chimerism testing at 2 to 6 months after allogeneic hematopoietic cell transplantation. Biol Blood Marrow Transplant. 2009;15:352–9. doi: 10.1016/j.bbmt.2008.12.496. [DOI] [PMC free article] [PubMed] [Google Scholar]
- 18.Bishop MR, Alyea EP, 3rd, Cairo MS, Falkenburg JH, June CH, Kroger N, et al. National Cancer Institute’s First International Workshop on the Biology, Prevention, and Treatment of Relapse after Allogeneic Hematopoietic Stem Cell Transplantation: summary and recommendations from the organizing committee. Biol Blood Marrow Transplant. 2011;17:443–54. doi: 10.1016/j.bbmt.2010.12.713. [DOI] [PMC free article] [PubMed] [Google Scholar]
- 19.de Lima M, Couriel D, Thall PF, Wang X, Madden T, Jones R, et al. Once-daily intravenous busulfan and fludarabine: clinical and pharmacokinetic results of a myeloablative, reduced-toxicity conditioning regimen for allogeneic stem cell transplantation in AML and MDS. Blood. 2004;104:857–64. doi: 10.1182/blood-2004-02-0414. [DOI] [PubMed] [Google Scholar]
- 20.Andersson BS, de Lima M, Thall PF, Wang X, Couriel D, Korbling M, et al. Once daily i.v. busulfan and fludarabine (i.v. Bu-Flu) compares favorably with i.v. busulfan and cyclophosphamide (i.v. BuCy2) as pretransplant conditioning therapy in AML/MDS. Biol Blood Marrow Transplant. 2008;14:672–84. doi: 10.1016/j.bbmt.2008.03.009. [DOI] [PMC free article] [PubMed] [Google Scholar]
- 21.Byrd JC, Mrozek K, Dodge RK, Carroll AJ, Edwards CG, Arthur DC, et al. Pretreatment cytogenetic abnormalities are predictive of induction success, cumulative incidence of relapse, and overall survival in adult patients with de novo acute myeloid leukemia: results from Cancer and Leukemia Group B (CALGB 8461) Blood. 2002;100:4325–36. doi: 10.1182/blood-2002-03-0772. [DOI] [PubMed] [Google Scholar]
- 22.Grimwade D, Hills RK, Moorman AV, Walker H, Chatters S, Goldstone AH, et al. Refinement of cytogenetic classification in acute myeloid leukemia: determination of prognostic significance of rare recurring chromosomal abnormalities among 5876 younger adult patients treated in the United Kingdom Medical Research Council trials. Blood. 2010;116:354–65. doi: 10.1182/blood-2009-11-254441. [DOI] [PubMed] [Google Scholar]
- 23.Kaplan EL, Meier P. Nonparametric estimaion from incomplete observations. J Amer Statist Assoc. 1958;53:457–81. [Google Scholar]
- 24.Alatrash G, Pelosini M, Saliba RM, Koca E, Rondon G, Andersson BS, et al. Platelet recovery before allogeneic stem cell transplantation predicts posttransplantation outcomes in patients with acute myelogenous leukemia and myelodysplastic syndrome. Biol Blood Marrow Transplant. 2011;17:1841–5. doi: 10.1016/j.bbmt.2011.05.018. [DOI] [PMC free article] [PubMed] [Google Scholar]
- 25.Stikvoort A, Gertow J, Sundin M, Remberger M, Mattsson J, Uhlin M. Chimerism Patterns of Long-Term Stable Mixed Chimeras Post Hematopoietic Stem Cell Transplantation in Patients with Nonmalignant Diseases: Follow-up of Long-Term Stable Mixed Chimerism Patients. Biol Blood Marrow Transplant. 2013;19:838–44. doi: 10.1016/j.bbmt.2013.02.015. [DOI] [PubMed] [Google Scholar]
- 26.Kreyenberg H, Holle W, Mohrle S, Niethammer D, Bader P. Quantitative analysis of chimerism after allogeneic stem cell transplantation by PCR amplification of microsatellite markers and capillary electrophoresis with fluorescence detection: the Tuebingen experience. Leukemia. 2003;17:237–40. doi: 10.1038/sj.leu.2402761. [DOI] [PubMed] [Google Scholar]
Associated Data
This section collects any data citations, data availability statements, or supplementary materials included in this article.