Abstract
Recent electrophysiological studies in monkeys have implicated the prefrontal cortex (PFC) and posterior parietal cortex (PPC) in numerical judgments. The functional organization and respective contributions of these (and other) cortical areas, however, are unknown; their neural activity during numerical judgments has not been directly compared. We surveyed activity in the PPC and the anterior inferior temporal cortex while monkeys performed a visual numerosity judgment task and compared it with a population of PFC neurons. In the PPC, the proportion of numerosity-selective neurons was highest in the fundus of the intraparietal sulcus; only few numerosity-selective neurons were found in other PPC areas or the anterior inferior temporal cortex. Further, neurons in the fundus of the intraparietal sulcus responded and conveyed numerosity earlier than PFC neurons, suggesting that numerosity information flows from the PPC to the lateral PFC. This finding suggests a parieto-frontal network for numerosity in monkeys and establishes homologies between the monkey and human brain.
The ability to discriminate quantities found in both human infants (1-3) and animals (4-6) supports the idea that numerical competence is an ontogenetically and phylogenetically early faculty. Neurophysiological studies in monkeys have identified candidate neural correlates in the prefrontal cortex (PFC) (7,8) and posterior parietal cortex (PPC) (9,10), but their functional organization and respective contributions are still unknown; it is not even clear where in the cortical hierarchy numerosity is first extracted. For example, the PPC provides the PFC with a major source of visual input (11-14), as does the anterior inferior temporal cortex (aITC) (15, 16), and it, in turn, sends feedback projections to both. Thus, numerical information might first be extracted in sensory cortex (e.g., in the PPC, aITC, or before) and simply conveyed to the PFC. Alternatively, numerical information could be first extracted in the PFC and then fed back to areas like the PPC.
It is also unclear as to whether the human and monkey brains are homologous in numerical processing. Neuropsychology and brain imaging in humans implicate both the PPC and PFC, but indicate a greater role for the PPC (17-23). By contrast, monkey neurophysiology studies have drawn different conclusions about their importance. A recent study (10) reported neurons encoding the number of lever movements in a sensorimotor PPC region [the superior parietal lobule (SPL), area 5], but few in the lateral PFC (LPFC). We (7) instead found many LPFC neurons that encoded the number of visual items, but few in a visual PPC region [the inferior parietal lobule (IPL), area 7a]. There are several possible explanations for this discrepancy. There might be a specialization of the PPC and LPFC for sensorimotor versus visual numerosity, respectively. Or, it could indicate greater LPFC involvement in abstraction; the SPL neurons tended to be highly specific for the type of movement (10). Or, it may be that the PPC plays a primary role in numerosity in humans, but there is more distributed processing in monkeys. All these basic questions of the functional organization of numerosity remain because there has been neither a detailed survey of neural properties of the monkey PPC nor any direct comparisons between it, the PFC, and the aITC.
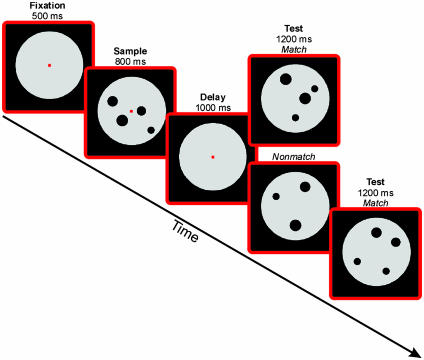
We trained two monkeys to perform a visual numerosity judgment task (Fig. 1, see Methods) while we surveyed activity across large parts of the PPC and the aITC. We compared them with a population of LPFC neurons recorded from the same monkeys and discussed in a prior report (7). To prevent the monkeys from solving the task by extracting low-level visual features of the displays, nonnumerical cues like spatial arrangement, total area, total circumference, density, and identity of the items were controlled. The monkeys' discrimination performance was not affected in such control trials (7), indicating that they solved the task based on abstract numerical information. A total of 612 PPC neurons and 145 aITC neurons (area TE) were studied during task performance and compared with a previously reported population of 309 LPFC neurons (7).
Fig. 1.
Delayed match-to-numerosity task. A monkey held a lever and fixated a small fixation spot at the center of the computer monitor to start a trial. The first display (sample) was followed by a memory delay period and then a test display appeared. There was a 50% probability that the test contained the same number of items as the sample (a match). If it was a match, the monkey released the lever to receive a reward. If it was a nonmatch, the monkey continued to hold the lever until a second test display appeared, which was always a match and required a lever release to receive a reward. A nonmatch contained, with equal probability, one more or one less item, except for “one” and “five.”
Methods
Stimuli. Monkeys viewed a sequence of two displays (diameter: 8° of visual angle) separated by a memory delay and were required to judge whether the displays contained the same small number of items (1 to 5). Each quantity was tested with 100 different images per session and the sample and test displays on a given trial were never identical so monkeys could not simply match patterns. To further ensure that monkeys solved the task by judging numerosity per se rather than simply memorizing sequences of visual patterns or paying attention to low-level visual features that correlate with number, we used two types of stimulus manipulations. We randomly varied the position of the items over 24 locations centered around the monkey's center of gaze as well as randomly varied the items between five different sizes. We also used eight sets of stimuli that, across them, controlled for changes in total area of the items, total circumference, density, and exact appearance (7).
In addition, we analyzed the images for spectral cues that may co-vary with increasing numerosities. The 2D amplitude spectrum of original images was derived by taking the absolute value of the images' 2D Fourier transform. Next, the 2D correlation coefficient was computed between the 2D amplitude spectra of images of different numerosity. The 2D correlation coefficients were determined between sample images of a given numerosity and compared with the correlation coefficients for the sample images of the same numerosity with images of its nonmatch numerosities. For example, for sample numerosity “three,” the correlation coefficients between images containing three dots were compared with the correlation coefficients between images containing four and two dots. The three means of the correlation coefficients for 105 comparisons per group were then tested with a Kruskal-Wallis test at P < 0.05. Numerosity 1 turned out to contain different spectral components in all of the stimulus sets, and in most sets, the frequency spectrum covaried with increasing numbers of items. However, no systematic change in spectral components was detected for numerosities 2-5 for the linear arrangement stimulus set (7). Thus, the linear arrangement stimulus set controlled for spatial frequency cues. As monkeys (and their neurons) were able to generalize performance to this set (7), this result suggests that they were not using spatial frequency cues.
Behavioral Protocol. Trials were randomized and balanced across all relevant features. Each monkey performed between 500 and 800 correct trials per recording session. Monkeys had to keep their gaze within 1.25° of the fixation point during sample presentation and the memory delay [monitored with an ISCAN (Burlington, MA) infrared eye tracking system]. See Fig. 1 for further details.
Recording Method. Recordings were made from four hemispheres of the PPC and three hemispheres of the aITC of two adult rhesus monkeys (Macaca mulatta) in accordance with the National Institutes of Health and Massachusetts Institute of Technology guidelines for animal experimentation. Arrays of up to eight tungsten microelectrodes (FHC) attached to screw microdrives were inserted by using a grid (Crist Instruments) with 1-mm spacing. The ultra fine thread on the screw drives moved the electrode 300 μm every 360° turn of the screw. This method allowed us to get accurate depth measurements for our recordings. Detailed measurements of the depth at which we encountered neurons were taken, and reference depth measures were taken when the dura was penetrated as well as when the electrodes were pulled up and left the tissue. Recording sites were anatomically reconstructed by using structural magnetic resonance images taken from each monkey before implantation. We used image processing software that allowed to reconstruct the recording sites in 3D and to determine the exact stereotaxic coordinates of all of the anatomical landmarks, the recording chamber, and each recording penetration. This method gives high localization precision, as has been shown by a direct comparison of landmarks in scans and in vivo brain examination (24). At the intraparietal sulcus (IPS), recording sites 4-8 mm below the cortical surface during electrode penetrations made parallel to the sulcus were assigned the lateral and medial wall of the IPS, respectively. Recordings at a depth of 8-12 mm below the cortical surface were determined as the fundus of the IPS (F-IPS). The majority of data were recorded simultaneously and alternately in two of the three recording locations. In addition, we monitored the monkeys' performances, which was remarkably stable throughout the course of recording based on extensive prior training. Neurons were selected at random; no attempt was made to search for task-related activity. Waveform separation was performed offline by applying principal component analysis (Plexon Systems).
Data Analysis. Sample activity was averaged across an 800-ms interval starting 100 ms after stimulus onset. Delay activity was summed over an 800-ms interval starting 200 ms after sample offset. Neural filters were normalized by setting the maximum activity to the most preferred numerosity as 100% and the activity to the least preferred numerosity as 0%. Neural response latencies were derived from peristimulus time histograms. Neural response latency was defined by the first of three consecutive 1-ms time bins that reached 3 SD above baseline rate (average activity in the 500 ms preceding sample onset). The latency of numerosity selectivity was measured in two different ways. First, we performed a sliding Kruskal-Wallis test (kernel bin width = 50 ms, slid in 1-ms increments). Numerosity selectivity latency was defined by the first time bin after sample onset where the test showed significant differences (at P < 0.01) in response to one of the five numerosities. Second, the time course of numerosity selectivity was examined by using a sliding receiver operating characteristic (ROC) analysis (25-27). For each neuron, the two spike rate distributions for the preferred (true-positive rate) and least preferred numerosity (false-positive rate) were compared. To obtain the ROC curve, the probability of true-positives were plotted as a function of the probability of false-positives in 1 spike per sec bins. The area under the ROC curve (AUC) was taken as a quantitative measure of how well the two distributions were separated, and, in other words, how well a neuron discriminated between the preferred and the least preferred numerosity. An AUC of 0.5 represents identical distributions (no discrimination), and an AUC of 1.0 indicates completely separated distributions (perfect discrimination). The sliding ROC analysis (kernel width 50 ms, slid in 1-ms increments) was performed to derive a neuron's AUC at each time point during the presample and sample period. The threshold was calculated as the mean AUC plus 3 SD derived in a 200-ms interval (pure fixation) before sample onset. The numerosity selectivity latency was defined as the time after sample onset at which this threshold was exceeded.
Results
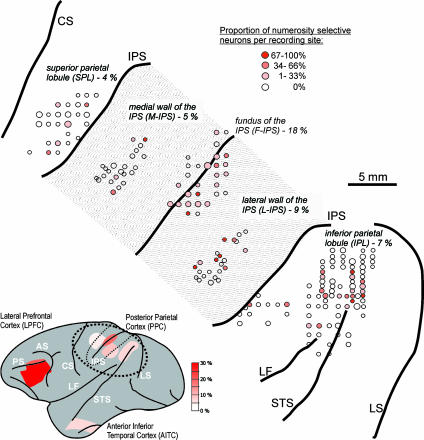
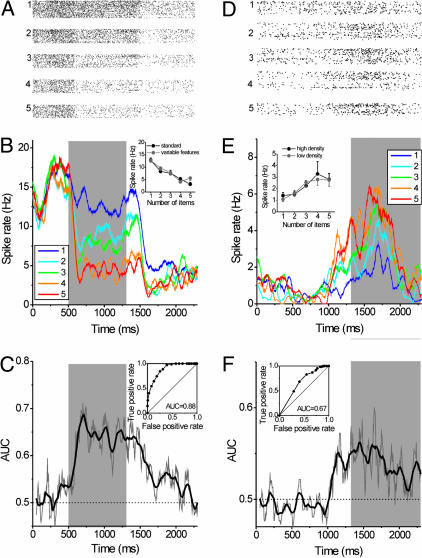
PPC. Neurons were sampled from the SPL and IPL, as well as the IPS (Fig. 2). Each neuron was tested with two of eight stimulus sets that, across them, controlled for changes in low-level visual features (see above). We found PPC neurons that, like LPFC neurons (7, 8), encoded visual numerosity. They discharged maximally to a preferred numerosity and showed a progressive decline of activity with increasing numerical distance from it (Fig. 3 A and B and D and E). We identified numerosity-selective neurons by using a two-factor ANOVA with numerosity and stimulus set as factors (evaluated at P < 0.01, see Methods); they were defined as showing a significant effect of numerosity but no main effect of, or interaction with, changes in stimulus set (i.e., no selectivity for visual features) in their average activity across the sample and/or delay intervals. Of the 70 PPC neurons that showed a main effect of numerosity in the sample epoch, only 24% showed a main effect or interaction with stimulus set, indicating that most of them generalized numerosity across changes in the exact appearance of the displays.
Fig. 2.
Location of recording sites. (Lower) Lateral view of a monkey brain showing the recording sites in the LPFC, PPC, and aITC. The proportions of numerosity-selective neurons in each area are color coded. (Upper) Magnified region of the PPC (encircled region of brain image) with the IPS unfolded showing the detailed location of recordings sites in the parietal lobe. The percentage of numerosity-selective cells is noted for each area. The size of the circles indicates the number of units recorded at a given location (usually more than one neuron was recorded at a given site), the redness indicates the proportion of numerosity selectivity found at each location. (Note that the relatively larger number of recording sites in the IPL may cause the erroneous impression of a large proportion of numerosity selectivity.) AS, arcuate sulcus; CS, central sulcus; LF, lateral fissure; LS, lunate sulcus; PS, principal sulcus; STS, Superior temporal sulcus.
Fig. 3.
Example numerosity-selective neurons from the F-IPS. Neuron 1 (A-C) was selective during sample presentation, neuron 2 (D and E) was selective in the memory delay. For each neuron, the dot-raster histograms for numerosities 1-5 (A and D), the spike-density displays (100-ms boxcar smoothing window; B and E), and the AUC derived from the sliding ROC analysis (C and F) are shown. Insets in B and E display the spike-rate functions (average activity and SE of the mean) to the two stimulus protocols across the sample or delay interval, respectively. Both neurons generalized across changes in stimulus sets. (C and F) The AUC is plotted as function of time for the sliding ROC analysis. The gray line represents the measured AUC values in a 50-ms window slid in 5-ms increments over the trial period. The thick black line was derived by smoothing the original data by adjacent averaging (20 data points smoothing window). (Insets) The ROC curves for the entire sample (C) and delay (F) period.
Visual numerosity-selective neurons were not uniformly distributed across the PPC. Fig. 2 shows their distribution across the PPC, and Table 1 shows their proportions by area. In contrast to previous reports of abundant sensorimotor numerosity-selectivity in the SPL (10), we found the proportion of visual numerosity-selective SPL neurons did not differ from chance (χ2 test, P > 0.05). The largest proportion of such neurons was found in the F-IPS (Table 1 and Fig. 2); numerosity-selective neurons were found in the majority of recording sites in the F-IPS, whereas for other PPC areas they were only found at a minority of recording sites. Furthermore, almost 20% of the neurons encountered in F-IPS were defined as numerosity selectivity (according to the ANOVA described above), which is the highest proportion of numerosity-selective neurons we found in the PPC; only the LPFC had a higher proportion (Table 1).
Table 1. Numerosity selectivity in different areas of the monkey cortex.
| Sample
|
Delay
|
|||||||
|---|---|---|---|---|---|---|---|---|
| Area | n | Numerosity-selective | Only numerosity-selective* | Percent | Numerosity-selective | Only numerosity-selective* | Percent | Average, % |
| IPL | 252 | 17 | 15 | 6 | 18 | 18 | 7 | 7 |
| L-IPS | 77 | 11 | 10 | 13 | 4 | 4 | 5 | 9 |
| F-IPS | 121 | 29 | 21 | 17 | 29 | 23 | 19 | 18 |
| M-IPS | 76 | 10 | 4 | 5 | 8 | 4 | 5 | 5 |
| SPL | 86 | 3 | 3 | 3 | 5 | 4 | 5 | 4 |
| aITC | 145 | 23 | 12 | 8 | 10 | 9 | 6 | 7 |
| LPFC† | 309 | 116 | 98 | 32 | 103 | 91 | 29 | 30 |
L-IPS, later wall of the IPS; M-IPS, medial wall of the IPS.
Excludes numerosity-selective cells that did not generalize across displays (i.e., showed a significant stimulus type effect or interaction between numerosity and stimulus type, see text).
Data are from ref. 7.
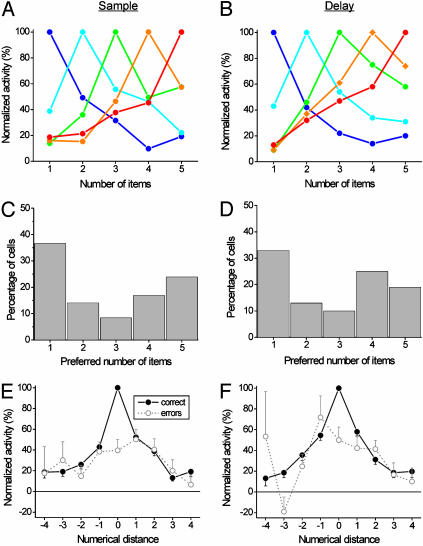
PPC neurons exhibited properties similar to those found in the LPFC (7, 8). They showed numerosity-tuning curves that formed a bank of overlapping numerosity filters, during both the delay and the sample period (Fig. 4 A and B). Also, as in the LPFC, across the population, PPC neurons covered the entire tested range of numerosities, albeit with “one” preferred by the modal neurons (Fig. 4 C and D). The proportion of PPC neurons that exhibited significant numerosity selectivity during the sample and delay intervals was about equal (Table 1). PPC neurons showed a significant decrease in the activity on error trials (Fig. 4 E and F). The average spike rate was reduced by 19% and 20% during sample and delay period, respectively, corresponding to a 60% and 50% reduction in the normalized firing rate (P < 0.001, two-tailed Wilcoxon test). This result was also found in the LPFC (7) and suggests a direct relationship between PPC activity and task performance.
Fig. 4.
Response properties of numerosity-selective PPC neurons. The normalized average activity of all neurons formed a bank of overlapping numerosity filters in the sample (A) and delay (B) periods. (C and D) Distributions of preferred numerosities in the sample and delay periods. (E and F) Normalized average tuning function across all preferred numerosities and selective neurons for the sample and delay epoch, respectively. Functions for correct (solid lines) and error trials (dotted lines) are shown. Error bars indicate SE across cells.
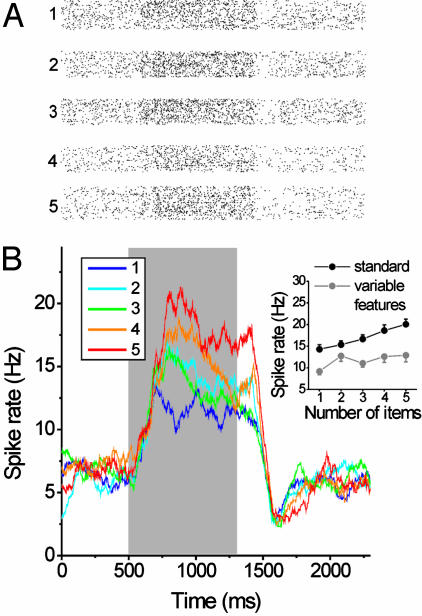
aITC. For comparison, we also recorded from the aITC. By contrast to the PPC and LPFC, only 8% (12 of 145) and 6% (9 of 145) of aITC neurons were numerosity selective during the sample and delay intervals, respectively (as defined by the above ANOVA). Even more striking was the observation that nearly half (48%) of the neurons showing a significant main effect of numerosity also exhibited a main effect of, or interaction with, changes in stimulus type. Fig. 5 shows a representative unit with a significant stimulus type effect in addition to a numerosity effect. Thus, it seems that aITC neurons are primarily sensitive to the physical appearance of the displays and do not extract numerosity information per se.
Fig. 5.
Representative neuron from the aITC. The dot-raster display (A), the spike-density function (B), and the spike-rate functions to the two stimulus protocols (B Inset) are shown. The neuron did not encode numerosity in an abstract fashion because it showed clearly different spike rates for numerosities cued with the standard versus the variable features protocol.
Comparison of Neuronal Properties in the PPC and PFC. To clarify the respective contributions of PPC neurons in numerical processing, we compared their response characteristics with a population of LPFC neurons recorded from the same animals (7). Overall, the proportion of numerosity-selective neurons was significantly greater in the LPFC than in any PPC region tested (χ2 test, P < 0.01, Table 1).
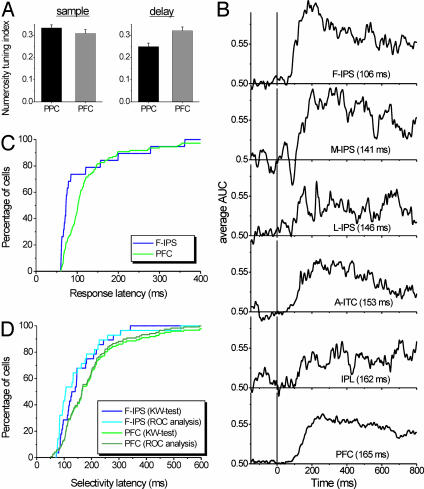
The tuning strength (see Methods) of numerosity-selective neurons (Fig. 6A) was equal in the LPFC and PPC during the sample epoch (average tuning index: 0.33 and 0.31 in the PPC and LPFC, respectively; P > 0.1, two-tailed Mann-Whitney U test), but stronger in the LPFC during the memory delay (LPFC average index = 0.32, PPC average index = 0.25; P < 0.05, two-tailed Mann-Whitney U test). Indeed, as noted above, numerosity-selective PPC neurons seemed to have identical tuning properties as their counterparts in the LPFC.
Fig. 6.
Comparison of numerosity-selective neurons in the LPFC and PPC. (A) Average numerosity-tuning indices (see Methods) for PPC and LPFC neurons that were numerosity selective during the sample and delay interval. (B) Average AUC derived from the sliding ROC analysis for all recording areas. Brain regions are sorted according to their selectivity latencies. (C) Cumulative distribution of response latencies for F-IPS and LPFC neurons that were numerosity selective during the sample interval. (D) Cumulative distribution of numerosity-selectivity latencies for F-IPS and LPFC neurons during the sample interval. Latencies were measured by a sliding ROC analysis as well as a sliding Kruskal-Wallis test.
A comparison of neural latencies revealed differences between areas; we found that numerosity information appeared in the PPC before the LPFC. Fig. 6B shows average sliding ROC analyses (see Methods) of the time course of numerosity selectivity for numerosity-selective cells in each PPC subarea, the aITC, and the LPFC. The largest difference in latencies was observed between the two areas where we found the highest proportion of numerosity-selective neurons, the F-IPS and LPFC. Specifically, numerosity information appeared first in the F-IPS (median numerosity-selectivity latency = 106 ms, based on a sliding ROC analysis, see Methods and below) and then in the LPFC (median = 165 ms).
We explored this area in more detail by creating cumulative distributions of the latency for individual numerosity-selective neurons in the F-IPS and LPFC to become activated (i.e., their response latency, Fig. 6C) and convey numerosity information (Fig. 6D; see Methods). An examination of these figures illustrates that the population of F-IPS neurons had shorter latencies than the population of LPFC neurons. These differences were confirmed by statistical analysis. The median response latencies of numerosity-selective F-IPS cells (73 ms) were significantly shorter than that of numerosity-selective LPFC cells (median 102 ms, P < 0.02, two-tailed Mann-Whitney U test). Perhaps more importantly, however, F-IPS neurons showed significantly shorter latencies to convey numerosity information than LPFC neurons. This finding was confirmed by performing two separate statistical tests: a sliding ROC analysis and a sliding Kruskal-Wallis test (see Methods). Based on the sliding ROC analysis (see Figs. 2 C and F and 6B), F-IPS neurons, on average, discriminated between numerosities 59 ms earlier than LPFC neurons (median selectivity latency for F-IPS = 106 ms, median for LPFC = 165 ms for LPFC, P = 0.006, two-tailed Mann-Whitney U test, see also Fig. 6B). The sliding Kruskal-Wallis test gave a similar result; F-IPS neurons, on average, discriminated between numerosities 27 ms earlier than LPFC neurons (the median selectivity latency for F-IPS = 135 ms, median LPFC = 161 ms, P = 0.05, two-tailed Mann-Whitney U test). The results of both tests are plotted on Fig. 6D. The similarity of the results suggests that the latency differences are indeed robust. The other PPC areas and the aITC displayed intermediate latencies (Fig. 6B). However, these differences did not reach significance, perhaps because of the relatively low number of numerosity-selective cells found in those areas. On average, then, numerosity neurons responded earlier, and numerosity information appeared earlier in at least one PPC area (the F-IPS) than in the LPFC.
Discussion
In this study, we report that the number of neurons whose activity reflected small numbers of visual items were proportionally higher in a relative discrete region of the PPC, the F-IPS. They were not as common in other regions of the parietal cortex or in the aITC. A comparison of response characteristics between cortical areas revealed faster responses to and earlier differentiation of numerosities by F-IPS neurons compared with LPFC neurons. This finding suggest the F-IPS as the prime source of numerosity processing, at least relative to the LPFC, where we had previously reported an abundance of numerosity-selective neurons (7, 8).
Our findings complement a report about abundant sensorimotor number encoding in the SPL, area 5. Sawamura et al. (10) trained monkeys to alternate between five arm movements of one type and five of another. They found neurons in a somato-sensory-responsive region of the SPL that kept track of the movement number (areas inside the IPS were not surveyed in this study). One possibility for the difference between this study and our data may be modality (touch versus vision), but another may be the level of abstraction. Most neurons (85%) representing movement number were not “abstract;” number-selective activity depended on whether the monkey's movement was “push” or “turn.” By contrast, the visual numerosity representations found in the F-IPS were abstract and generalized; changes in the physical appearance of the displays had little effect on activity of the majority of numerosity-tuned neurons. Whether there is modality-specific numerical processing in the PPC (F-IPS for visual numerosity, the SPL for sensorimotor number) needs to be directly determined, but the F-IPS would be an ideal candidate structure to integrate supramodal numerical information. It receives visual, auditory, and somatic input (28-31).
We previously reported numerosity-selective neurons in the LPFC (7, 8), which is functionally interconnected with the PPC (11-14) (and ITC) (15,16), but a comparison of LPFC neural properties with those in the PPC revealed some important differences. PPC numerosity-encoding neurons, on average, were activated and conveyed numerosity information sooner than their LPFC counterparts. However, in the LPFC, visual quantity was reflected in a greater proportion of neurons across a wider expanse of cortex and they exhibited stronger numerosity tuning in the memory delay (i.e., working memory). This comparison between the PPC, aITC, and LPFC brings their respective roles into clearer focus. It suggests that visual quantity may be extracted first in the parietal cortex. Then, it is conveyed, directly or indirectly, to the LPFC, where the representation is expanded (in the sense that a greater number of neurons convey numerosity information) and held online (i.e., in working memory) to gain control over thought and action. Indeed, working memory of sensory magnitude is well represented by LPFC neurons; Romo and coworkers (32, 33) showed that many neurons fire with a rate that is a monotonic function of the frequency of a tactile stimulus. The aITC, by contrast, seems more involved in visual feature analysis (34); its neurons were more sensitive to the exact appearance of the displays than neurons in the F-IPS or the LPFC. This finding is consistent with a report that the LPFC has more abstract representations of visual categories than the ITC (35).
Our finding of a concentration of visual numerosity-encoding neurons in the IPS indicates close homologies between monkeys and humans. Recent structural and functional MRI studies suggest that in humans the IPS is the prime source for the analogical and abstract representation of numerical quantities. In a functional MRI study, Dehaene et al. (19) found greater IPS activation when subjects estimated the approximate result of an addition problem than when they computed its exact solution. Pinel et al. (22) reported that IPS activation is determined by numerical distance, independent of the notation used to convey quantity. Even in simple category detection tasks that do not require explicit numerical judgments, numbers compared with letters and colors activated a bilateral region in the horizontal segment of the IPS (23). This effect was robust even when these categories were presented in the visual domain (as written words) or in the auditory domain (as spoken words), arguing for a supramodal representation of number in the IPS (23). A structural brain imaging study confirmed that impairments in arithmetic ability correlates with anatomical abnormalities in the IPS (20).
Together, our data indicate parallels between humans and monkeys in numerical processing. Imaging studies suggest involvement of both the parietal and frontal lobes for numerical abilities in humans, but a primacy for the parietal lobe (19, 22, 23). The clustering of neurons in a corresponding region in monkeys and their shorter response and selectivity latencies compared with those of LPFC neurons is consistent with it being a prime source of numerical information in monkeys as well.
Acknowledgments
This work was supported by National Institute of Mental Health Grant 1-R01-MH65252-01 and the RIKEN-Massachusetts Institute of Technology Neuroscience Research Center. A.N. was supported by a Long-Term Fellowship of the Human Frontier Science Program and a grant from the Deutsche Forschungsgemeinschaft.
Abbreviations: PFC, prefrontal cortex; LPFC, lateral PFC; PPC, posterior parietal cortex; aITC, anterior inferior temporal cortex; SPL, superior parietal lobule; IPL, inferior parietal lobule; IPS, intraparietal sulcus; F-IPS, fundus of the IPS; ROC, receiver operating characteristic; AUC, area under the curve.
References
- 1.Wynn, K. (1998) Trends Cognit. Sci. 8, 296-303. [DOI] [PubMed] [Google Scholar]
- 2.Xu, F. & Spelke, E. S. (2000) Cognition 74, B1-B11. [DOI] [PubMed] [Google Scholar]
- 3.Wynn, K., Bloom, P. & Chiang, W. C. (2002) Cognition 83, B55-B62. [DOI] [PubMed] [Google Scholar]
- 4.Boysen, S. T. & Capaldi, E. J., eds. (1993) The Development of Numerical Competence: Animal and Human Models (Erlbaum, Hillsdale, NJ).
- 5.Hauser, M. D., MacNeilage, P. & Ware, M. (1996) Proc. Natl. Acad. Sci. USA 93, 1514-1517. [DOI] [PMC free article] [PubMed] [Google Scholar]
- 6.Brannon, E. M. & Terrace, H. S. (1998) Science 282, 746-749. [DOI] [PubMed] [Google Scholar]
- 7.Nieder, A., Freedman, D. J. & Miller, E. K. (2002) Science 297, 1708-1711. [DOI] [PubMed] [Google Scholar]
- 8.Nieder, A. & Miller, E. K. (2003) Neuron 37, 149-157. [DOI] [PubMed] [Google Scholar]
- 9.Thompson, R. F., Mayers, K. S., Robertson, R. T. & Patterson, C. J. (1970) Science 168, 271-273. [DOI] [PubMed] [Google Scholar]
- 10.Sawamura, H., Shima, K. & Tanji, J. (2002) Nature 415, 918-922. [DOI] [PubMed] [Google Scholar]
- 11.Petrides, M. & Pandya, D. N. (2002) Principles of Frontal Lobe Function, eds. Stuss, D. T. & Knight, R. T. (Oxford Univ. Press, Oxford).
- 12.Quintana, J., Fuster, J. M. & Yajeya, J. (1989) Brain Res. 503, 100-110. [DOI] [PubMed] [Google Scholar]
- 13.Quintana, J. & Fuster, J. M. (1999) Cereb. Cortex 9, 213-221. [DOI] [PubMed] [Google Scholar]
- 14.Chafee, M. V. & Goldman-Rakic, P. S. (2000) J. Neurophysiol. 83, 1550-1566. [DOI] [PubMed] [Google Scholar]
- 15.Ungerleider, L. G., Gaffan, D. & Pelak, V. S. (1989) Exp. Brain Res. 76, 473-484. [DOI] [PubMed] [Google Scholar]
- 16.Rodman, H. R. & Nace, K. L. (1997) Development of the Prefrontal Cortex, eds. Krasnegor, N. A., Lyon, G. R. & Goldman-Rakic, P. S. (Paul H. Brookes, Baltimore).
- 17.Cohen, L., Dehaene, S., Chochon, F., Lehericy, S. & Naccache, L. (2000) Neuropsychologia 38, 1426-1440. [DOI] [PubMed] [Google Scholar]
- 18.Dehaene, S., Dehaene-Lambertz, G. & Cohen, L. (1998) Trends Neurosci. 21, 355-361. [DOI] [PubMed] [Google Scholar]
- 19.Dehaene, S., Spelke, E., Pinel, P., Stanescu, R. & Tsivkin, S. (1999) Science 284, 970-974. [DOI] [PubMed] [Google Scholar]
- 20.Isaacs, E. B., Edmonds, C. J., Lucas, A. & Gadian, D. G. (2001) Brain 124, 1701-1707. [DOI] [PubMed] [Google Scholar]
- 21.Zorzi, M., Priftis, K. & Umilta, C. (2002) Nature 417, 138-139. [DOI] [PubMed] [Google Scholar]
- 22.Pinel, P., Dehaene, S., Riviere, D. & LeBihan, D. (2001) NeuroImage 14, 1013-1026. [DOI] [PubMed] [Google Scholar]
- 23.Eger, E., Sterzer, P., Russ, M. O., Giraud, A. L. & Kleinschmidt, A. (2003) Neuron 37, 719-725. [DOI] [PubMed] [Google Scholar]
- 24.Scherberger, H., Fineman, I., Musallam, S., Dubowitz, D. J., Bernheim, K. A., Pesaran, B., Corneil, B. D., Gilliken, B. & Andersen, R, A. (2003) J. Neurosci. Methods 130, 1-8. [DOI] [PubMed] [Google Scholar]
- 25.Green, D. M. & Swets J. A. (1966) Signal Detection Theory and Psychophysics (Wiley, New York).
- 26.Tolhurst, D. J., Movshon, J. A. & Dean, A. F. (1983) Vision Res. 23, 775-785. [DOI] [PubMed] [Google Scholar]
- 27.Vogels, R. & Orban, G. A. (1990) J. Neurosci. 10, 3543-3558. [DOI] [PMC free article] [PubMed] [Google Scholar]
- 28.Colby, C. L., Duhamel, J.-R. & Goldberg, M. E. (1993) J. Neurophysiol. 69, 902-914. [DOI] [PubMed] [Google Scholar]
- 29.Duhamel, J. R., Colby, C. L. & Goldberg, M. E. (1998) J. Neurophysiol. 79, 126-136. [DOI] [PubMed] [Google Scholar]
- 30.Lewis, J. W. & Van Essen, D. C. (2000) J. Comp. Neurol. 428, 112-137. [DOI] [PubMed] [Google Scholar]
- 31.Bremmer, F., Schlack, A., Shah, N. J., Zafiris, O., Kubischik, M., Hoffmann, K., Zilles, K. & Fink, G. R. (2001) Neuron 29, 287-296. [DOI] [PubMed] [Google Scholar]
- 32.Romo, R., Brody, C. D., Hernandez A. & Lemus L. (1999) Nature 399, 470-473. [DOI] [PubMed] [Google Scholar]
- 33.Brody, C. D., Hernandez, A., Zainos, A. & Romo, R. (2003) Cereb. Cortex 13, 1196-1207. [DOI] [PubMed] [Google Scholar]
- 34.Tanaka, K. (1996) Annu. Rev. Neurosci. 19, 109-139. [DOI] [PubMed] [Google Scholar]
- 35.Freedman, D. J., Riesenhuber, M., Poggio, T. & Miller, E. K. (2003) J. Neurosci. 23, 5235-5246. [DOI] [PMC free article] [PubMed] [Google Scholar]


