Abstract
The dentate gyrus serves as a gateway to the hippocampus, filtering and processing sensory inputs as an animal explores its environment. The hilus occupies a strategic position within the dentate gyrus from which it can play a pivotal role in these functions. Inputs from dentate granule cells converge on the hilus, and excitatory hilar mossy cells redistribute these signals back to granule cells to transform a pattern of cortical input into a new pattern of output to the hippocampal CA3 region. Using voltage-sensitive dye to image electrical activity in rat hippocampal slices, we explored how long-term potentiation (LTP) of different excitatory synapses modifies the flow of information. Theta burst stimulation of the perforant path potentiated responses throughout the molecular layer, but left responses in the CA3 region unchanged. By contrast, theta burst stimulation of the granule cell layer potentiated responses throughout the molecular layer, as well as in the CA3 region. Theta burst stimulation of the granule cell layer potentiated CA3 responses not only to granule cell layer stimulation but also to perforant path stimulation. Potentiation of responses in the CA3 region reflected NMDA receptor-dependent LTP of upstream synapses between granule cells and mossy cells, with no detectable contribution from NMDA receptor-independent LTP of local CA3 mossy fiber synapses. Potentiation of transmission to the CA3 region required LTP in both granule cell→mossy cell and mossy cell→granule cell synapses. This bidirectional plasticity enables hilar circuitry to regulate the flow of information through the dentate gyrus and on to the hippocampus.
Keywords: dentate gyrus, granule cells, hilus, long-term potentiation, mossy cells, voltage imaging
Introduction
The dentate gyrus performs the first stage of processing of sensory information entering the hippocampus. Its principal neurons, dentate granule cells (GCs), receive perforant path (PP) input from the entorhinal cortex, and transmit an output to the CA3 region via mossy fiber axons. GCs have a high threshold, enabling the dentate gyrus to filter and select patterns of activity for further processing (Hsu, 2007; Leutgeb and Leutgeb, 2007) and to impede the spread of seizures (Heinemann et al., 1992; Lothman et al., 1992; Ang et al., 2006; Dudek and Sutula, 2007). These filtering and processing functions remain poorly understood, but it is unlikely that the dentate gyrus performs these tasks simply by mapping PP inputs to GCs; additional circuitry is required. GC axons branch extensively within the hilus (Claiborne et al., 1990) and innervate inhibitory interneurons and mossy cells (MCs) (Ribak et al., 1985; Acsády et al., 1998). Excitatory MCs reciprocate through synapses to GCs to complete a pathway of recurrent excitation (Scharfman et al., 1990; Scharfman, 1995; Jackson and Scharfman, 1996). This network, referred to here as the GC→MC→GC circuit, lies downstream from the PP where it can amplify and process these inputs to shape the output to the CA3 region (Buckmaster and Schwartzkroin, 1994; Henze and Buzsáki, 2007; Larimer and Strowbridge, 2010; Scharfman and Myers, 2013). The GC→MC→GC circuit equips the dentate gyrus with powerful processing potential and can shape hippocampal signaling at the first stage of the trisynaptic circuit.
Synaptic plasticity in the GC→MC→GC circuit could profoundly alter dentate gyrus processing. However, the reciprocal nature of this circuit complicates the study of plasticity. GCs and MCs sum monosynaptic and polysynaptic responses to obscure the identity of modified synapses. This prompts the question, does long-term potentiation (LTP) of PP responses (Bliss and Gardner-Medwin, 1973; Derrick, 2007) reflect LTP of PP→GC synapses, or GC→MC→GC synapses, or both in combination? LTP has been reported in MC synapses, and this plasticity can influence transmission through the hippocampus (Kleschevnikov and Routtenberg, 2003; Lysetskiy et al., 2005). Addressing such questions requires circuit level experimental methods to monitor multiple synaptic pathways simultaneously. The present study used voltage-sensitive dye imaging (Grinvald et al., 1988; Jin et al., 2002) to map the spatial distribution of potentiation induced by theta burst stimulation (TBS) (Chang and Jackson, 2006). Voltage imaging experiments with pharmacological manipulations, lesions, and multisite stimulation revealed synaptic contributions to responses at specific locations. TBS potentiated responses to PP stimulation without LTP of local PP→GC synapses. Responses in the CA3 region were potentiated without local LTP of mossy fiber synapses. LTP in the GC→MC→GC circuit potentiated transmission to the CA3 region, and this potentiation depended on LTP in both GC→MC and MC→GC synapses. Thus, the GC→MC→GC circuit modulates flow through the hippocampal trisynaptic circuit, and this modulation has a unique requirement for concomitant LTP of both GC→MC and MC→GC synapses. LTP of GC→MC→GC synapses regulates gating by the dentate gyrus in a manner that can influence the spread of seizures and modify how the dentate gyrus transforms patterns of input into patterns of output.
Materials and Methods
Hippocampal slice preparation.
Slice preparation from rat brains followed previously described procedures (Chang and Jackson, 2006). Animal care conformed to NIH guidelines and all procedures were approved by the Animal Care and Use Committee of the University of Wisconsin School of Medicine and Public Health. Male Sprague Dawley rats (4–7 weeks old) were decapitated following CO2-induced narcosis, and the brains chilled in ice-cold cutting solution [composition (in mm): 124 NaCl, 3.2 KCl, 26 NaHCO3, 1.25 NaH2PO4, 1 CaCl2, 6 MgSO4, and 10 glucose, bubbled with 95% O2-5% CO2]. Horizontal (or in some experiments coronal) slices (350–400 μm) were cut with a VT1200S tissue slicer (Leica). To reduce epileptiform activity, an incision was made in the CA3a region (distal to the dentate gyrus) unless stated otherwise. In some experiments, lesions were made through the outer and middle molecular layer (ML) to sever the PP (Jackson and Scharfman, 1996), as illustrated in Figure 4. Lesions were made with a scalpel under a dissecting microscope immediately after slicing. After ∼1 h in cutting solution at room temperature, slices were transferred to artificial CSF (aCSF) with composition identical to cutting solution except for 2.5 CaCl2 and 1.3 MgSO4. Slices were stained in bubbled aCSF that contained 0.05 mg/ml of voltage-sensitive absorbance dye RH 482 (absorbance maximum, 650 nm; NK3630, Hayashibara Biochemical Laboratories) for 45 min, and returned to aCSF. During recording, slices were submerged and continuously perfused with aCSF maintained at 29–32°C.
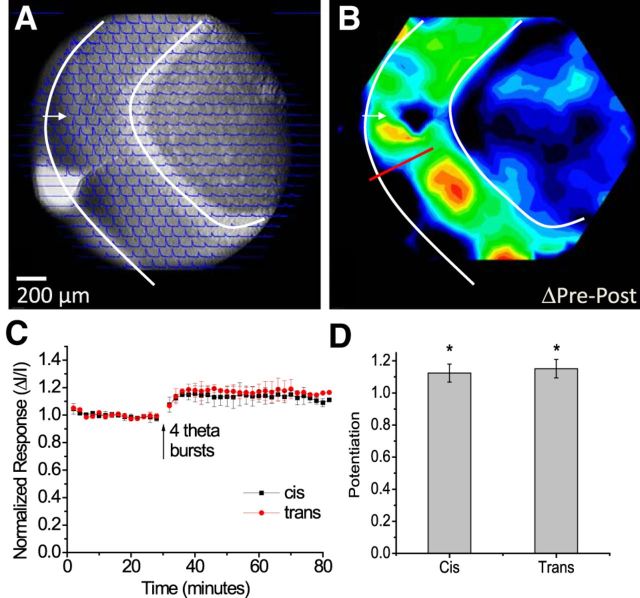
Figure 4.
Potentiation in a slice with a severed PP. A, A CCD image, with optical responses overlain, shows a slice with a cut from the hippocampal fissure to the inner ML (white arrow and curves as in Fig. 2A). Traces show responses to stimulation at the site indicated in the ML (50 μA, 0.2 ms). Responses spread across the cut, as reported previously (Jackson and Scharfman, 1996). B, Potentiation map as the difference between the pre-TBS and post-TBS response maps (as in Figs. 2F and 3F). The red line marks the lesion. TBS induced potentiation through most of the ML, including across the lesion. The map was normalized to its maximum and encoded as color following the scale in the bottom left corner. C, Plots of ΔI/I versus time from sites showing maximal potentiation in the ML of both the upper (cis-, same side as the cut) and lower (trans-, across the cut) blades, with TBS at the arrow (mean ± SEM; N = 11). D, Bars show the average potentiation as the post-TBS response normalized to the pre-TBS response, cis- and trans-. *p < 0.05.
Stimulation and recording.
Stimulation and field potential recordings were performed with aCSF-filled electrodes fabricated from borosilicate glass capillaries with 1.15 mm inner and 1.50 mm outer diameters, and tip diameters of 10–30 μm (for stimulating) or ∼1 μm (for recording). Slices were stimulated with 200 μs current pulses from a stimulus isolator (Model A365, World Precision Instruments). Increasing the stimulus current generally produced graded increases in optical response amplitudes until a plateau was reached where further increases produced very small increases. Stimulus current was adjusted in the range 50–100 μA to evoke approximately half-maximal field potentials. Optical responses near the stimulating electrode (<100 μm) were saturated, and further increases in stimulus current extended the zone where responses are maximal. Optical responses were 50–80% of maximal in the ML at distances of 100–500 μm from the stimulating electrode.
TBS, used to induce LTP, is comprised of four theta bursts at 10 s intervals. Each 2 s theta burst consisted of ten 50 ms subbursts delivered at 5 Hz and each subburst consisted of six pulses at 100 Hz. Test pulses and pulses during TBS always used the same current. Field potential recordings were made using an EPC-7 patch-clamp amplifier (Heka Instruments).
The GABAA receptor antagonist SR95531 (5 mm) was present in all experiments. Much stronger stimulation is required to induce LTP in the dentate gyrus without GABAA receptor blockade (Wigström and Gustafsson, 1983), and we found that TBS failed to potentiate responses in the dentate gyrus when inhibition was intact (data not shown).
Voltage imaging and data acquisition.
Voltage imaging methods were based on the methodology of Wu and Cohen (1993), as detailed by Chang and Jackson (2003). The instrumentation is similar to that supplied commercially by RedShirt Imaging, with 464 optical fibers bundled into a hexagonal array and coupled individually to Hamamatsu photodiodes with a center-to-center distance in field of view of 67 μm. Photocurrents were amplified to 5 V/nA, low-pass filtered at 500 Hz with a four-pole Bessel filter, multiplexed, and digitized at a frame rate of 10 kHz (DAP5200, Microstar Laboratories). An electronic shutter was opened 200 ms before initiating acquisition for 300 ms. Traces were averaged over four trials at 30 s intervals.
Slices were placed on the stage of an upright Reichert-Jung Diastar microscope illuminated by a 100 W tungsten-halogen bulb powered by a Kepco ATE 36–30DM power source. Illuminating light was passed through a 700 ± 25 nm bandpass filter, and transmitted light was captured with a 10× Olympus UPlanApo objective (NA = 0.40). Before each experiment, images were directed with a movable mirror to a CCD camera and captured with a frame grabber (Data Translation). A PC running an in-house computer program written in C++ was used for data acquisition, signal processing, and analysis (Chang, 2006). This program drove stimulation and controlled the shutter.
Data analysis.
Traces were filtered off-line with a temporal three-point binomial filter and a spatial Gaussian filter with a space constant of half the distance between diodes. To correct drift, the baselines were fitted with a third-order polynomial that was then subtracted. Peak optical signals were used to create color maps of responses and LTP in which red represented the greatest change and purple represented no change. The program Origin Pro (Microcal) was used for additional analysis and plotting.
Optical responses were presented as the change in transmitted light divided by the resting light intensity, ΔI/I, using the maximum value in a 200 ms time window starting at the stimulus. To evaluate the time course of potentiation, we first visualized the map of potentiation from a given experiment and identified six sites with the greatest potentiation in the ML (upper or lower blade) and CA3 region. The time course of ΔI/I was first averaged from these sites, and the averages were then averaged across experiments from all slices to produce the time course plots reported here. Error bars were computed on the basis of number of slices. Normalization to resting light and focusing on sites of maximum potentiation provided an objective basis for comparison between conditions, controlling for the inherent spatial nonuniformity of responses and potentiation within slices.
Drug application.
Drugs (purchased from Sigma) were applied to the aCSF, which perfused slices during experiments. SR95531 (5 μm) was present in all experiments to block GABAA receptors. In some experiments, APV (50 μm) was applied to block NMDA receptors.
Statistical analysis.
Statistical significance of LTP was assessed by one-way RM-ANOVA; and the means and SEM were presented. Normalized pre-TBS means of evoked responses (ΔI/I) were tested against normalized post-TBS means for significant differences. Statistical analysis was performed with Origin Pro. In all figures, * indicates statistical significance with p < 0.05.
Results
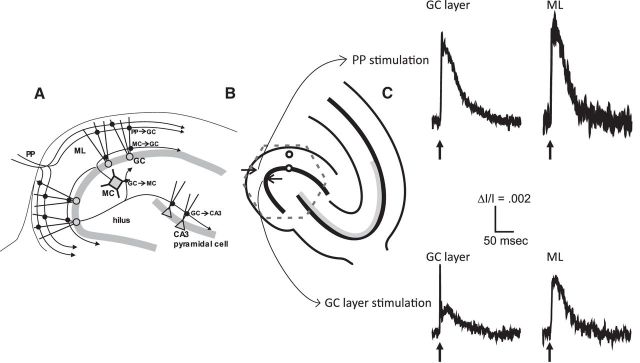
Figure 1A illustrates the key excitatory synapses of the dentate gyrus and serves as a useful guide to our design of experiments to probe the GC→MC→GC circuit. We selected a region for imaging illustrated by the dashed hexagon in Figure 1B. This region includes most of the dentate gyrus and the most proximal part of the CA3 region. Arrows illustrate the two stimulation sites used for nearly all our experiments, one in the GC layer and the other in the outer half of the ML, at the crest of the dentate gyrus. Stimulation of either site evoked responses through much of the field of view (Figs. 2A, 3A).
Figure 1.
A, Excitatory synaptic circuitry of the dentate gyrus. The PP innervates GC dendrites in the outer and middle ML to establish PP→GC synapses. GCs innervate MCs in the hilus with GC→MC synapses and pyramidal cells in the CA3 region with GC→CA3 synapses. MCs innervate GCs in the inner ML with GC→MC synapses. Interneurons are ignored here because experiments were performed in the presence of the GABAA receptor antagonist SR 95531. B, The experimental design is illustrated. The region selected for imaging is indicated by the dashed hexagon that contains most of the dentate gyrus and the proximal portion of the CA3 region. The two sites of stimulation are indicated by arrows and two sites from which representative traces were selected for C are indicated by small circles. C, Voltage-sensitive dye responses to PP stimulation (top) and GC layer stimulation (bottom) in the GC layer (left) and ML (right). The GC layer responses to GC layer stimulation have a sharp component arising from action potentials, whereas the ML responses do not.
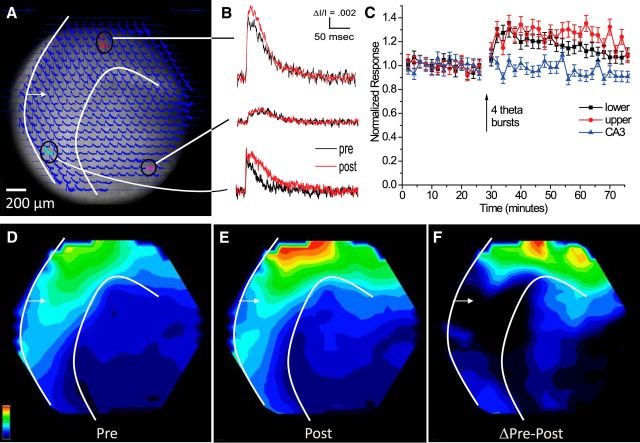
Figure 2.
Voltage imaging of responses and potentiation with PP stimulation. A, A CCD image of the dentate gyrus with optical traces overlain. The white arrow indicates the site of stimulation in the outer half of the ML; white curves mark the inner and outer borders of the ML (this panel and D–F). B, Selected optical traces in the lower blade (top), CA3 region (middle), and upper blade (bottom) before (black) and after (red) applying four TBS. Responses were evoked by electrical stimulation (100 μA, 0.2 ms). C, A plot of optical response amplitude (ΔI/I; mean ± SEM; N = 6 slices) versus time from sites showing maximal potentiation in the ML of the upper and lower blades, with the arrow indicating the time of TBS. D, E, Map of response amplitude before (D) and 20 min (E) after TBS. The scale in the bottom left corner indicates the color range, with red representing the largest amplitude and purple representing no response. The maps in D and E were both normalized to the maximum in the post-TBS map in E. F, A difference map (E minus D) shows the distribution of potentiation (normalized to its own maximum).
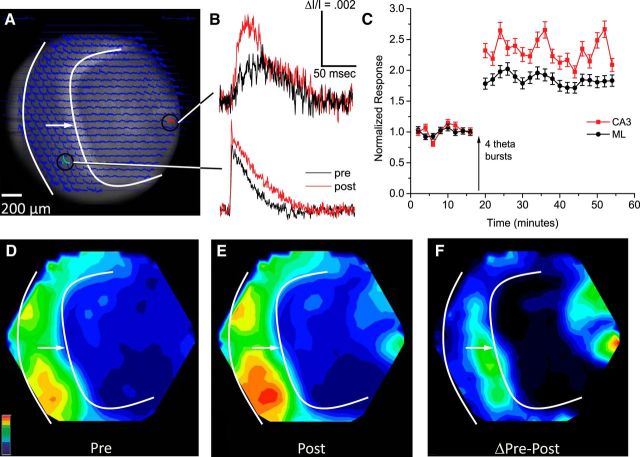
Figure 3.
Responses and potentiation induced by GC layer stimulation. Organization follows Figure 2. A, Overlay of optical traces on a CCD image. The white arrow and solid curves are as in Figure 2A. B, Selected traces pre-TBS and post-TBS (stimulation 50 μA, 0.2 ms). C, Time course plots from the CA3 region and the ML (ΔI/I; mean ± SEM; N = 9). D, E, Response map pre-TBS (D) and post-TBS (E). D and E were both normalized to the maximum in E. F, Potentiation map (E minus D) normalized to its own maximum.
Figure 1C displays typical responses in the ML and GC layer to stimulation of the PP and GC layer. These signals represent population responses of voltage changes from cells with membrane at the selected site. In general, both neurons and glia contribute to these optical signals, but with the dye used here, RH482, glia signals are weak and difficult to see without blocking excitatory synaptic receptors (Kojima et al., 1999). Most of the membrane in the ML is from GC dendrites. Interneurons are present in much smaller numbers than GCs in the dentate gyrus (Amaral et al., 1990) and are unlikely to contribute significantly to these populations responses. However, small signals from nonprincipal cells cannot be completely ruled out. The responses to both ML and GC layer stimulation show decay kinetics characteristic of excitatory synaptic potentials (Fig. 1C, top). Most of the membrane in the GC layer is from GC somata, and responses to GC layer stimulation show two temporal components, one rapid and one slow (Fig. 1C, bottom left). Rapid and slow voltage-sensitive dye signals such as these have been shown by pharmacological experiments to represent action potentials and excitatory synaptic potentials, respectively, in both the dentate gyrus (Jackson and Scharfman, 1996) and CA1 region (Grinvald et al., 1982). These optical signals correspond well with field potential recordings that have been interpreted as synaptic potentials in granule cell dendrites (Jackson and Scharfman, 1996). Synaptic components dominate the responses in the ML, so that changes in EPSP–spike coupling are not likely to contribute significantly to our analysis of potentiation. However, the origins of responses in the CA3 region are more difficult to assess because they are slower and less synchronous (Figs. 2, 3).
Spatial distribution of responses and potentiation: PP stimulation
Stimulation of the PP with test pulses in the outer half of the ML evoked robust optical signals throughout the field of view. An overlay of optical traces on an image of a slice illustrated the extensive spread of responses (Fig. 2A). Selected traces from three locations (Fig. 2B) highlighted the larger amplitude and faster kinetics of responses in the ML (top and bottom traces) compared with the CA3 region (middle trace). The traces from the CA3 region arose from the pyramidal cell layer and flanking strata oriens and radiatum. A proximal portion of the CA3 region was generally clear in CCD images, although the overlay of traces made some of the boundaries more difficult to see. Applying TBS to induce LTP potentiated responses in the ML but not in the CA3 region (compare red and black traces for the three locations displayed in Fig. 2B). The evoked change in light intensity (ΔI) was normalized to the resting light intensity (I) to give ΔI/I, and signals from sites showing the greatest potentiation were averaged over six slices and plotted versus time (Fig. 2C). These plots compare the fractional increases following TBS and illustrate the persistence of potentiation for the duration of our experiments (45 min). This potentiation indicated an increase in the local population EPSP, which reflects either increased amplitudes of responsive cells, or increased numbers of responsive cells, or both.
To evaluate the spatial distribution of responses and potentiation, we constructed maps of ΔI/I encoded as color. These maps highlighted the prominent responses through much of the ML before TBS (Fig. 2D) and revealed increases in response amplitude and spread after TBS (Fig. 2E). Normalization to the maximum post-TBS responses in Figure 2E aided comparisons and highlighted locations where potentiation occurred. Mapping the difference in ΔI/I between pre-TBS and post-TBS provided a direct view of the spatial distribution of potentiation (Fig. 2F). This map revealed lower potentiation around the stimulating electrode, in common with previous work in the CA1 region (Chang and Jackson, 2006). The underlying mechanisms for this local effect remain unclear. Both the response and potentiation maps revealed larger amplitudes in the infrapyramidal (bottom) blade of the ML than the suprapyramidal (top) blade (Fig. 2D–F). This asymmetry had been reported previously (Scharfman et al., 2002) without a GABAA receptor blocker, and the present results in SR95531 (see Materials and Methods, above) indicated that this feature does not reflect asymmetry in the inhibitory circuitry of the dentate gyrus. This asymmetry between the upper and lower blades did not extend to potentiation, as the fractional enhancements in both blades were identical after normalizing to their pre-TBS baselines (Fig. 2C).
Potentiation was conspicuously absent from the CA3 region. Although normalization made activity in the hilus and CA3 region difficult to see in response maps because the signals were so much smaller than in the ML (Fig. 2D,E), traces from those locations displayed clear responses (Fig. 2A,B), and these traces, along with the time course plot (Fig. 2C) and potentiation map (Fig. 2F), all showed that TBS of the PP failed to potentiate responses in the CA3 region. The absence of potentiation in the CA3 region is an important result. The disparity between the spatial distribution of responses versus the spatial distribution of potentiation indicates that TBS of the PP targets a subset of the activated synapses for LTP. Furthermore, LTP of those targeted synapses potentiated responses in the ML without facilitating transmission to the CA3 region. Amplification resulting from LTP in the dentate gyrus does not necessarily propagate through the trisynaptic circuit.
Spatial distribution of responses and potentiation: GC layer stimulation
Stimulating the GC layer bypasses the PP and depolarizes GC somata directly, as well as MC axons passing through the GC layer on their way to targets in the inner ML. Thus, GC layer stimulation activated both of the cell types of the GC→MC→GC circuit. Optical traces overlaid upon a slice image (Fig. 3A) and selected traces from the ML and CA3 region (Fig. 3B) show that, as with PP stimulation (Fig. 2A), GC layer stimulation evoked responses over a wide region, with greatest amplitudes in the ML. Comparison of pre-TBS and post-TBS responses (Fig. 3B, black and red traces) indicated that in contrast to TBS of the PP (Fig. 2), TBS of the GC layer strongly potentiated responses not only in the ML but also in the CA3 region. At sites in the ML showing maximal potentiation, TBS of the GC layer increased responses by 89 ± 3.1% (Fig. 3C), which was considerably greater than the 27 ± 2.9% increase following TBS of the PP (Fig. 2C). Response maps illustrated the spread before (Fig. 3D) and after (Fig. 3E) TBS. The difference map showed two distinct foci of potentiation in the ML and CA3 region (Fig. 3F). GC layer TBS also often induced weak potentiation in the hilus. This was not evident in Figure 3, but other experiments presented below with GC layer TBS showed some potentiation in the hilus (see Figs. 6 and 9). This potentiation was weaker than that seen in the ML and CA3 region. By contrast, TBS of the PP never induced potentiation in the hilus.
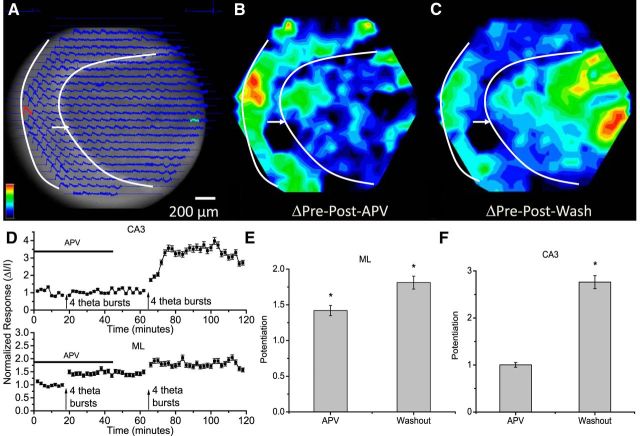
Figure 6.
NMDA receptor dependence of potentiation induced by GC layer stimulation. A, CCD image with optical traces overlain (stimulation 50 μA, 0.2 ms; white arrow and curves as in Fig. 2A). B, C, Potentiation map in the presence of 50 μm APV (B) and after APV washout (C); both maps were normalized to the maximum in C. D, Time course plots from sites of maximal potentiation in the ML and the CA3 region (ΔI/I; mean ± SEM; N = 11). The horizontal bar indicates the presence of APV and the arrows mark times of TBS. E, Average potentiation in the ML in APV and after washout. F, Average potentiation in the CA3 region in APV and after washout. *p < 0.05.
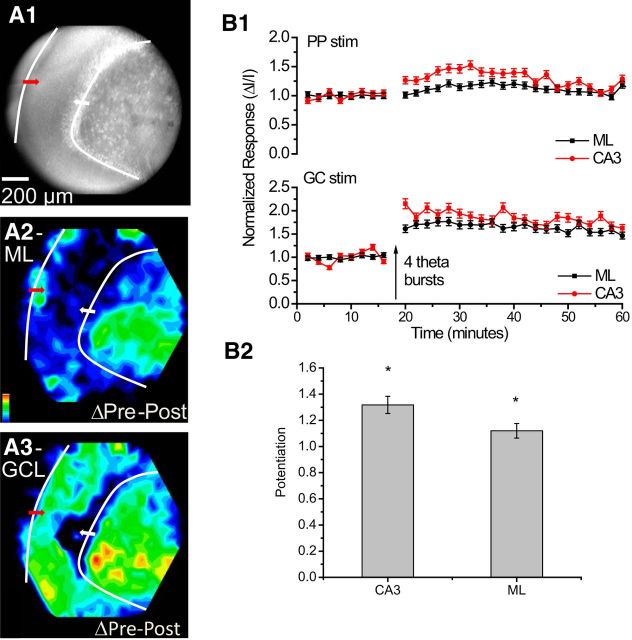
Figure 9.
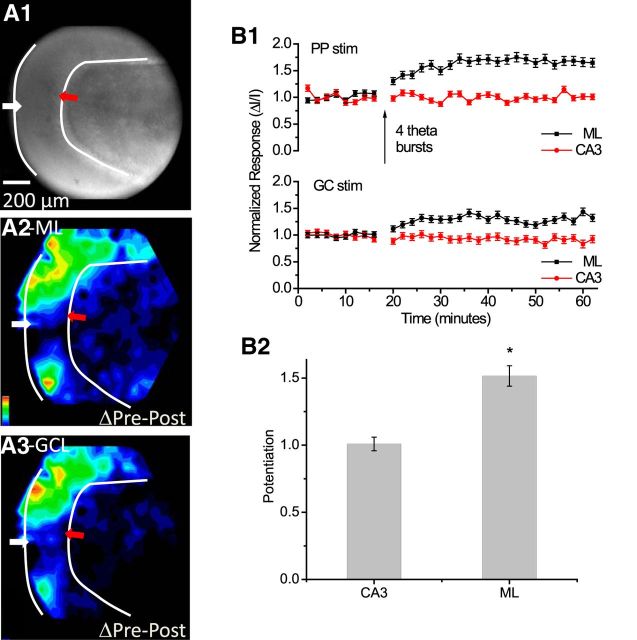
Dual-site stimulation with potentiation induced by TBS of the GC layer (instead of the PP as in Fig. 8). The design of this experiment follows Figure 3, with the second stimulating electrode in the PP. A1, CCD image with the red arrow indicating the stimulation site in the PP and the white arrow indicating the stimulation site in the GC layer (50 μA, 0.2 ms of each site). A2, Potentiation map for responses to PP stimulation. A3, Potentiation map for responses to GC layer stimulation. Each map was normalized to its own maximum and differences encoded as color according to the scale in the bottom left corner. Responses in the CA3 region evoked by PP stimulation were potentiated, even though this pathway received no TBS. B1, Time course plots of ΔI/I from the ML and CA3 region for each stimulation site (mean ± SEM; N = 6). Top, Responses in the ML and CA3 region evoked by PP stimulation were potentiated by TBS of the GC layer. Bottom, Responses from these sites evoked by GC layer stimulation were also potentiated (as in Fig. 3C). B2, Average potentiation induced by TBS of the GC layer for responses in the CA3 region and ML evoked by stimulation of the PP. *p < 0.05.
Because GC layer stimulation does not activate the PP (Fig. 1A), the potentiation in the ML seen in these experiments must reflect LTP within the GC→MC→GC circuit, either of GC→MC synapses or MC→GC synapses, or both. TBS of the GC layer was generally more effective than TBS of the PP at triggering LTP, despite the substantial overlap between the regions activated (compare Figs. 2D and 3D). The more than twofold potentiation of responses in the CA3 region by GC layer TBS presents a striking contrast with the absence of potentiation at the same location when TBS was applied to the PP. The very different potentiation maps (Figs. 2F, 3F) indicated that despite the similar spatial distributions of responses, TBS of the PP and GC layer strengthened different populations of synapses. This comparison raised important questions about the distinct roles of the various types synapses in the plasticity of the dentate gyrus. We therefore directed our experiments toward the goal of assessing the contributions of LTP at different synapses to the transmission of signals along different routes.
Potentiation with a severed PP
Although the spatial spread of responses to PP stimulation (Fig. 2D) tracks the anatomy of the PP (Fig. 1A), activation of the downstream GC→MC→GC circuit makes a major contribution to this spread (Jackson and Scharfman, 1996). Since we were able to induce LTP in the GC→MC→GC circuit (Fig. 3), we sought to test the hypothesis that LTP in these synapses contributes to the potentiation induced by TBS of the PP (Fig. 2). We therefore performed experiments in slices in which cuts were made to sever the PP. As reported previously (Jackson and Scharfman, 1996), regions of the ML across the cut from the stimulating electrode (trans-) responded nearly as robustly to PP stimulation as regions on the same side of the cut (cis-) (Fig. 4A). TBS stimulation induced potentiation throughout the ML, including the regions across the cut (Fig. 4B). Although potentiation was generally somewhat less than that in control slices, Figure 4C showed similar statistically significant increases on both sides of the cut (Fig. 4D, N = 11, p < 0.05). Thus, potentiation of responses in the ML across the cut did not depend on LTP of local PP→GC synapses at that site. The potentiation across the lesion suggested either that LTP was expressed in the GC→MC→GC circuit, or that the amplification of responses on the same side of the lesion by LTP of local PP→GC synapses propagated through the GC→MC→GC circuit to the other side of the lesion. In either scenario, signal transmission across the incision depended on hilar circuitry. Had we seen potentiation only on the side of the cut receiving stimulation, this result would have strongly negated the hypothesis that LTP in the GC→MC→GC circuit contributes to the potentiation induced by TBS of the PP. Additional experiments presented below on heterosynaptic interactions provided further support for a contribution from LTP within the GC→MC→GC circuit to potentiation induced by TBS of the PP.
NMDA receptor dependence of potentiation
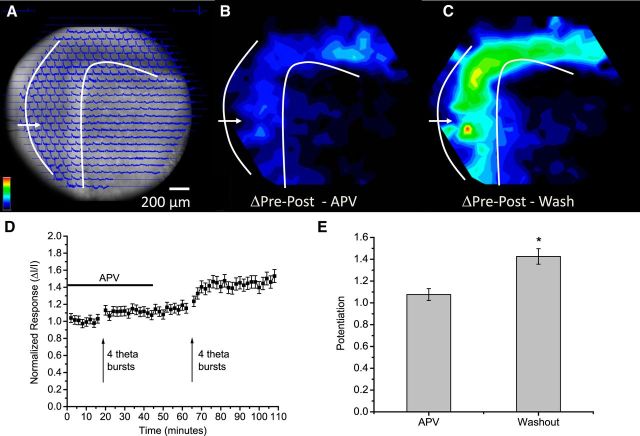
LTP induced by PP stimulation depends on NMDA receptors (Morris et al., 1986; Colino and Malenka, 1993), but mossy fiber LTP in the CA3 region does not (Harris and Cotman, 1986; Jaffe and Johnston, 1990; Nicoll and Schmitz, 2005). GC→MC synapses are formed by the same presynaptic cells as GC→CA3 mossy fiber synapses, and the NMDA receptor independence of their LTP (Lysetskiy et al., 2005) suggests that this is a general property of synapses formed by GC axons. Thus, experiments with an NMDA receptor antagonist should help us evaluate how LTP of different populations of synapses contributes to the potentiation observed at various locations. In the presence of the NMDA receptor antagonist 2-amino-5 phosphonovaleric acid (APV, 50 μm), PP stimulation evoked responses that spread through slices (Fig. 5A) as in control experiments (Fig. 2B), but TBS of the PP failed to potentiate these responses (Fig. 5B,C). Following APV washout, a second TBS potentiated responses in the ML (Fig. 5C), with a distribution similar to that observed in slices not previously exposed to APV (Fig. 2F). Plots of response versus time also illustrated the block of potentiation (Fig. 5D); the mean fractional change in ΔI/I was not significant in APV but was significant after APV removal (Fig. 5E). APV applied to lesioned slices (as in Fig. 4) produced a similar block of potentiation, which again recovered following washout (n = 4; data not shown). The potentiation map showed that the NMDA receptor dependence of potentiation induced by PP stimulation (Morris et al., 1986; Colino and Malenka, 1993) was global and extended through the dentate gyrus (Fig. 5B). Given the NMDA receptor independence of LTP at GC→MC synapses (Lysetskiy et al., 2005), this result suggested that the potentiation induced by TBS of the PP resulted from LTP of PP→GC and MC→GC synapses rather than GC→MC synapses.
Figure 5.
NMDA receptor dependence of potentiation induced by PP stimulation. A, A CCD image with optical traces overlain (stimulation 50 μA, 0.2 ms; white arrow and curves as in Fig. 2A). B, Potentiation map as the difference between responses pre-TBS and post-TBS in the presence of 50 μm APV. C, Potentiation map for a second TBS applied after washout of APV. Potentiation was encoded as color according to the scale in the bottom left corner of A, with both maps normalized to the maximum in C. D, Time course plots from sites of maximal potentiation in the ML (ΔI/I; mean ± SEM; N = 9). APV was present during the horizontal bar and TBS was applied at the two arrows. E, Average potentiation in APV and after washout. *p < 0.05.
We next tested the NMDA receptor dependence of potentiation induced by GC layer stimulation. In the presence of APV responses spread through the ML and CA3 region (Fig. 6A), as under control conditions (Fig. 3B), but in contrast to the results with TBS of the PP, TBS of the GC layer potentiated responses in the presence of APV. This NMDA receptor-independent potentiation was regionally restricted; responses were potentiated in the ML but not in the CA3 region (Fig. 6B,D). Following washout of APV, a second TBS strongly potentiated responses in the CA3 region (Fig. 6C,D) and produced a small increment in the potentiation in the ML beyond that induced by the first TBS (Fig. 6D, bottom). Thus, a subset of the synapses activated by stimulation of the GC layer have NMDA receptor-independent LTP.
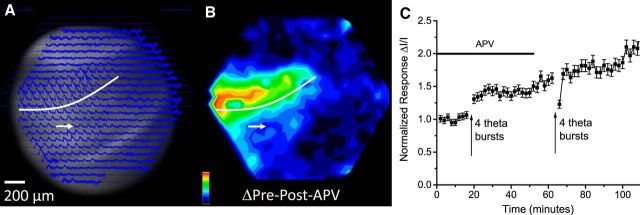
NMDA receptor independence is a well established and distinctive property of mossy fiber synapses in the CA3 region (Harris and Cotman, 1986; Jaffe and Johnston, 1990; Nicoll and Schmitz, 2005), but under some conditions, LTP of these synapses can require NMDA receptor activation (Henze et al., 2000). We therefore tested the effects of APV with direct stimulation of mossy fibers in the stratum lucidum in the CA3 region of coronal slices (these slices were not lesioned in the CA3a region; see Materials and Methods, above). Responses spread throughout the CA3 region (Fig. 7A) and we verified the activation of mossy fibers by showing that the metabotropic glutamate type 2/3 receptor agonist DCG-IV (1 μm) (Kamiya et al., 1996) blocked responses to stratum lucidum stimulation while sparing responses to stimulation with a second electrode in the stratum radiatum (data not shown). TBS identical to that used in our other experiments potentiated these responses in the presence of APV (Fig. 7B,C). Following APV washout, a second TBS produced a small additional increment in potentiation. This experiment demonstrated that our basic protocol has the capacity to elicit NMDA receptor-independent LTP of mossy fiber synapses in the CA3 region.
Figure 7.
NMDA receptor dependence of potentiation in the CA3 region in coronal slices with stratum lucidum stimulation. A, A CCD image of the CA3 region with optical traces overlain (stimulation 50 μA, 0.2 ms). B, Potentiation map in the presence of 50 μm APV, normalized to the maximum. The white arrow marks the site of stimulation and the white curve marks the CA3 pyramidal cell layer. C, Time course from sites showing maximal potentiation in the CA3 region with TBS at the arrows (ΔI/I; mean ± SEM; N = 4). The horizontal line indicates APV application.
The NMDA receptor dependence of potentiation in the CA3 region shown in Figure 6 indicated that synapses other than local mossy fiber synapses generated the robust potentiation of CA3 responses observed with TBS of the GC layer (Fig. 3F and second TBS after APV washout in Fig. 6C). Thus, this potentiation must reflect LTP upstream in the GC→MC→GC circuit. These experiments on the NMDA receptor dependence have thus revealed a novel form of potentiation of transmission from the dentate gyrus to the CA3 region that does not depend on LTP of local mossy fiber synapses on CA3 pyramidal cells. These results confirm a previous suggestion that LTP within hilar circuitry can potentiate responses in the CA3 region without classical mossy fiber LTP (Claiborne et al., 1993).
Heterosynaptic interactions
Results presented thus far have provided two examples of potentiation without local LTP of the synapses at those sites. Responses in the ML to PP stimulation can be potentiated without LTP of local PP→GC synapses (Fig. 4), and responses in the CA3 region to GC layer stimulation can be potentiated without LTP of local mossy fiber synapses (Fig. 6). To explore the relations between potentiation and LTP at local versus nonlocal synapses more deeply, we performed dual-site stimulation experiments. This approach enabled us to address the following closely related questions: (1) can TBS of the PP induce LTP in downstream synapses in the GC→MC→GC circuit? (2) can LTP in the GC→MC→GC circuit potentiate responses to PP stimulation? and (3) can LTP in the GC→MC→GC circuit potentiate transmission to the CA3 region?
With stimulating electrodes positioned in both the PP and GC layer (Fig. 8A1), we pulsed alternately at 15 s intervals to establish baselines for each site, and then applied TBS only to the PP. As expected, this potentiated responses to PP stimulation, and the spatial distribution (Fig. 8A2) resembled that from the corresponding single-site experiment (Fig. 2F). Time course plots were also similar (Figs. 8B1, top; 2C). However, we additionally saw potentiation of responses to stimulation of the GC layer. Both the potentiation map (Fig. 8A3) and the time course plot of responses to GC layer stimulation (Fig. 8B1, bottom traces) showed potentiation in the ML but not in the CA3 region. Thus, TBS of the PP has a heterosynaptic effect on responses to GC layer stimulation, inducing LTP in the downstream GC→MC→GC circuit. This confirmed the nonlocal nature of the potentiation at sites severed from their PP input (Fig. 4) and indicated that the LTP underlying this potentiation resides in the GC→MC→GC circuit. Both potentiation maps (Fig. 8A2,A3) and time course plots (Fig. 8B1) showed no potentiation in the CA3 region for stimulation at either site. Thus, LTP of the downstream synapses induced by TBS of the PP failed to enhance transmission to the hippocampus, not only for stimulation of the PP as demonstrated above (Fig. 2), but also for stimulation of the GC layer that had not received TBS (Fig. 8B1).
Figure 8.
Dual-site stimulation with potentiation induced by TBS of the PP. The design of this experiment follows Figure 2, with the addition of a second stimulating electrode in the GC layer. A1, CCD image of the dentate gyrus with the red arrow indicating the stimulation site in the GC layer and the white arrow indicating the stimulation site in the PP. The white curves mark the borders of the ML. The PP and GC layer were stimulated alternately at 15 s intervals (50 μA, 0.2 ms for each site). A2, Potentiation map for responses to PP stimulation. A3, Potentiation map for responses to GC layer stimulation. Each map was normalized to its own maximum, and differences encoded as color according to the scale in the bottom left corner of A2. B1, Time course plots of ΔI/I from sites in the ML and CA3 region for each stimulation site (mean ± SEM; N = 6). Top, Responses in the ML evoked by PP stimulation were potentiated by TBS of the PP but responses in the CA3 region were not (as in Fig. 2C). Bottom, Responses in the ML evoked by GC layer stimulation were also potentiated by TBS of the PP, but responses in the CA3 region were not. B2, Average potentiation induced by TBS of the PP for responses in the CA3 region and ML evoked by GC layer stimulation. *p < 0.05.
We performed a similar dual-site stimulation experiment with TBS applied to the GC layer (Fig. 9A1). Responses to GC layer stimulation exhibited the expected potentiation in the ML and CA3 region (Fig. 9A3), as in the corresponding single-site experiment (Fig. 3F). Once again, we observed a heterosynaptic effect: TBS of the GC layer potentiated the responses evoked by stimulating the PP. This potentiation was greatest in the CA3 region but was also significant in the ML (Fig. 9A2,B1, bottom plot). The potentiation of responses in the CA3 region to PP stimulation is important because TBS of the PP never potentiated CA3 responses (Figs. 2, 8). Unlike the potentiation induced by TBS of the PP, TBS of the GC layer enhanced transmission from the PP to the hippocampus, and this enhancement must reflect LTP in the GC→MC→GC circuit. This experiment thus showed that the GC→MC→GC circuit regulates information flow through the dentate gyrus from the PP to the CA3 region.
Discussion
In this study, we explored how the interconnected circuitry of the dentate gyrus responds to activation through two different pathways. Stimulating the PP activated synapses on GC dendrites in the ML (Fig. 1A), eliciting large responses broadly through the ML and small responses in the CA3 region (Fig. 2). Stimulating the GC layer elicited a similar spatial response pattern, but through activation of the GC→MC→GC circuit downstream from the PP. The spread of these responses (Fig. 3) reflected the extensive reach of GC and MC projections. In contrast to the similar distributions of responses to single pulses, TBS of these two sites induced different spatial distributions of potentiation, with both sites potentiating responses in the ML, but only GC layer TBS potentiating responses in the CA3 region. Thus, the population of synapses targeted for LTP did not mirror the pattern of activation. Our experiments enabled us to identify which of the excitatory synapses of the dentate gyrus expressed LTP with these two different stimulation sites, and determine how these different synapses control the flow of information through the hippocampus.
Because the GC→MC→GC circuit is downstream from the PP, the potentiation induced by GC layer TBS cannot be attributed to LTP of PP inputs, but instead requires LTP of synapses between MCs and GCs. LTP has been demonstrated in synapses formed by MCs (Kleschevnikov and Routtenberg, 2003; Lysetskiy et al., 2005) and our results from lesioned slices and dual-site stimulation suggested that synapses of the GC→MC→GC circuit were potentiated not only by direct TBS of the GC layer, but also by TBS of the upstream PP. This finding makes an important point about plasticity in the dentate gyrus. Potentiation induced by PP stimulation (Bliss and Gardner-Medwin, 1973; Colino and Malenka, 1993; Derrick, 2007) does not reflect LTP solely at PP synapses on GCs, but includes a contribution from LTP in the GC→MC→GC circuit. The present study showed that these downstream synapses, although not directly activated by the PP, nevertheless are strengthened and contribute to the potentiation induced by TBS of the PP.
We can make an analogous point with regard to potentiation of responses in the CA3 region. The more than twofold enhancement resulting from GC layer TBS (Fig. 3C) cannot reflect LTP of local CA3 mossy fiber synapses as it was blocked by APV (Fig. 5), and we confirmed the established NMDA receptor independence of CA3 mossy fiber LTP (Harris and Cotman, 1986; Jaffe and Johnston, 1990; Nicoll and Schmitz, 2005; Fig. 7). Thus, responses in the CA3 region evoked by either PP or GC layer stimulation were too weak to induce LTP at GC→CA3 synapses. Instead, our results indicate that LTP in the GC→MC→GC circuit can serve as a surrogate for mossy fiber LTP in the CA3 region. This confirms an early proposal based on the location and connectivity of MCs (Claiborne et al., 1993) and identifies a new locus for modulating communication between the dentate gyrus and CA3 region.
Potentiation induced by GC layer TBS was blocked in the CA3 region by APV, but we saw NMDA receptor-independent potentiation in the ML (Fig. 6). This regional specificity revealed that the two synapses in the GC→MC→GC circuit are not equivalent with regard to the NMDA receptor dependence of their LTP. We can attribute the NMDA receptor-independent component to GC→MC synapses, where patch-clamp recordings have shown that an NMDA receptor antagonist failed to block LTP (Lysetskiy et al., 2005). In this respect, GC→MC synapses resemble the synapses formed by GC axons on CA3 pyramidal cells (Harris and Cotman, 1986; Jaffe and Johnston, 1990; Nicoll and Schmitz, 2005). This leaves the MC→GC synapse as the component of the GC→MC→GC circuit with NMDA receptor-dependent LTP.
TBS of the PP induced LTP in the GC→MC→GC circuit, and the complete blockade of this potentiation by APV (Fig. 5) points to the MC→GC synapse as the component of the GC→MC→GC circuit that expresses LTP during PP TBS. Since CA3 responses remained unchanged, we can conclude that LTP of MC→GC synapses without LTP of GC→MC synapses is insufficient for potentiation of transmission to the CA3 region. Likewise, LTP of only GC→MC synapses, which occurred with TBS of the GC layer in the presence of APV, also failed to potentiate transmission to the CA3 region. Thus, restricting LTP to either GC→MC synapses or to MC→GC synapses prevented the potentiation of CA3 responses. The unique outcome of potentiation in the CA3 region therefore required LTP in both GC→MC and MC→GC synapses. This suggests a special relation between these two reciprocally connected types of excitatory neuron. One intriguing possibility is that reciprocally connected pairs amplify activity to drive spikes in high-threshold GCs. The focused stimulation of both GC somata and MC processes would be especially effective in targeting synapses between reciprocally coupled pairs for LTP. In any case, this result indicates that a special condition must be met. LTP must be expressed in both GC→MC and MC→GC synapses to increase transmission through the dentate gyrus and on to the hippocampus. Despite the broad distribution of potentiation through the ML following TBS of the PP (Fig. 2F), responses in the CA3 region remained unchanged. Traffic through the dentate gyrus is not easily altered, and depends on the specific way in which synapses between MCs and GCs are selected for LTP. Sensory inputs that activate both neuronal populations, possibly targeting reciprocally coupled pairs, may be an important cue in the plasticity of hippocampal behavior. Our finding that GC layer TBS enhanced throughput from the PP to the CA3 region (Fig. 9) establishes the GC→MC→GC circuit as an important gate that controls transmission through the first two segments of the trisynaptic circuit.
MCs are well situated for roles in amplifying and processing inputs from the entorhinal cortex. By regulating the flow of information through the dentate gyrus, the GC→MC→GC circuit can make important contributions to hippocampal functions, and coordinated LTP of GC→MC and MC→GC synapses can modify these contributions. The hippocampus has well established roles in memory and navigation, and knowing which types of synapses store information about the environment will be critical to understanding how neural circuitry generates behavior, as well as how LTP enables experience to modify it (Leutgeb and Leutgeb, 2007; Moser et al., 2008). Here, we showed that LTP in the GC→MC→GC circuit can enhance transmission through the hippocampus, and found a unique condition that must be met for this to occur. This may be relevant to the role of the dentate gyrus in the generalization of seizure activity and allowing abnormal activity to spread through the hippocampus (Heinemann et al., 1992; Lothman et al., 1992; Ang et al., 2006; Dudek and Sutula, 2007). LTP in synapses in the GC→MC→GC circuit will lower the barrier to seizures, and this could trigger a transition to a pathological state. The gatekeeper function of the GC→MC→GC circuit will enable it to serve as a powerful regulator of how the hippocampus handles normal and pathological activity. Plasticity in dentate gyrus gatekeeping identifies a new role for hilar synapses and provides a new perspective on information processing by the hippocampus.
Footnotes
This work was supported by NIH Grants R21NS061150 and R21NS078301. B.J.W. was supported by an Advanced Opportunity Fellowship from the University of Wisconsin and a graduate fellowship from Lily's Fund. We thank Peter Bayguinov, Mathew Jones, and Peter Lipton for valuable discussions and comments on the manuscript.
References
- Acsády L, Kamondi A, Sík A, Freund T, Buzsáki G. GABAergic cells are the major postsynaptic targets of mossy fibers in the rat hippocampus. J Neurosci. 1998;18:3386–3403. doi: 10.1523/JNEUROSCI.18-09-03386.1998. [DOI] [PMC free article] [PubMed] [Google Scholar]
- Amaral DG, Ishizuka N, Claiborne B. Neurons, numbers and the hippocampal network. Prog Brain Res. 1990;83:1–11. doi: 10.1016/S0079-6123(08)61237-6. [DOI] [PubMed] [Google Scholar]
- Ang CW, Carlson GC, Coulter DA. Massive and specific dysregulation of direct cortical input to the hippocampus in temporal lobe epilepsy. J Neurosci. 2006;26:11850–11856. doi: 10.1523/JNEUROSCI.2354-06.2006. [DOI] [PMC free article] [PubMed] [Google Scholar]
- Bliss TV, Gardner-Medwin AR. Long-lasting potentiation of synaptic transmission in the dentate area of the unanaestetized rabbit following stimulation of the perforant path. J Physiol. 1973;232:357–374. doi: 10.1113/jphysiol.1973.sp010274. [DOI] [PMC free article] [PubMed] [Google Scholar]
- Buckmaster PS, Schwartzkroin PA. Hippocampal mossy cell function: a speculative view. Hippocampus. 1994;4:393–402. doi: 10.1002/hipo.450040402. [DOI] [PubMed] [Google Scholar]
- Chang PY, Jackson MB. Interpretation and optimization of absorbance and fluorescence signals from voltage-sensitive dyes. J Membr Biol. 2003;196:105–116. doi: 10.1007/s00232-003-0629-8. [DOI] [PubMed] [Google Scholar]
- Chang PY, Jackson MB. Heterogeneous spatial patterns of long-term potentiation in rat hippocampal slices. J Physiol. 2006;576:427–443. doi: 10.1113/jphysiol.2006.112128. [DOI] [PMC free article] [PubMed] [Google Scholar]
- Chang PYP. Madison: University of Wisconsin; 2006. Heterogeneous spatial patterns of long-term potentiation in hippocampal slices. PhD thesis. [DOI] [PMC free article] [PubMed] [Google Scholar]
- Claiborne BJ, Amaral DG, Cowan WM. Quantitative, three-dimensional analysis of granule cell dendrites in the rat dentate gyrus. J Comp Neurol. 1990;302:206–219. doi: 10.1002/cne.903020203. [DOI] [PubMed] [Google Scholar]
- Claiborne BJ, Xiang Z, Brown TH. Hippocampal circuitry complicates analysis of long-term potentiation in mossy fiber synapses. Hippocampus. 1993;3:115–121. doi: 10.1002/hipo.450030202. [DOI] [PubMed] [Google Scholar]
- Colino A, Malenka RC. Mechanisms underlying induction of long-term potentiation in rat medial and lateral perforant paths in vitro. J Neurophysiol. 1993;69:1150–1159. doi: 10.1152/jn.1993.69.4.1150. [DOI] [PubMed] [Google Scholar]
- Derrick BE. Plastic processes in the dentate gyrus: a computational perspective. Prog Brain Res. 2007;163:417–451. doi: 10.1016/S0079-6123(07)63024-6. [DOI] [PubMed] [Google Scholar]
- Dudek FE, Sutula TP. Epileptogenesis in the dentate gyrus: a critical perspective. Prog Brain Res. 2007;163:755–773. doi: 10.1016/S0079-6123(07)63041-6. [DOI] [PubMed] [Google Scholar]
- Grinvald A, Manker A, Segal M. Visualization of the spread of electrical activity in rat hippocampal slices by voltage-sensitive optical probes. J Physiol. 1982;333:269–291. doi: 10.1113/jphysiol.1982.sp014453. [DOI] [PMC free article] [PubMed] [Google Scholar]
- Grinvald A, Frostig RD, Lieke E, Hildesheim R. Optical imaging of neuronal activity. Physiol Rev. 1988;68:1285–1366. doi: 10.1152/physrev.1988.68.4.1285. [DOI] [PubMed] [Google Scholar]
- Harris EW, Cotman CW. Long-term potentiation of guinea pig mossy fiber responses is not blocked by N-methyl D-aspartate antagonists. Neurosci Lett. 1986;70:132–137. doi: 10.1016/0304-3940(86)90451-9. [DOI] [PubMed] [Google Scholar]
- Heinemann U, Beck H, Dreier JP, Ficker E, Stabel J, Zhang CL. The dentate gyrus as a regulated gate for the propagation of epileptiform activity. Epilepsy Res Suppl. 1992;7:273–280. [PubMed] [Google Scholar]
- Henze DA, Buzsáki G. Hilar mossy cells: functional identification and activity in vivo. Prog Brain Res. 2007;163:199–216. doi: 10.1016/S0079-6123(07)63012-X. [DOI] [PubMed] [Google Scholar]
- Henze DA, Urban NN, Barrionuevo G. The multifarious hippocampal mossy fiber pathway: a review. Neuroscience. 2000;98:407–427. doi: 10.1016/S0306-4522(00)00146-9. [DOI] [PubMed] [Google Scholar]
- Hsu D. The dentate gyrus as a filter or gate: a look back and a look ahead. Prog Brain Res. 2007;163:601–613. doi: 10.1016/S0079-6123(07)63032-5. [DOI] [PubMed] [Google Scholar]
- Jackson MB, Scharfman HE. Positive feedback from hilar mossy cells to granule cells in the dentate gyrus revealed by voltage-sensitive dye and microelectrode recording. J Neurophysiol. 1996;76:601–616. doi: 10.1152/jn.1996.76.1.601. [DOI] [PubMed] [Google Scholar]
- Jaffe D, Johnston D. Induction of long-term potentiation at hippocampal mossy-fiber synapses follows a Hebbian rule. J Neurophysiol. 1990;64:948–960. doi: 10.1152/jn.1990.64.3.948. [DOI] [PubMed] [Google Scholar]
- Jin W, Zhang RJ, Wu JY. Voltage-sensitive dye imaging of population neuronal activity in cortical tissue. J Neurosci Methods. 2002;115:13–27. doi: 10.1016/S0165-0270(01)00511-8. [DOI] [PubMed] [Google Scholar]
- Kamiya H, Shinozaki H, Yamamoto C. Activation of metabotropic glutamate receptor type 2/3 suppresses transmission at rat hippocampal mossy fibre synapses. J Physiol. 1996;493:447–455. doi: 10.1113/jphysiol.1996.sp021395. [DOI] [PMC free article] [PubMed] [Google Scholar]
- Kleschevnikov AM, Routtenberg A. Long-term potentiation recruits a trisynaptic excitatory associative network within the mouse dentate gyrus. Eur J Neurosci. 2003;17:2690–2702. doi: 10.1046/j.1460-9568.2003.02709.x. [DOI] [PubMed] [Google Scholar]
- Kojima S, Nakamura T, Nidaira T, Nakamura K, Ooashi N, Ito E, Watase K, Tanaka K, Wada K, Kudo Y, Miyakawa H. Optical detection of synaptically induced glutamate transport in hippocampal slices. J Neurosci. 1999;19:2580–2588. doi: 10.1523/JNEUROSCI.19-07-02580.1999. [DOI] [PMC free article] [PubMed] [Google Scholar]
- Larimer P, Strowbridge BW. Representing information in cell assemblies: persistent activity mediated by semilunar granule cells. Nat Neurosci. 2010;13:213–222. doi: 10.1038/nn.2458. [DOI] [PMC free article] [PubMed] [Google Scholar]
- Leutgeb S, Leutgeb JK. Pattern separation, pattern completion, and new neuronal codes within a continuous CA3 map. Learn Mem. 2007;14:745–757. doi: 10.1101/lm.703907. [DOI] [PubMed] [Google Scholar]
- Lothman EW, Stringer JL, Bertram EH. The dentate gyrus as a control point for seizures in the hippocampus and beyond. Epilepsy Res Suppl. 1992;7:301–313. [PubMed] [Google Scholar]
- Lysetskiy M, Földy C, Soltesz I. Long- and short-term plasticity at mossy fiber synapses on mossy cells in the rat dentate gyrus. Hippocampus. 2005;15:691–696. doi: 10.1002/hipo.20096. [DOI] [PubMed] [Google Scholar]
- Morris RG, Anderson E, Lynch GS, Baudry M. Selective impairment of learning and blockade of long-term potentiation by an N-methyl-D-aspartate receptor antagonist, AP5. Nature. 1986;319:774–776. doi: 10.1038/319774a0. [DOI] [PubMed] [Google Scholar]
- Moser EI, Kropff E, Moser MB. Place cells, grid cells, and the brain's spatial representation system. Annu Rev Neurosci. 2008;31:69–89. doi: 10.1146/annurev.neuro.31.061307.090723. [DOI] [PubMed] [Google Scholar]
- Nicoll RA, Schmitz D. Synaptic plasticity at hippocampal mossy fibre synapses. Nat Rev Neurosci. 2005;6:863–876. doi: 10.1038/nrn1786. [DOI] [PubMed] [Google Scholar]
- Ribak CE, Seress L, Amaral DG. The development, ultrastructure and synaptic connections of the mossy cells of the dentate gyrus. J Neurocytol. 1985;14:835–857. doi: 10.1007/BF01170832. [DOI] [PubMed] [Google Scholar]
- Scharfman HE. Electrophysiological evidence that dentate hilar mossy cells are excitatory and innervate both granule cells and interneurons. J Neurophysiol. 1995;74:179–194. doi: 10.1152/jn.1995.74.1.179. [DOI] [PubMed] [Google Scholar]
- Scharfman HE, Myers CE. Hilar mossy cells of the dentate gyrus: a historical perspective. Front Neural Circuits. 2013;6:106. doi: 10.3389/fncir.2012.00106. [DOI] [PMC free article] [PubMed] [Google Scholar]
- Scharfman HE, Kunkel DD, Schwartzkroin PA. Synaptic connections of dentate granule cells and hilar neurons: results of paired intracellular recordings and intracellular horseradish peroxidase injections. Neuroscience. 1990;37:693–707. doi: 10.1016/0306-4522(90)90100-I. [DOI] [PubMed] [Google Scholar]
- Scharfman HE, Sollas AL, Smith KL, Jackson MB, Goodman JH. Structural and functional asymmetry in the normal and epileptic rat dentate gyrus. J Comp Neurol. 2002;454:424–439. doi: 10.1002/cne.10449. [DOI] [PMC free article] [PubMed] [Google Scholar]
- Wigström H, Gustafsson B. Large long-lasting potentiation in the dentate gyrus in vitro during blockade of inhibition. Brain Res. 1983;275:153–158. doi: 10.1016/0006-8993(83)90428-6. [DOI] [PubMed] [Google Scholar]
- Wu JY, Cohen LB. Fast multisite optical measurements of membrane potential. In: Mason WT, editor. Fluorescent and luminescent probes for biological activity. London: Academic; 1993. pp. 389–404. [Google Scholar]


