Abstract
Recently, stereotactic body radiotherapy (SBRT) for lung cancer is conducted with heterogeneity-corrected treatment plans, as the correction greatly affects the dose delivery to the lung tumor. In this study, the correlation between the planning target volume (PTV) and the dose delivery is investigated by separation of the heterogeneity correction effects into photon attenuation and electron transport. Under Institutional Review Board exemption status, 74 patients with lung cancer who were treated with SBRT were retrospectively evaluated. All treatment plans were generated using an anisotropic analytical algorithm (AAA) of an Eclipse (Varian Medical Systems, Palo Alto, CA) treatment planning system. Two additional plans were created using the same treatment parameters (monitor units, beam angles and energy): a plan with no heterogeneity correction (NC), and a plan calculated with a pencil beam convolution algorithm (PBC). Compared with NC, AAA and PBC isocenter doses were on average 13.4% and 21.8% higher, respectively. The differences in the isocenter dose and the dose coverage for 95% of the PTV (D95%) between PBC and AAA were correlated logarithmically (ρ = 0.78 and ρ = 0.46, respectively) with PTV. Although D95% calculated with AAA was in general 2.9% larger than that for NC, patients with a small PTV showed a negative ΔD95% for AAA due to the significant effect of electron transport. The PTV volume shows logarithmic correlation with the effects of the lateral electron transport. These findings indicate that the dosimetric metrics and prescription, especially in clinical trials, should be clearly evaluated in the context of target volume characteristics and with proper heterogeneity correction.
Keywords: heterogeneity corrections, lung cancer, stereotactic body radiotherapy, radiation dosimetry
INTRODUCTION
Stereotactic body radiotherapy (SBRT) has gained worldwide acceptance as treatment for early stage inoperable small lesions of non-small cell lung cancers (NSCLCs), and has yielded excellent tumor control rates, above 90% [1, 2]. Several clinical trials have been conducted to investigate the use of SBRT for NSCLC treatment. Radiation Therapy Oncology Group (RTOG) protocols 0236 and 0618 did not allow heterogeneity corrections for dosimetry and monitor unit calculation because of a lack of clinical experience in heterogeneity correction. Later, RTOG protocols 0813 and 0915 did require heterogeneity corrections in dose calculation [3]. Dose calculation in lung SBRT is complicated as a consequence of the dosimetry of thoracic organs with tissue heterogeneities and small treatment fields [4]. The accuracy of dosimetry has improved a great deal, with advanced commercial dose calculation algorithms such as collapsed-cone, convolution/superposition, anisotropic analytical algorithm (AAA), Acuros® XB and Monte Carlo [5–9]. The Japan Clinical Oncology Group (JCOG) 0403 phase II trial and 0702 phase I trial were conducted using heterogeneity correction with one-dimensional equivalent path length (EPL) and a convolution/superposition algorithm, respectively [10]. Recently, some clinical trials have been conducted using advanced dose calculation algorithms.
Radiation dosimetry plays an important role in the comparison of clinical outcome. In light of this, the impact of heterogeneity corrections on dose calculation in lung SBRT has been investigated [11–14]. Many of the earlier studies that investigated the effect of heterogeneity corrections using clinical data assessed a small number of cases or collected patient data from multiple institutions. Xiao et al. [15] and Schuring and Hurkmans [16] reported that the dose covering 95% of the PTV (D95%) for a PTV calculated with superposition or collapsed-cone was smaller than that for a PTV calculated without heterogeneity corrections. Recently, Ueki et al. [17] investigated 83 SBRT plans and reported the opposite for D95% results. In their study, the D95% of a PTV calculated with AAA was slightly larger than that calculated without corrections, however they did not mention the discrepancy between previous reports and their study. The effect of heterogeneity corrections on target coverage is critical when determining treatment protocols. Although previous studies evaluated the average ± SD of the dose–volume metrics, or statistical differences among various dose calculation algorithms, few studies have investigated the factors that affect the heterogeneity corrections.
To evaluate more detailed effects of heterogeneity corrections with advanced algorithms on the target dose of SBRT for lung cancer, a retrospective analysis of the treatment plans of 74 patients was conducted at a single institution. The results were analyzed according to size of target volume and by separating photon attenuation and electron transport for the heterogeneity corrections.
MATERIALS AND METHODS
Patients
Under Institutional Review Board (IRB) exemption, we retrospectively analyzed the treatment plans of 74 patients with lung cancer who were treated with SBRT at Indiana University School of Medicine, Indianapolis. There were 22 and 52 cases in the right- and left-lobe of the lung, respectively. Details of the prescribed doses for these patients are listed in Table 1. Every SBRT patient was immobilized using either an Elekta Stereotactic Body Frame (Elekta, Stockholm, Sweden) or a CIVCO Body Pro-Lok system (CIVCO, Kalona, IA), depending upon the patient size, comfort and suitability as decided at the time of simulation.
Table 1.
Description of treatment parameters
| Plan parameters | Frequency |
|---|---|
| Energy | |
| 6 MV | 50 (68%) |
| 6 + 16 MVa | 24 (32%) |
| Number of beams | |
| 8 | 3 (4%) |
| 9 | 15 (20%) |
| 10 | 49 (66%) |
| 11 | 7 (10%) |
| Number of non-coplanar beams | |
| ≤2 | 2 (3%) |
| 4 | 18 (24%) |
| 5 | 46 (62%) |
| 6 | 8 (11%) |
a6 + 16 MV = treatment fields including both 6 MV and 16 MV beams.
Treatment planning and evaluations
Eclipse version 10.0 was used for the treatment planning. Plans were generated to cover 95% of the PTV with the prescribed dose, thus providing typically a 25% higher dose to the GTV. Eclipse provides two algorithms for heterogeneity correction; pencil beam convolution (PBC) and AAA. The PBC model in Eclipse is mainly for homogenous medium (water) dose calculation that gets supplemented with older models modified Batho, Batho power law and equivalent tissue air ration (ETAR) [18]. It was noted that both modified Batho and Batho power law gave almost the same results for SBRT, and hence default modified Batho with PBC was used. The ETAR option with PBC cannot be used with non-coplanar field arrangements, thus ETAR was not an option in this study as the majority of the SBRT fields were non-coplanar. Heterogeneity correction was applied to all clinically approved plans using an AAA algorithm. The AAA is considered a superior algorithm compared with older and pencil beam algorithms [7, 19–21]. Two additional plans were generated for each patient: (i) a treatment plan with no correction (NC), and (ii) PBC with modified Batho heterogeneity correction. In the PBC algorithm, the dose deposited at a point was calculated as a convolution of energy fluence, or total energy released per unit mass (TERMA), with the respective dose deposition kernel pre-calculated for a narrow beam in water [22]. The Batho power-law correction method is an empirical correction to account for both primary beam attenuation and scatter changes in heterogeneous materials. The modified Batho correction uses only the descending part of the TAR/TMR curve because the curve in the build-up region of a high-energy photon is no longer valid. However, PBC does not take into account changes in lateral electron transport. This provided us with an opportunity to differentiate between photon attenuation (PBC) versus electron transport (AAA).
For each patient, two additional plans (NC and PBC) were created using the same monitor units as calculated with AAA. Because PBC considers changes in tissue density but does not consider lateral electron transport, the difference between the NC and PBC can be considered as the effect of photon attenuation. As AAA considers both depth correction and electron transport, the difference between PBC and AAA therefore represents the effect of electron transport calculation.
To evaluate the effect of photon attenuation, we assessed the change in path length (ΔPL) defined as:
| (1) |
where di and EPLi represent the physical and equivalent path length (EPL) depth for each treatment beam, respectively. Wi and W represent the weight of each beam and the total weight, respectively. The D95% and the volume receiving the prescribed dose (V100%), representing the quality of the target volume coverage, were also analyzed.
Statistical analysis
JMP software (ver. 9.0.2; SAS Institute, Cary, NC) was used for statistical analysis. All pairwise comparisons among the three calculation algorithms were conducted for the isocenter dose (DIso), D95% and V100% using the Steel–Dwass test. The correlation between dosimetric parameters and anatomical characteristics including ΔPL, the PTV and the distance between the PTV and the chest wall or mediastinum was assessed with Spearman's rank correlation coefficient. Statistical significance was defined as a P-value < 0.05.
RESULTS
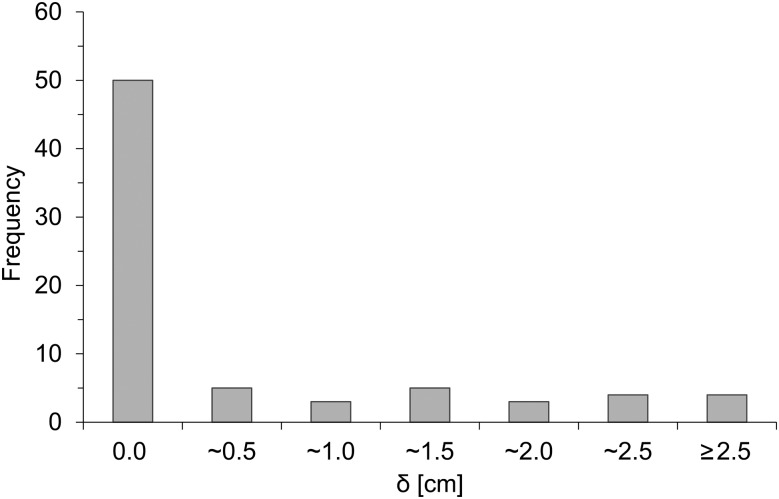
The characteristics of target volumes of the patients are shown in Table 2. Due to the selection criterion in our institution, peripheral lesions were preferred for SBRT, as shown in Fig. 1, which indicates the frequency distribution of lesions. This figure shows that the majority of the patients (74.3%) have the GTV close to the chest wall (<0.5 cm) and the remainder have it distributed evenly up to 2.5 cm. Figure 2 shows an example of dose distributions using the three treatment plans (NC, PBC, AAA). The subtle dose difference is clearly visible. Typically, PBC generally overestimates dose in lung as it underestimates the range of the secondary particles, whereas AAA provides accurate dose distribution.
Table 2.
Details of target volume
| Anatomic parameters | Mean ± SD (min − max) |
|---|---|
| Target volume | |
| GTV | 13.8 ± 16.5 (0.6 − 111.5) [cm3] |
| PTV | 45.3 ± 35.7 (9.5 − 212.0) [cm3] |
| Maximum dimension | |
| GTV | 3.34 ± 1.31 (1.26 − 7.02) [cm] |
| PTV | 5.12 ± 1.33 (1.54 − 8.75) [cm] |
GTV = gross tumor volume, PTV = planning target volume.
Fig. 1.
Frequency distribution of the shortest distance (δ) between gross tumor volume (GTV) and chest wall or mediastinum.
Fig. 2.
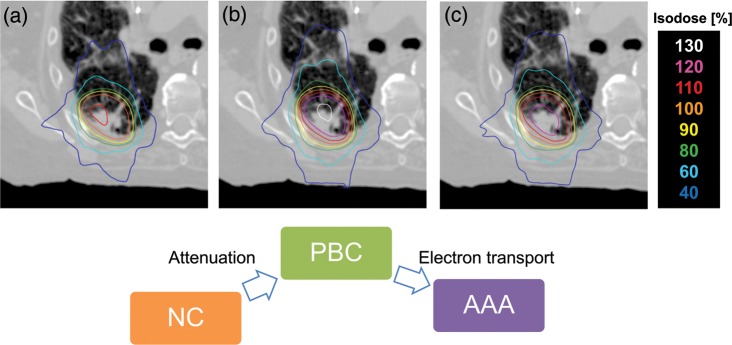
Axial dose distributions of a patient calculated using (a) no heterogeneity correction (NC), heterogeneity correction using (b) PBC with modified Batho, and (c) AAA.
Isocenter dose
The DIso relative to the prescribed dose for each plan is shown in Fig. 3a. The DIso (average ± SD) for the entire patient population was 110.8 ± 4.4%, 132.6 ± 4.3% and 124.2 ± 3.1% for NC, PBC and AAA, respectively. The ΔDIso calculated with PBC and AAA were larger than that calculated with NC by 21.8% and 13.4%, respectively, in our population, with both P < 0.0001. The DIso of AAA was 8.4% smaller than that of PBC (P < 0.0001). In Fig. 3b, the isocenter dose difference (ΔDIso) between the dose with and without heterogeneity corrections of PBC (ΔPBC) and AAA (ΔAAA) were plotted with ΔPL as shown in Eq 1. The slope of the lines for PBC and AAA are nearly identical. The ΔPBC and ΔAAA showed intermediate linear correlation with ΔPL (ρ = 0.60, P < 0.0001 for both).
Fig. 3.
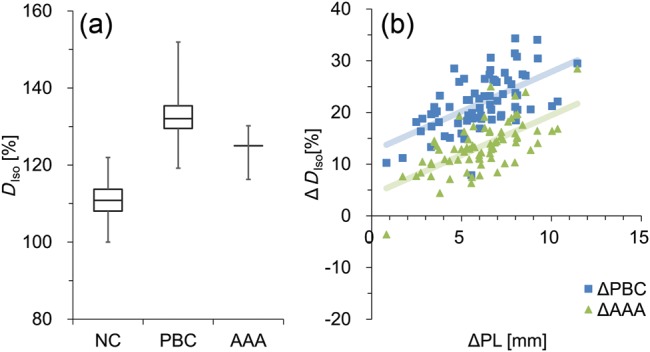
(a) The isocenter dose (DIso) calculated without (NC) and with (PBC with modified Batho and AAA) heterogeneity corrections are shown. Boxes represent median and quartile values. Whiskers represent maximum and minimum values. (b) The differences between DIso calculated without and with heterogeneity corrections (ΔDIso) are illustrated.
Target coverage
Typically, patients are treated with better than 95% target coverage, as shown in Fig. 4a indicating V100% with NC, PBC and AAA algorithms for all patients. The median V100% was 90.6% (range, 42.3–98.7%), 100.0% (range, 92.9–100.0%) and 96.0% (range, 75.6–99.9%) for NC, PBC and AAA, respectively. The long error bars indicate the variability among the patients. The average ± SD of D95% was 97.6 ± 5.0%, 114.6 ± 7.4% and 100.5 ± 2.8% for NC, PBC and AAA, respectively as shown in Fig. 4b. The D95% of PBC and AAA were larger than that of NC by 17.0% (P < 0.0001) and 2.9% (P < 0.0001), respectively. The ΔD95% of AAA plans was 14.1% smaller than that of PBC (P < 0.0001). Figure 4c illustrates the evaluation of ΔD95% of the PTV for each patient, representing a similar analysis to that of Fig.3b for DIso. The ΔPBC shows intermediate linear correlation with ΔPL (ρ = 0.58, P < 0.0001), although ΔAAA showed weaker correlation with ΔPL (ρ = 0.41, P = 0.0003).
Fig. 4.
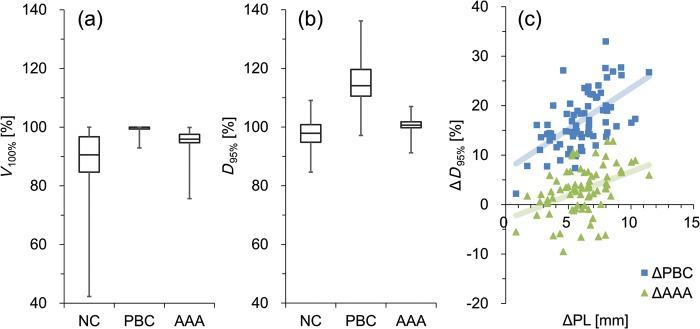
(a) The volume receiving the prescribed dose (V100%), and (b) the dose covering the 95% PTV (D95%) calculated without (NC) and with (PBC with modified Batho and AAA) heterogeneity corrections. Boxes represent median and quartile values. Whiskers represent maximum and minimum values. (c) The difference between the D95% calculated without and with heterogeneity corrections (ΔD95%) are illustrated.
Correlation with target volume
The size of the PTV is correlated with ΔDIso and ΔD95% between the dose with and without heterogeneity corrections, as shown in Fig. 5a and b, respectively. The dose differences between PBC and AAA Δ(AAA − PBC), are also plotted. Interestingly, the ΔDIso of Δ(AAA − PBC) showed significant logarithmic relationship with the PTV volume (ρ = 0.78, P < 0.0001). Almost all ΔAAA cases showed positive ΔDIso, although one patient showed a negative value. This result indicates that the effect of attenuation was larger than that of electron transport for most cases. As illustrated in Fig. 5b, the ΔD95% of Δ(AAA − PBC) showed intermediate logarithmic correlation with the PTV volume (ρ = 0.46, P < 0.0001), although the result showed a larger deviation than that of ΔDIso. Most cases of ΔAAA showed a positive value of ΔD95%, but for a small PTV volume it showed negative values, probably as a consequence of significant effects of electron transport. In Fig. 5c, the ΔD95% of Δ(AAA − PBC) were plotted against the shortest distance between the PTV and the chest wall or mediastinum. Negative distance represents the largest overlapped distance between the PTV and the chest wall. Although isolated tumors with positive distance showed moderate linear correlation with the distance (r2 = 0.62, P < 0.0001), whole cases, including tumors attached to chest wall, showed weaker correlation (r2 = 0.34, P<0.0001).
Fig. 5.
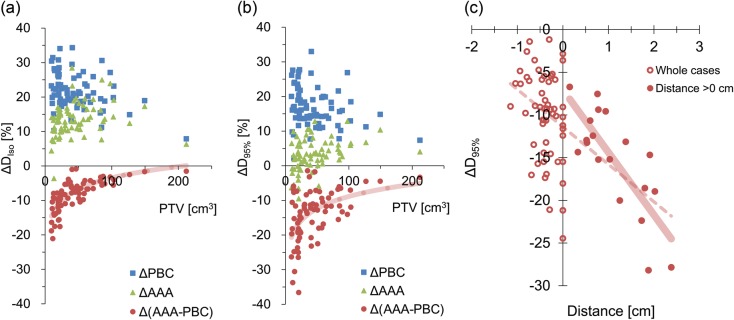
(a) ΔDIso and (b) ΔD95% between the doses without and with heterogeneity corrections were plotted for ΔPBC and ΔAAA. The dose differences between PBC and AAA are plotted with the PTV volume of each case. Lines represent the logarithmic approximation for Δ(AAA − PBC). (c) Differences in D95% between PBC and AAA are plotted against the shortest distance between the PTV and the chest wall or mediastinum. Negative distance represents the largest overlapped distance between the PTV and the chest wall. Dashed and solid lines represent linear approximations of whole cases and cases with the distance >0 cm, respectively.
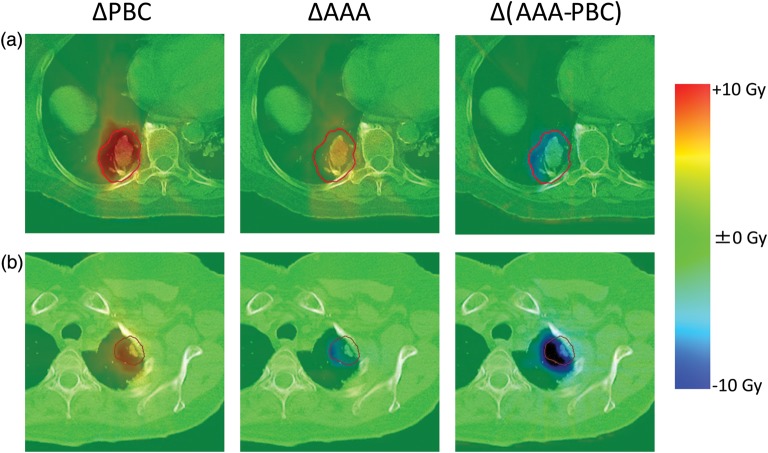
In Fig. 6, the differences in the dose distribution have been illustrated for representative patients with (a) large (102.4 cm3) and (b) small (13.2 cm3) PTV volumes. The ΔPL were 3.5 cm and 0.8 cm for patients (a) and (b), respectively. Patient (a) showed a larger attenuation effect in the ΔPBC as a consequence of a large lung:solid tissue ratio in the path length. In the Δ(AAA − PBC) of patient (b), the larger lateral electron transport effect is visualized, resulting in the negative net effect shown in ΔAAA.
Fig. 6.
Differences in dose distribution for ΔPBC, ΔAAA and Δ(AAA − PBC). The representative patients with (a) large, and (b) small tumors are illustrated.
DISCUSSION
Several studies have investigated the impact of heterogeneity corrections on the dose distribution in lung SBRT with similar findings. We demonstrated that the D95% of a PTV calculated with AAA is 2.9% larger than that of a PTV calculated with NC (Fig. 4b). Interestingly, this is the opposite of D95% results reported by Xiao et al. (−7.6%) and Schuring and Hurkmans (− 5.2%), although our results of DIso (13.4%) were similar to the previous report by Xiao et al. (12.5%) [15, 16]. Recently Ueki et al. investigated 83 patients and reported that the PTV D95% under AAA calculation was higher than that without corrections by ∼1.4% [17]. Their results for D95% were similar to ours, although they did not investigate the factors that affect the heterogeneity corrections.
We demonstrated the significant logarithmic relationship between the effect of lateral electron transport and PTV volume (Fig. 5a and b). Cases with a large PTV showed smaller effects from the lateral electron transport than those from attenuation, resulting in the positive ΔD95% of ΔAAA. In contrast, with a small PTV, the effects of electron transport become larger (Fig. 6b). Although the average PTV D95% of AAA plans is 2.9% larger than that of NC, it depends on the anatomical characteristics of the patients analyzed in this study. Schuring and Hurkmans previously investigated the effects of heterogeneity corrections on the dose distribution of 26 SBRT patients and reported that the collapsed-cone convolution algorithm showed decreased conformity with the PTV volume [16]. On the other hand, van der Voort van Zyp et al. compared EPL and the Monte Carlo algorithm with respect to tumor location and size [23]. They separated patients roughly by tumor size and reported that the difference in D95% between two algorithms was larger for small tumors. The results of previous studies that investigated various calculation algorithms cannot be simply compared without considering the variation in target volume characteristics. The lateral electron transport is affected by the medium density, size of the target volume and also by the surrounding tissue, such as chest wall. Narabayashi et al. [24] investigated the lung SBRT plans for 20 patients and reported that the ratio of MU values calculated with the Batho Power Law and Monte Carlo showed linear correlation with the distance between the PTV and the chest wall. We also analyzed the correlation between the effects of lateral electron transport and the distance between the PTV and the chest wall or mediastinum (Fig. 5c). Although the data of isolated tumors showed moderate linear correlation, the whole cases (including tumors attached to the chest wall) showed weaker correlation. To properly assess the effect of the surrounding tissue on the lateral electron transport, the area of attachment to the surrounding tissue, and the volume of the chest wall included in the PTV (and its density) should also be considered. These complexities of the lateral electron transport effects caused by the surrounding tissue will lead to larger D95% variation of Δ (AAA − PBC), illustrated in Fig. 5b.
In the current study, the treatment plans were clinically optimized based on AAA; and the beam arrangements, energy and MU were not modified when calculating with NC and PBC. The differences in dosimetric parameters between AAA and the other two algorithms become smaller with optimizing plans, although the results include the uncertainty due to the individual planning techniques. Some studies compared commercial Monte Carlo dose calculation with other algorithms for dose calculation of lung SBRT [3, 25, 26]. Li et al. noted that some of the criteria of treatment protocols for superposition might be too strict for the Monte Carlo calculation to satisfy the requirements [3]. Several previously reported that the advanced dose calculation algorithm showed worse target coverage. However, we showed in this study that the target coverage is strongly affected not only by calculation algorithms but also by the anatomic characteristics of the patients.
We demonstrated the effects of the heterogeneity correction by separating them into the attenuation and lateral electron transport components. The PBC provides photon attenuation, whereas AAA accounts for the electron transport that is needed for lung SBRT. The PTV volume shows significant correlation with the effects of the lateral electron transport with logarithmic correlation. When the patients are not classified with target volumes, the dosimetric parameters evaluated with average ± SD may not be able to assess the effects of the heterogeneity corrections properly. Several clinical trials for lung SBRT are being conducted using the target coverage-based prescription with heterogeneity corrections. It is concluded, therefore, that when radiation outcome is compared between clinical trials, dosimetric metrics, the target volume characteristics and heterogeneity correction algorithms should be properly accounted.
FUNDING
This work was supported by the Japan Society for the Promotion of Science (JSPS) Core-to-Core Program (No. 23003) and a research grant from Varian Medical Systems (No. 4513228).
ACKNOWLEDGEMENTS
This work was presented at the American Society of Therapeutic Radiation Oncology (ASTRO) 54th Annual Meeting, October 2012, Boston, USA.
REFERENCES
- 1.Timmerman R, Paulus R, Galvin J, et al. Stereotactic body radiation therapy for inoperable early stage lung cancer. JAMA. 2010;303:1070–6. doi: 10.1001/jama.2010.261. [DOI] [PMC free article] [PubMed] [Google Scholar]
- 2.Onishi H, Araki T, Shirato H, et al. Stereotactic hypofractionated high-dose irradiation for stage I nonsmall cell lung carcinoma: clinical outcomes in 245 subjects in a Japanese multinstitutional study. Cancer. 2004;101:1623–31. doi: 10.1002/cncr.20539. [DOI] [PubMed] [Google Scholar]
- 3.Li J, Galvin J, Harrison A, et al. Dosimetric verification using Monte Carlo calculations for tissue heterogeneity-corrected conformal treatment plans following RTOG 0813 dosimetric criteria for lung cancer stereotactic body radiotherapy. Int J Radiat Oncol Biol Phys. 2012;84:508–13. doi: 10.1016/j.ijrobp.2011.12.005. [DOI] [PMC free article] [PubMed] [Google Scholar]
- 4.Das IJ, Ding GX, Ahnesjö A. Small fields: non-equilibrium radiation dosimetry. Med Phys. 2008;35:206–15. doi: 10.1118/1.2815356. [DOI] [PubMed] [Google Scholar]
- 5.Aarup LR, Nahum AE, Zacharatou C, et al. The effect of different lung densities on the accuracy of various radiotherapy dose calculation methods: implications for tumour coverage. Radiother Oncol. 2009;91:405–14. doi: 10.1016/j.radonc.2009.01.008. [DOI] [PubMed] [Google Scholar]
- 6.Ahnesjo A. Collapsed cone convolution of radiant energy for photon dose calculation in heterogeneous media. Med Phys. 1989;16:577–92. doi: 10.1118/1.596360. [DOI] [PubMed] [Google Scholar]
- 7.Bragg CM, Conway J. Dosimetric verification of the anisotropic analytical algorithm for radiotherapy treatment planning. Radiother Oncol. 2006;81:315–23. doi: 10.1016/j.radonc.2006.10.020. [DOI] [PubMed] [Google Scholar]
- 8.Bush K, Gagne IM, Zavgorodni S, et al. Dosimetric validation of Acuros XB with Monte Carlo methods for photon dose calculations. Med Phys. 2011;38:2208–21. doi: 10.1118/1.3567146. [DOI] [PubMed] [Google Scholar]
- 9.Vanderstraeten B, Reynaert N, Paelinck L, et al. Accuracy of patient dose calculation for lung IMRT: a comparison of Monte Carlo, convolution/superposition, and pencil beam computations. Med Phys. 2006;33:3149–58. doi: 10.1118/1.2241992. [DOI] [PubMed] [Google Scholar]
- 10.Nishio T, Kunieda E, Shirato H, et al. Dosimetric verification in participating institutions in a stereotactic body radiotherapy trial for stage I non-small cell lung cancer: Japan clinical oncology group trial (JCOG0403) Phys Med Biol. 2006;51:5409–17. doi: 10.1088/0031-9155/51/21/002. [DOI] [PubMed] [Google Scholar]
- 11.Ding GX, Duggan DM, Lu B, et al. Impact of inhomogeneity corrections on dose coverage in the treatment of lung cancer using stereotactic body radiation therapy. Med Phys. 2007;34:2985–94. doi: 10.1118/1.2745923. [DOI] [PubMed] [Google Scholar]
- 12.Jones AO, Das IJ. Comparison of inhomogeneity correction algorithms in small photon fields. Med Phys. 2005;32:766–76. doi: 10.1118/1.1861154. [DOI] [PubMed] [Google Scholar]
- 13.Jones AO, Das IJ, Jones FL. A Monte Carlo study of IMRT beamlets in homogeneous media. Med Phys. 2003;30:296–300. doi: 10.1118/1.1539040. [DOI] [PubMed] [Google Scholar]
- 14.Hurkmans CW, Cuijpers JP, Lagerwaard FJ, et al. Recommendations for implementing stereotactic radiotherapy in peripheral stage IA non-small cell lung cancer: report from the Quality Assurance Working Party of the randomised phase III ROSEL study. Radiat Oncol. 2009;4:1. doi: 10.1186/1748-717X-4-1. [DOI] [PMC free article] [PubMed] [Google Scholar]
- 15.Xiao Y, Papiez L, Paulus R, et al. Dosimetric evaluation of heterogeneity corrections for RTOG 0236: stereotactic body radiotherapy of inoperable stage I–II non-small-cell lung cancer. Int J Radiat Oncol Biol Phys. 2009;73:1235–42. doi: 10.1016/j.ijrobp.2008.11.019. [DOI] [PMC free article] [PubMed] [Google Scholar]
- 16.Schuring D, Hurkmans CW. Developing and evaluating stereotactic lung RT trials: what we should know about the influence of inhomogeneity corrections on dose. Radiat Oncol. 2008;3:21. doi: 10.1186/1748-717X-3-21. [DOI] [PMC free article] [PubMed] [Google Scholar]
- 17.Ueki N, Matsuo Y, Shibuya K, et al. Differences in the dose-volume metrics with heterogeneity correction status and its influence on local control in stereotactic body radiation therapy for lung cancer. J Radiat Res. 2013;54:337–43. doi: 10.1093/jrr/rrs084. [DOI] [PMC free article] [PubMed] [Google Scholar]
- 18.Varian Medical Systems. Eclipse Algorithms Reference Guide. 2010 P/N B502679R01B. [Google Scholar]
- 19.Ulmer W, Pyyry J, Kaissl W. A 3D photon superposition/convolution algorithm and its foundation on results of Monte Carlo calculations. Phys Med Biol. 2005;50:1767–90. doi: 10.1088/0031-9155/50/8/010. [DOI] [PubMed] [Google Scholar]
- 20.Van Esch A, Tillikainen L, Pyykkonen J, et al. Testing of the analytical anisotropic algorithm for photon dose calculation. Med Phys. 2006;33:4130–48. doi: 10.1118/1.2358333. [DOI] [PubMed] [Google Scholar]
- 21.Fogliata A, Nicolini G, Vanetti E, et al. Dosimetric validation of the anisotropic analytical algorithm for photon dose calculation: fundamental characterization in water. Phys Med Biol. 2006;51:1421–38. doi: 10.1088/0031-9155/51/6/004. [DOI] [PubMed] [Google Scholar]
- 22.Storchi P, Woudstra E. Calculation of the absorbed dose distribution due to irregularly shaped photon beams using pencil beam kernels derived from basic beam data. Phys Med Biol. 1996;41:637–56. doi: 10.1088/0031-9155/41/4/005. [DOI] [PubMed] [Google Scholar]
- 23.van der Voort van Zyp NC, Hoogeman MS, van de Water S, et al. Clinical introduction of Monte Carlo treatment planning: a different prescription dose for non-small cell lung cancer according to tumor location and size. Radiother Oncol. 2010;96:55–60. doi: 10.1016/j.radonc.2010.04.009. [DOI] [PubMed] [Google Scholar]
- 24.Narabayashi M, Mizowaki T, Matsuo Y, et al. Dosimetric evaluation of the impacts of different heterogeneity correction algorithms on target doses in stereotactic body radiation therapy for lung tumors. J Radiat Res. 2012;53:777–84. doi: 10.1093/jrr/rrs026. [DOI] [PMC free article] [PubMed] [Google Scholar]
- 25.Takahashi W, Yamashita H, Saotome N, et al. Evaluation of heterogeneity dose distributions for Stereotactic Radiotherapy (SRT): comparison of commercially available Monte Carlo dose calculation with other algorithms. Radiat Oncol. 2012;7:20. doi: 10.1186/1748-717X-7-20. [DOI] [PMC free article] [PubMed] [Google Scholar]
- 26.Mampuya WA, Matsuo Y, Nakamura A, et al. Differences in dose-volumetric data between the analytical anisotropic algorithm and the x-ray voxel Monte Carlo algorithm in stereotactic body radiation therapy for lung cancer. Med Dosim. 2013;38:95–9. doi: 10.1016/j.meddos.2012.07.007. [DOI] [PubMed] [Google Scholar]


