Abstract
The influence of deviations in dwell times and source positions for 192Ir HDR-RALS was investigated. The potential dose errors for various kinds of brachytherapy procedures were evaluated. The deviations of dwell time ΔT of a 192Ir HDR source for the various dwell times were measured with a well-type ionization chamber. The deviations of source position ΔP were measured with two methods. One is to measure actual source position using a check ruler device. The other is to analyze peak distances from radiographic film irradiated with 20 mm gap between the dwell positions. The composite dose errors were calculated using Gaussian distribution with ΔT and ΔP as 1σ of the measurements. Dose errors depend on dwell time and distance from the point of interest to the dwell position. To evaluate the dose error in clinical practice, dwell times and point of interest distances were obtained from actual treatment plans involving cylinder, tandem-ovoid, tandem-ovoid with interstitial needles, multiple interstitial needles, and surface-mold applicators. The ΔT and ΔP were 32 ms (maximum for various dwell times) and 0.12 mm (ruler), 0.11 mm (radiographic film). The multiple interstitial needles represent the highest dose error of 2%, while the others represent less than approximately 1%. Potential dose error due to dwell time and source position deviation can depend on kinds of brachytherapy techniques. In all cases, the multiple interstitial needles is most susceptible.
Keywords: dwell time, source position, 192Ir, dose error, RALS
INTRODUCTION
The radioactive source and seed used in brachytherapy can emit photons or electrons in all directions. Dosimetrically, this means that the dose gradient around a brachytherapy source is very steep, and the dose decreases exponentially with the thickness of the material or tissue. Therefore, by implanting the source near or into the tumor region, high conformity of prescribed dose to the target and reduction of unwanted dose to healthy organs surrounding the tumor region can be obtained.
The use of CT or MR images in treatment planning for brachytherapy has been widely employed as image-guided brachytherapy (IGBT). Over the past few years, a number of studies have been conducted on various IGBT techniques [1–4]. Dose distributions can be customized to fit the target for each patient by referring to actual anatomy from CT or MR images instead of film-based planning. Furthermore, recently, sophisticated dwell time optimization techniques, such as graphical optimization and inverse planning anatomy-based dose optimization, has been implemented in commercial treatment planning systems (TPSs) [5–9].
Treatment parameters (including dwell times and dwell positions of the radioactive source calculated by TPSs) are transferred to the treatment machine, such as a remote afterloading system (RALS), manufactured e.g. by Nucletron, an Elekta company (MicroSelectron®, Stockholm, Sweden), Varian Medical Systems Inc. (VariSourceTM, Palo Alto, CA, USA), or Eckert & Ziegler Bebig SA (MultiSource®, Seneffe, Belgium). The RALS should provide high precision control of the movement of the radioactive source as planned in terms of the dwell times and dwell positions in the applicators in which the source moves. Mechanical accuracies of movement of the radioactive source have been referred to in some quality assurance/quality control (QA/QC) guidelines for high-dose-rate (HDR) RALS [10–13]. For example, AAPM Task Group 40 and Task Group 56 refer to a tolerance of source positioning of ±1 mm [10, 11]. ESTRO Booklet No. 8 recommend an action level of source positioning accuracy of ±2 mm [12]. The tolerance or action level can be applicable for the scheduled QA/QC treatment machine. However, it is not obvious how these figures relate to clinical practice, and they lack practical value in terms of clinical influence. It has been further suggested that these values can be applied to all of the irradiation techniques in brachytherapy, such as surface-mold and interstitial brachytherapy, etc. Actually, dose error due to deviation of the source position depends on the distance from the source according to the inverse square law. A large dose error can be observed near the source, but the dose error far from the source is less.
Similarly, the impact of dose change caused by dwell time error can be expected to be linearly dependent on total dwell time. For instance, a tiny dwell time error can have a large impact in the case of low dwell time. In particular, the graphical optimization and inverse-planning anatomy-based dose optimization of the commercially available TPSs performs calculations of the dwell times without putting a lower limit on dwell time. Therefore, it is important to investigate dose error for such brachytherapy techniques, which freely use a low dwell time.
Dose error from mechanical uncertainties of movement of the source can depend on the kind of irradiation technique used, and its clinical influence is not fully understood. Our purpose in this study was to evaluate the dose error for clinical treatment plans involving a range of irradiation applicators/catheters, such as cylinder, tandem/ovoid, tandem/ovoid with a small number of interstitial needle applicators (‘Combination-brachytherapy’), multiple interstitial needle applicators, and surface-mold applicators for scalp tumors.
In this study, deviations in dwell time and source position were measured for a number of techniques. Finally, the influence of the dose error due to both deviations was investigated for actual treatment plans involving the various applicators or catheters listed above.
MATERIALS AND METHODS
Measurements of deviation of dwell time and source position
For 192Ir HDR-RALS (MicroSelectron® V2, Nucletron, an Elekta company), the deviation in dwell time ΔT and source position ΔP were measured for a range of techniques [12–16]. For two measurements, the air kerma strength was ∼30.0 mGy m2 h−1. The Nucletron RALS has a nominal time resolution of 0.1 s. As shown in Eq. (1), dwell time, Tm was obtained from the amount of electric charge measured by a well-type ionization chamber (WIC) and an electrometer (HDR-1000 plus and MAX-4000, Standard Imaging Inc., Middleton, WI, USA). The correction factor kTP was applied to convert the cavity air mass at the reference conditions (temperature T0 22°C and pressure P0 101.3 kPa) [13].
Dwell time Tm can be obtained from the amount of net electric charge (M − MEF) and the current A0 of the WIC during the irradiation, as shown in the following equation.
| (1) |
MEF means amount of electric charge in the end effect of a source, and it can be regarded as a constant independent of dwell time. Therefore, a standard deviation of dwell time Tm can be equal to that of M/A0. The dwell time deviation ΔT was defined as a maximum value for a standard deviation of 10 measurements of M/A0 for nominal dwell time T of 0.1, 0.2, 0.5, 1.0, 5.0, 15.0 and 30.0 s.
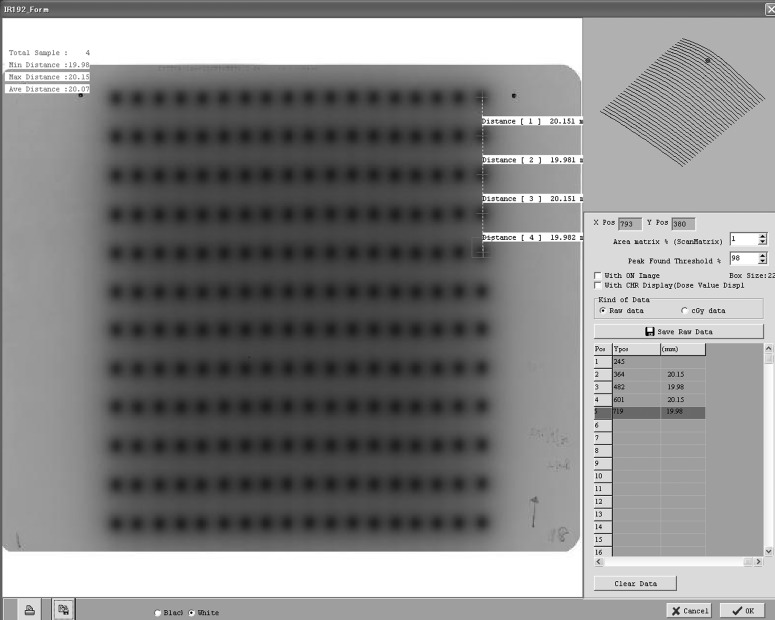
The deviations in the source positions were measured with two methods. One method involved measuring the position of the source with a source position check ruler device specifically developed for MicroSelectron® and provided by Nucletron, an Elekta company. The MicroSelectron® was set up to place the source in a certain position via the ruler connected by a straight transfer tube. By reading the actual source position, the standard deviation of the position deviation was obtained. A total of 11 measurements were performed to obtain a standard deviation. The other method involved irradiation of radiographic film (EDR2, Carestream Health Inc., Rochester, NY, USA) with applicators tightly attached to it. Irradiation was performed with 2-cm gaps between the dwell positions, and the number of gaps was 198. The exposed films were digitized with an EPSON ES-8500 flatbed scanner under resolution conditions of 600 dpi (equivalent to 0.042 mm/pixel) and a 16-bit gray scale. The digitized images were analyzed using film QA software (DD-system Ver. 10.21, R-TECH Company, Tokyo, Japan) as shown in Fig. 1. The source position deviation ΔP was defined as the maximum of a standard deviation for two tests (ruler and radiographic film).
Fig. 1.
Radiographic film EDR2 (Carestream Health Inc.) was analyzed for the measurement of source position accuracy using film QA software DD-system Ver. 10.21 (R-TECH Company).
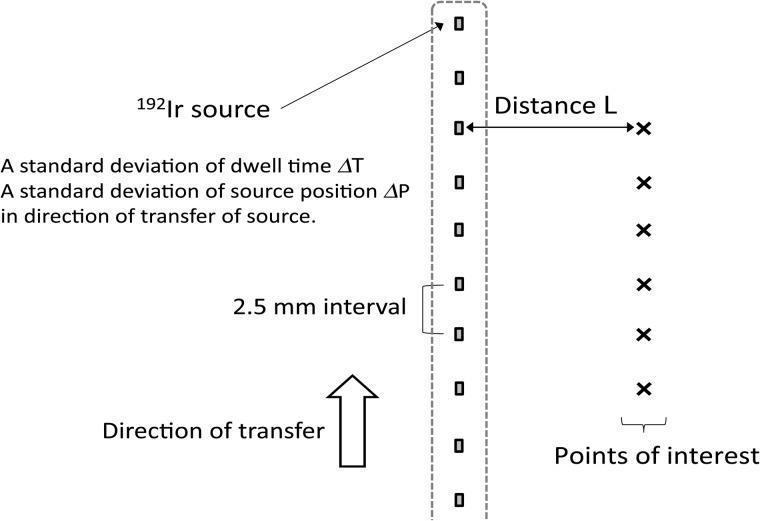
Evaluation of dose error in single catheter method
As shown in Fig. 2, we calculated the dose errors at the points of interest due to deviations in both dwell time ΔT and source position ΔP, using the methods as described in the previous section. Two deviations were used as a standard deviation (according to Gaussian distribution) in the development environment of Microsoft Visual Studio 2010 instead of the commercial TPS. Dose calculation with a grid size of 1.0 mm was performed according to AAPM TG-43 protocol [17–19], as is typically used for dose calculation in brachytherapy TPS. Points of interest were placed at a distance L from each dwell position in the perpendicular direction of a catheter. A total of 10 dwell positions with a 2.5-mm distance from each source was investigated. Dose deviations were defined as the mean value for a standard deviation of the dose at the points of interest in 10 trials.
Fig. 2.
Dose errors at points of interest for a single catheter calculated according to the AAPM TG-43 protocol [17–19] due to the two deviations: dwell time deviation ΔT and source position deviation ΔP.
Evaluation of dose calculation error in various clinical treatment plans
Dose error at the points of interest is affected by two factors: dwell time and distance of the point of interest from the source. In order to evaluate the influence of the two deviations, ΔT and ΔP, for a clinical treatment plan, we measured the dwell times and distance to points of interest in the actual treatment plan for a range of applicator types, such as cylinder, tandem/ovoid, combination-brachytherapy, multiple interstitial needle applicators, and surface-mold applicators for scalp tumors, in TPS Oncentra Brachy Ver. 4.1.0.132 (Nucletron, Veenendaal, Netherland). Table 1 provides information about the treatment plans for the various applicator types investigated here.
Table 1.
Treatment plans using various kinds of applicators or catheters
| Applicators or catheters | # treatment plans | Prescribed dose (Gy) | Method of optimizing dose distribution |
|---|---|---|---|
| Cylinder | 16 | 6 | Dose point optimization to 5 mm under vaginal surface |
| Tandem/ovoid | 17 | 6 | Manchester system |
| Combination-brachytherapy | 9 | 6 | Inverse planning based on dose–volume histogram and graphical optimization |
| Multiple interstitial needle applicators | 8 | 6 | |
| Surface-mold for scalp tumor | 5 | 2–2.5 | Dose point and graphical optimization |
As time passes, dwell times for the same treatment plan must be increased in order to compensate for the decay of the radioactivity source (half-life of 192Ir = 73.83 d). In other words, air kerma strength is higher, e.g., just after the replacement of an 192Ir source. A maximum value SK of 48.56 mGy m2 h−1 was obtained from the 43 measurements taken between February 2002 and December 2012 in our institute (average ± 1SD, 42.21 ± 3.06 mGy m2 h−1). Dwell times for all of the treatment plans listed in Table 1 were recalculated using the maximum SK of 48.56 mGy m2 h−1, because a large dose error can be observed in the case of low dwell time.
In this study, the distance to the point of interest was defined by the equation below. We used the geometrical averaged distance rg of the point of interest from catheter, rg.
| (2) |
This equation can be derived from . V100% means the irradiated volume receiving the prescribed dose or more, and it can be obtained from the dose–volume histogram in the TPS. The li is assumed to be the length of treatment region of the ith catheter. The gap between the dwell positions was set to a 2.5-mm interval. Therefore, the length of treatment region li could be expressed as a multiplication of the 2.5 mm interval by the number of dwell positions.
RESULTS
Measurements of deviation of dwell time and source position
Dwell time deviation was measured with a WIC. The standard deviations of dwell time for 10 measurements are shown in Table 2. From these results, the maximum standard deviation was found to be 32 ms for a dwell time of 30.0 s.
Table 2.
Dwell time deviation for Nucletron RALS measured with a WIC
| Dwell time (s) | 0.1 | 0.2 | 0.5 | 1.0 | 5.0 | 15.0 | 30.0 |
| Deviation (ms) | 18 | 17 | 23 | 23 | 29 | 23 | 32 |
Deviation of the source position in the Nucletron RALS was measured using the two methods. The standard deviation of the source position was 0.12 mm and 0.11 mm in measurements using either the source position check ruler device (n = 11) or radiographic film (n = 198), respectively. The dwell time and source position deviation in this study were regarded as a standard deviation according to Gaussian distribution, ΔT = 32 ms and ΔP = 0.12 mm (worst case scenario).
Dose error in a single catheter by calculation
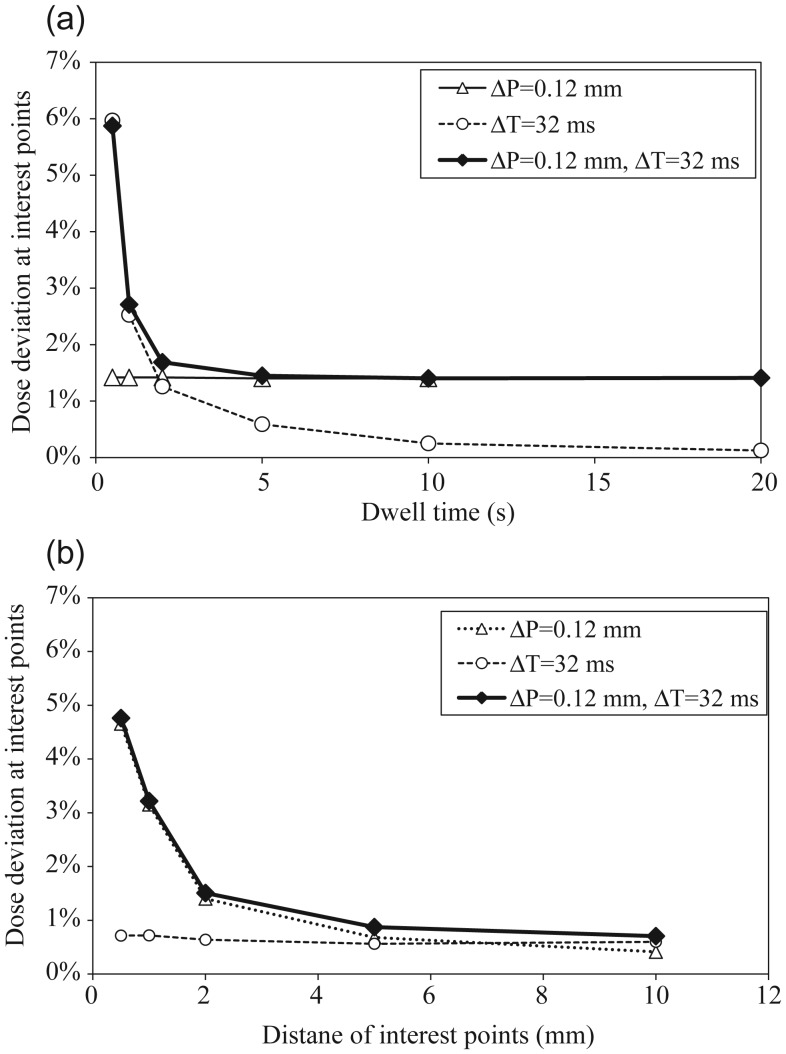
Figure 3a depicts the calculated dose errors as a function of dwell time with points of interest placed at a fixed distance of 5 mm with the measured two deviations, using ΔT = 32 ms and ΔP = 0.12 mm as the standard deviation according to the Gaussian distribution. Dose errors were calculated with three conditions: with either ΔT, ΔP, or both of them to reveal the contribution of each deviation to the total dose error. Using only ΔP, the dose error was constant independent of the dwell time. Using only ΔT, the dose error decreased with an increased dwell time. For both two deviations, the dose error also decreased with an increase in dwell time, and was a composite of the graphs when using only ΔP and only ΔT. Figure 3b depicts the calculated dose errors as a function of distance L to the point of interest with a fixed dwell time of 2 s and the two measured deviations, ΔT = 32 ms and ΔP = 0.12 mm generating the standard deviation according to Gaussian distribution. Dose errors were also calculated according to these assumptions in Fig. 3a. With only ΔP, the dose error decreased with an increase in distance L to the point of interest. The dose error approached zero, because ΔP is less influential for a point distant from the source. Using only ΔT, the dose error remained constant, because dose was linearly proportional to the dwell time. With both deviations, the dose error also decreased with increase in distance to the point of interest, and was a composite of the graphs with only ΔP and only ΔT.
Fig. 3.
Dose error for ΔT = 32 ms and ΔP = 0.12 mm: (a) dose error at points of interest placed at a fixed distance of 5 mm as a function of dwell time by calculation. (b) Dose error for a fixed dwell time of 2 s as a function of distance to points of interest by calculation.
As shown in Fig. 3, the dose error depended on two factors: dwell time and distance to the point of interest. Figure 4 depicts a 2D-plot of the dose errors with the two measured deviations, ΔT = 32 ms and ΔP = 0.12 mm. As shown in the figure, a high dose error could be observed near the source for a small dwell time.
Fig. 4.
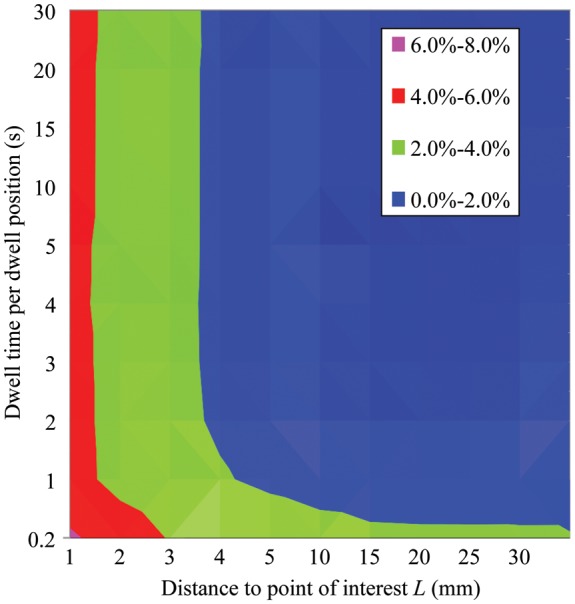
2D-plot of dose error for dwell times and distance to point of interest L for ΔT = 32 ms and ΔP = 0.12 mm.
Dwell time and distance to the point of interest for clinical treatment plans
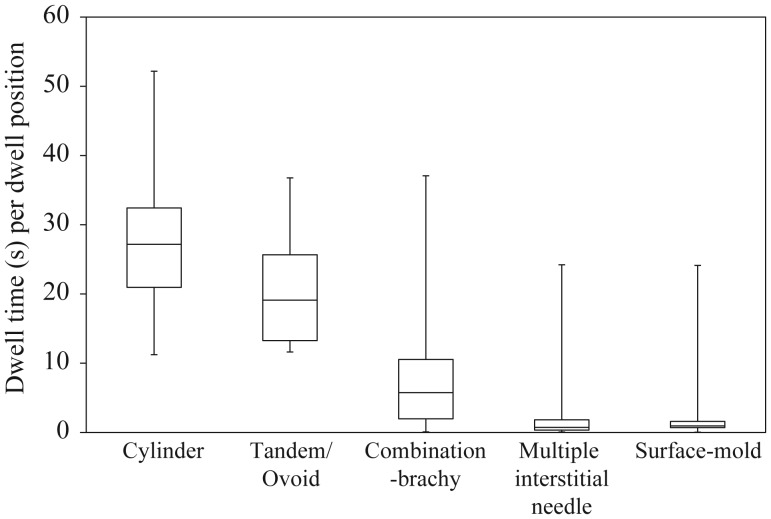
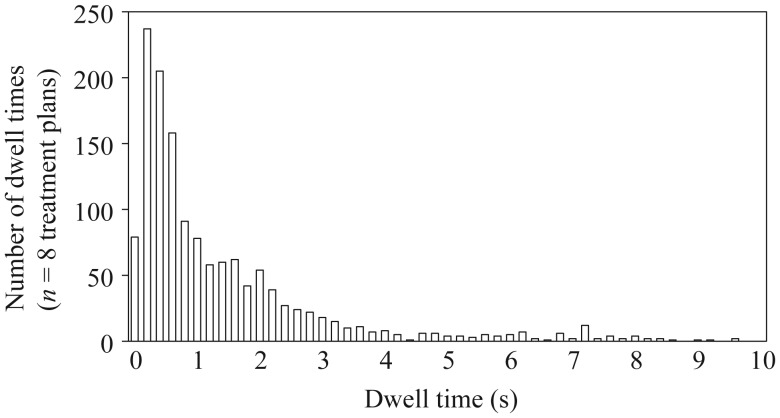
Figure 5 depicts the box-and-whisker plot of dwell times per dwell position in the actual clinical treatment plans as described in Table 1. The median dwell time for each dwell position was 27.18, 19.10, 5.74, 0.73 and 0.95 s for the cylinder, tandem/ovoid, combination-brachytherapy, multiple interstitial needle applicators, and surface-mold applicators for scalp tumors, respectively. The lower quartile of dwell times was 20.96, 13.26, 1.97, 0.34 and 0.69 s, respectively. For instance, Fig. 6 depicts a distribution of dwell times for the multiple interstitial needle applicators (n = 8 treatment plans).
Fig. 5.
The box-and-whisker plot of the dwell times per source position for the clinical treatment plans (see Table 1).
Fig. 6.
Distribution of dwell times for the multiple interstitial needle applicators (n = 8 treatment plans). Inverse planning and graphical optimization are used to optimize dwell time in the Treatment Planning System.
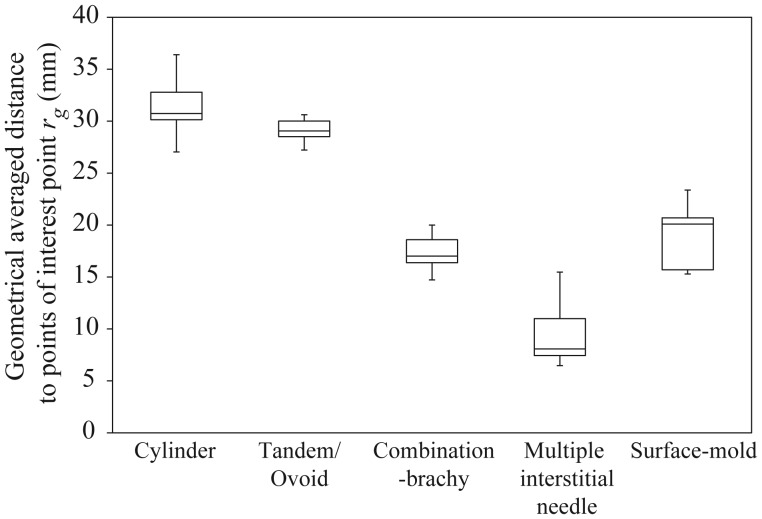
Figure 7 depicts the box-and-whisker plot of the geometrical averaged distance to the point of interest rg derived from Eq. (2) for the clinical treatment plans (see Table 1). The median value of rg was 30.73, 29.06, 17.01, 8.08 and 20.10 mm in the cylinder, tandem/ovoid, combination-brachytherapy, multiple interstitial needle applicators, and surface-mold applicators for scalp tumors, respectively. The lower quartile of rg was 30.14, 28.51, 16.37, 7.44 and 15.70 mm, respectively. Furthermore, minimum rg was 27.03, 27.22, 14.72, 6.47, and 15.29 mm, respectively.
Fig. 7.
The box-and-whisker plot of the geometrical averaged distance to the point of interest derived from Eq. (2) for clinical treatment plans (see Table 1).
Potential dose error for clinical treatment plans
We adopted the results of the dose error for a single catheter by calculations from clinical treatment plans. We introduced the median value of Figs 5 and 7 as a representative expression of the treatment plans. This condition assumed that the dwell time and the distance to the point of interest for all activations can be considered equivalent to the median value. Table 3 lists the potential dose errors that were obtained from the 2D-plot of the dose error indicated by the two median values.
Table 3.
Potential dose errors for clinical treatment plans (see Table 1) with ΔT = 32 ms and ΔP = 0.12 mm from measurements
| Applicators or catheters | (ΔT, ΔP) = (32 ms, 0.12 mm) |
|---|---|
| Potential dose error | |
| Cylinder | ∼0.1% |
| Tandem/ovoid | ∼0.2% |
| Combination-brachytherapy | ∼0.3% |
| Multiple interstitial needle applicators | ∼2.0% |
| Surface-mold for scalp tumor | ∼1.3% |
DISCUSSION
In brachytherapy, there are many uncertainties in the prescribed dose for the overall treatment process such as the uncertainty in calculating the absolute dose [17–19] and the effect of inhomogeneity [20–24], the mechanical accuracy of the source movement, and the intra- and inter-fractional displacements of the applicators or catheters, which cause substantial dose deviation from the planned dose. Of these uncertainties, we focus upon the dose errors caused only by the mechanical uncertainties of movement of the source in 192Ir HDR-RALS in terms of dwell time and source position.
The dwell time deviation was obtained from the amount of electric charge from the WIC during the irradiation [see Eq. (1)]. This measurement is considered to be influenced by the deviation, both in dwell time and source position. However, we could neglect the influence of deviation in the source position, for the following reason. For this measurement, the 192Ir source was located at a predetermined position in the WIC where the amount of electric charge represented the maximum. The behavior of the amount of electric charge in this region can be comparatively flat for a variable source position. For example, a displacement of 0.1 mm in the source position causes a change in the amount of electric charge by 0.001%. This corresponds to a dwell time of 1 ms. Therefore, the amount of electric charge is weakly dependent on the deviation of the source position.
The Nucletron RALS has high precision control of the dwell time of a source independent of dwell time (Table 2). We determined source position deviation via two methods, and the results obtained from each in this study were similar. Mechanical accuracy of the source movement in the short term was also evaluated. Actually, deterioration of the motor controlling source movement can happen abruptly or can gradually worsen in the long term. The long-term mechanical accuracy needs to be further investigated.
From Fig. 3, it is clear how dose error at the point of interest for a single catheter can change with variable dwell time and distance to the point of interest from a source. In the case of low dwell time and placement of the point of interest near a source, dose error can be expected to be high. Therefore, it is important that the effect of both deviations is taken into account when evaluating potential dose error for different the brachytherapy techniques. Of all the brachytherapy techniques investigated, the smallest and largest dwell times were obtained with the multiple interstitial needle and cylinder applicators, respectively (see Fig. 5). Additionally, the brachytherapy techniques having the smallest and largest distance to the point of interest from the source were also the multiple interstitial needle and cylinder applicators, respectively (see Fig. 7).
As shown in Table 3, all of the catheters or applicators represented fell within a 2% dose error. This is because the Nucletron RALS has high precision control of the movement of the radioactive 192Ir source, ΔT = 32 ms and ΔP = 0.12 mm. The finding is that the potential dose error depends on the kind of brachytherapy technique used. Of all the techniques investigated, the multiple interstitial needle applicators could introduce the most error, ∼2.0% potential dose error. A procedure for evaluation of the potential dose error, applicable for all brachytherapy techniques, was proposed in this study. The authors recommended that the user establish the 2D-plot for dwell time and distance to the point of interest with the measured accuracy of movement of the source, and need to evaluate the potential dose error caused by mechanical uncertainties of movement of the source for the brachytherapy techniques used in a particular institute.
CONCLUSIONS
Mechanical uncertainties in the 192Ir HDR-RALS (Nucletron, an Elekta company), a dwell time deviation ΔT of 32 ms and a source position deviation ΔP of 0.12 mm were obtained from measurements. The finding was that the Nucletron HDR-RALS has high precision control of the movement of the radioactive 192Ir source in terms of dwell time and source position. The potential dose error caused by the two deviations depends on the kind of brachytherapy technique used. Of the techniques studied, multiple interstitial needle applicators have the highest susceptibility to dwell time deviation and source position deviation.
FUNDING
This study was partially supported by the Cancer Research Development Fund (23-A-13) of the National Cancer Center and the Cancer Clinical Research Fund of the Ministry of Welfare, Health and Labor.
ACKNOWLEDGEMENTS
The authors would like to thank all of the staff involved in brachytherapy in our hospital.
REFERENCES
- 1.Nag S, Bice W, Wyngaert K, et al. Proposed guidelines for image-based intracavitary brachytherapy for cervical carcinoma: report from Image-Guided Brachytherapy Working Group. Int J Radiat Oncol Biol Phys. 2004;60:1160–72. doi: 10.1016/j.ijrobp.2004.04.032. [DOI] [PubMed] [Google Scholar]
- 2.Pötter R, Haie-meder C, Limbergen EV, et al. Recommendations from gynecological (GYN) GEC ESTRO working group (II): Concepts and terms in 3D image-based treatment planning in cervix cancer brachytherapy—3D dose volume parameters and aspects of 3D image-based anatomy, radiation physics, radiobiology. Radiother Oncol. 2006;78:67–77. doi: 10.1016/j.radonc.2005.11.014. [DOI] [PubMed] [Google Scholar]
- 3.Vishwanathan AN, Cormack R, Holloway CL, et al. Magnetic resonance-guided interstitial therapy for vaginal recurrence of endometrial cancer. Int J Radiat Oncol Biol Phys. 2006;66:91–9. doi: 10.1016/j.ijrobp.2006.04.037. [DOI] [PubMed] [Google Scholar]
- 4.Yoshida K, Yamazaki H, Takenaka T, et al. A dose-volume analysis of magnetic resonance imaging-aided high-dose-rate image-based interstitial brachytherapy for uterine cervical cancer. Int J Radiat Oncol Biol Phys. 2010;77:765–72. doi: 10.1016/j.ijrobp.2009.05.027. [DOI] [PubMed] [Google Scholar]
- 5.Lessard E, Pouliot J. Inverse planning anatomy-based dose optimization for HDR-brachytherapy of the prostate using fast simulated annealing algorithm and dedicated objective function. Med Phys. 2001;28:773–9. doi: 10.1118/1.1368127. [DOI] [PubMed] [Google Scholar]
- 6.Hsu IH, Lessard E, Weinberg V, et al. Comparison of inverse planning simulated annealing and geometrical optimization for prostate high-dose-rate brachytherapy. Int J Radiat Oncol Biol Phys. 2004;3:147–52. doi: 10.1016/j.brachy.2004.05.007. [DOI] [PubMed] [Google Scholar]
- 7.Tanderup K, Hellebust TP, Honoré HB, et al. Dose optimization in single plane interstitial brachytherapy. Radiother Oncol. 2006;81:105–11. doi: 10.1016/j.radonc.2006.08.021. [DOI] [PubMed] [Google Scholar]
- 8.Morton GC, Sankreacha R, Halina P, et al. A comparison of anatomy-based inverse planning with simulated annealing and graphical optimization for high-dose-rate prostate brachytherapy. Brachytherapy. 2008;7:12–6. doi: 10.1016/j.brachy.2007.10.001. [DOI] [PubMed] [Google Scholar]
- 9.Yoshio K, Murakami N, Morota M, et al. Inverse planning for combination of intracavitary and interstitial brachytherapy for locally advanced cervical cancer. J Radiat Res. 2013;54:1146–52. doi: 10.1093/jrr/rrt072. [DOI] [PMC free article] [PubMed] [Google Scholar]
- 10.Kutcher J, Coia L, Gillin M, et al. AAPM Report No. 46. New York: American Association of Physicists in Medicine American Institute of Physics (AAPM); 1994. Comprehensive QA for Radiation Oncology: Report of AAPM Radiation Therapy Committee Task Group 40. [DOI] [PubMed] [Google Scholar]
- 11.Nath R, Anderson LL, Meli J, et al. Code of practice for brachytherapy physics: Report of the AAPM Radiation Therapy Committee Task Group No. 56. Med Phys. 1997;24:1557–98. doi: 10.1118/1.597966. [DOI] [PubMed] [Google Scholar]
- 12.Venselaar J, Perez-Calatayud J. A practical guide to quality control of brachytherapy equipment. ESTRO Booklet No. 8. 2004 The European Society for Therapeutic Radiology and Oncology. [Google Scholar]
- 13.Sakata S, Tomaru T, Hayami A, et al. Tokyo: Tsusyousangyoukenkyu-sya; 2000. Standard Measurement of Absorbed Dose in Brachytherapy; pp. 61–3. (in Japanese) [Google Scholar]
- 14.Aldelaijan S, Mohammed H, Tomic N, et al. Radiochromic film dosimetry of HDR 192Ir source radiation fields. Med Phys. 2011;38:6074–83. doi: 10.1118/1.3651482. [DOI] [PubMed] [Google Scholar]
- 15.Evans MDC, Devic S, Podgorsak EB. High dose-rate brachytherapy source position quality assurance using radiochromic film. Med Dosim. 2007;32:13–5. doi: 10.1016/j.meddos.2006.10.001. [DOI] [PubMed] [Google Scholar]
- 16.Williamson JF, Ezzell GA, Olch AO, et al. Quality assurance for high dose rate brachytherapy. In: Nag S, editor. High Dose Rate Brachytherapy, A Textbook. Armonk, New York: Futura Publishing Company; 1994. pp. 147–212. [Google Scholar]
- 17.Nath R, Anderson LL, Luxton G, et al. Dosimetry of interstitial brachytherapy sources: Recommendations of the AAPM Radiation Therapy Committee Task Group 43. Med Phys. 1995;22:209–34. doi: 10.1118/1.597458. [DOI] [PubMed] [Google Scholar]
- 18.Rivard MJ, Coursey BM, DeWerd LA, et al. Update of AAPM Task Group No. 43 Report: a revised AAPM protocol for brachytherapy dose calculations. Med Phys. 2004;31:633–74. doi: 10.1118/1.1646040. [DOI] [PubMed] [Google Scholar]
- 19.Rivard MJ, Butler WM, DeWerd LA, et al. Supplement to the 2004 update of the AAPM Task Group No. 43 Report. Med Phys. 2007;34:2187–205. doi: 10.1118/1.2736790. [DOI] [PubMed] [Google Scholar]
- 20.Daskalov GM, Kirov AS, Williamson JF. Analytical approach to heterogeneity correction factor calculation for brachytherapy. Med Phys. 1998;25:722–35. doi: 10.1118/1.598254. [DOI] [PubMed] [Google Scholar]
- 21.Richardson SL, Pino R. Dosimetric effects of an air cavity for the SAVITM partial breast irradiation applicator. Med Phys. 2010;37:3919–26. doi: 10.1118/1.3457328. [DOI] [PubMed] [Google Scholar]
- 22.Chandola RM, Tiwari S, Kowar MK, et al. Effect of inhomogeneities and source position on dose distribution of nucletron high dose rate Ir-192 brachytherapy source by Monte Carlo simulation. J Cancer Res Ther. 2010;6:54–7. doi: 10.4103/0973-1482.63567. [DOI] [PubMed] [Google Scholar]
- 23.Hyer DE, Sheybani A, Jacobson GM, et al. The dosimetric impact of heterogeneity corrections in high-dose-rate 192Ir brachytherapy for cervical cancer: investigation of both conventional Point-A and volume-optimized plans. Brachytherapy. 2012;11:515–20. doi: 10.1016/j.brachy.2012.01.011. [DOI] [PubMed] [Google Scholar]
- 24.Uniyal SC, Naithani UC, Sharma SD, et al. Radiochromic film dosimetry of rectal inhomogeneity and applicator attenuation in high dose rate brachytherapy of uterine cervix. J Appl Clin Med Phys. 2012;13:66–75. doi: 10.1120/jacmp.v13i1.3654. [DOI] [PMC free article] [PubMed] [Google Scholar]


