Abstract
Increased HbF levels or F-cell (HbF containing erythrocyte) numbers can ameliorate the disease severity of β-thalassemia major and sickle cell anemia. Recent genome wide association studies reported that single nucleotide polymorphisms (SNPs) in BCL11A gene on chromosome 2p16.1 were correlated with F-cells among healthy northern Europeans, and HbF among Sardinians with β-thalassemias. In this study, we showed that SNPs in BCL11A were associated with F-cell numbers in Chinese with β-thalassemia trait, and with HbF levels in Thais with either β-thalassemia or HbE trait and in African Americans with sickle cell anemia. Taken together, the data suggest that the functional motifs responsible for modulating F-cells and HbF levels reside within a 3 kb region in the second intron of BCL11A.
INTRODUCTION
Sickle cell anemia (SCA) and β-thalassemia major (TM) are among mankind's most common monogenic diseases. In many developing countries, the disease burden is of public health importance. These diseases are now encountered in all parts of the world. Their clinical phenotypes are heterogeneous, varying from relatively mild to severe. Augmented fetal hemoglobin (HbF; α2γ2) level can partially compensate for the lack of normal β-globin chain synthesis in TM, and HbF can inhibit sickle hemoglobin (HbS) polymerization. Therefore, HbF is a major modifier of disease severity in these common and devastating β-hemoglobinopathies [1].
The molecular and cellular regulation of HbF levels and F-cell (erythrocytes containing HbF) numbers is multi-factorial with major genetic components. The C>T SNP (rs7482144) at 158 bp 5' of HBG2 on chromosome 11p15.4, is associated with elevated HbF in TM and SCA [2]. Quantitative trait loci (QTL) for HbF levels have been described on chromosomes 6q23, 8q, and Xp22 [3–5]. Recently, 6 SNPs in BCL11A on chromosome 2p16.1 were reported to be associated with F-cell numbers in a study of 179 unrelated normal subjects from a British twin registry who represented the upper and lower 5th percentile of the cohort for F-cell counts [6]. Subsequently, one other SNP in the same region of BCL11A was found to be associated with HbF levels in Sardinians with β-thalassemia and in African Americans with SCA [7]. In this study, we investigated and found association of HbF/F-cells with the same SNPs in Chinese β-thalassemia heterozygotes, Thai β-thalassemia or HbE heterozygotes, and a different cohort of African Americans with SCA.
METHODS
We examined SNPs in BCL11A in individuals from three different racial populations. They consisted of 113 parents of HbE/β-thalassemia patients in Khon Kaen in northeast Thailand, and 255 African Americans with SCA [8]. Their archived genomic DNA samples underwent PCR-based genome wide amplification (Genomiphi, GE Healthcare, Piscataway, NJ), and genome wide SNP genotyping was carried out using the Illumina Human CNV370-duo beadchip (Illumina, San Diego, CA). This array contains 4 of the 6 SNPs reported by Menzel et al [6], plus 2 other SNPs tagging the same region. In addition, 250 parents of TM patients in Hong Kong in southern China were also studied [9]. Genomic DNA was extracted from peripheral blood leukocytes, and was used for focused genotyping of selected SNPs in BCL11A by ABI TaqMan assays (Applied Bioystems, Foster City, CA). Associations of HbF and F-cells with the SNPs were tested using a linear additive model of the logit transformation of HbF levels, and the log transformation of F-cell numbers. These studies were approved by the IRB of all participating centers.
RESULTS AND DISCUSSION
Table 1 reports the results of these genetic association studies. F-cell counts in logarithmic scale were analyzed in the Chinese subjects; p-values measure the significance of the regression coefficient for the additive model of log (F-cell) versus the three genotypes. HbF (%) in logit scale was analyzed in the Thai and African American subjects, and the p-values measure the significance of the regression coefficient for the additive model of logit (HbF). Most striking is the strong association of SNP rs766432 in all 3 groups (p-values of 8.5E-7 in Chinese, 0.004 in Thai, and 2.1E-10 in African Americans). This same SNP had the strongest significance in the replication panel reported in normal Europeans [6].
Table 1.
Results of SNP association with HbF/F-cells in the three groups of subjects
| SNP | Position1 | Allele Frequency (HapMap) | Chinese (N=250) | Thai (N=113) | African Americans (N=255) | ||||||
|---|---|---|---|---|---|---|---|---|---|---|---|
| Minor/Major Alleles2 | CHB | YRI | CEU | Allele freq. | P-value | Allele freq. | P-value | Allele freq. | P-value | ||
| rs2430273 | 60,518,658 | A/C | 0.48 | 0.72 | 0.57 | 0.55 | 0.11 | 0.47 | 0.540 | 0.66 | 0.636 |
| rs2430813 | 60,525,427 | C/T | 0.42 | 0.75 | 0.53 | 0.55 | 0.16 | 0.47 | 0.746 | 0.66 | 0.611 |
| rs67325183 | 60,620,248 | T/C | 0.07 | 0.71 | 0.76 | 0.03 | 0.48 | 0.00 | # | 0.66 | 2.4E-4 |
| rs6545816 | 60,626,512 | A/C | 0.31 | 0.65 | 0.49 | 0.23 | 0.009 | 0.67 | 0.808 | ||
| rs7664323 | 60,631,621 | C/A | 0.30 | 0.25 | 0.12 | 0.24 | 8.5E-7 | 0.22 | 0.004 | 0.33 | 2.1E-10 |
| rs10184550 | 60,640,945 | A/G | 0.20 | 0.71 | 0.60 | <0.01 | # | 0.67 | 0.001 | ||
Map positions according to NCBI dbSNP build 125.
Minor allele was defined in the Asian Chinese panel used in the HapMap project.
SNPs reported by Menzel et al [6].
# Analyses not done because minor allele frequency was less than 0.01.
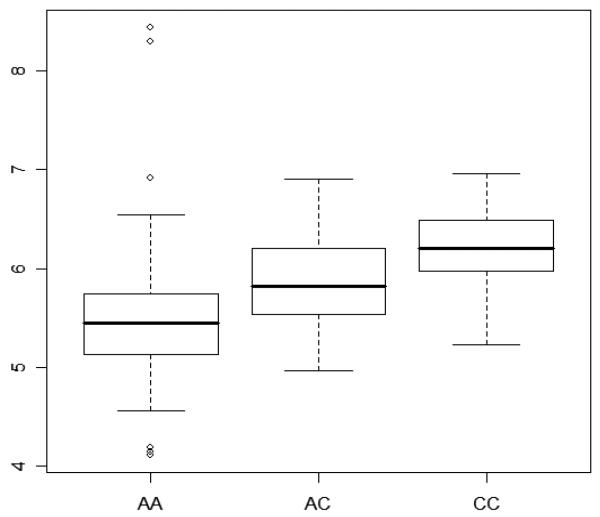
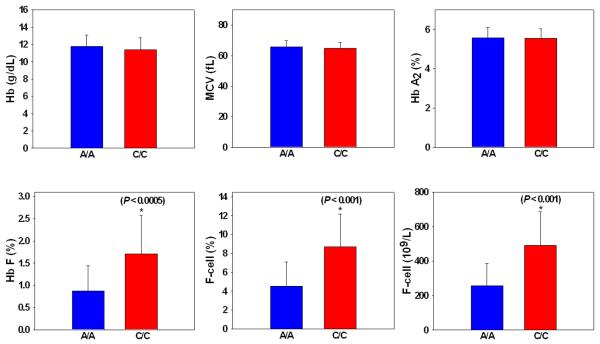
Chinese adult β-thalassemia heterozygotes who were homozygous for the rs766432 major allele, AA, had the lowest median F-cells, when compared to those who were heterozygous for the minor allele, AC. Those who were homozygous for the minor allele, CC, had the highest median F-cells (Figure 1). In these analyses, subjects who were heterozygous for the β-globin gene promoter nt −28 A>G β+-thalassemia mutation and those who were heterozygous for the C>T polymorphism (rs7482144) at the HBG2 promoter nt −158 bp were excluded, because either of these two SNPs by itself is associated with significantly elevated Hb F and F-cells [2, 8]. Figure 2 illustrates that among Chinese β-thalassemia heterozygotes, those who were either AA or CC genotypes in rs766432 had identical hemoglobin level, mean corpuscular volume (MCV), and Hb A2; but those with CC had twice as much HbF (expressed as % of total hemoglobin), F-cells (expressed as % of total red blood cell counts), and F-cells (expressed as 109 F-cells per liter of blood) as those with AA. Similarly, among African Americans with SCA, homozygotes for the C allele had an average of 7% HbF compared with 3% HbF in those who were homozygous for the A allele.
Figure 1.
Box plots showing the complete distribution of F-cells, expressed as 109 F-cells per liter of blood in log scale, on the y-axis among Chinese adult β-thalassemia heterozygotes, excluding those who were heterozygotes for the β-globin gene promoter nt −28 A>G β+-thalassemia mutation and those who were heterozygous for the C>T polymorphism (rs7482144) at the HBG2 promoter nt −158 bp. AA, AC, and CC represent the SNP genotypes at rs766432. Each rectangle shows the data between the 25th and 75th quartiles, and the bar in each rectangle is the median value for the F-cells in log scale.
Figure 2.
Hematological findings of Chinese adult β-thalassemia heterozygotes, with SNP re766432 genotypes of either AA (n=113) or CC (n=12). Subjects who were heterozygotes for the β-globin gene promoter nt −28 A>G β+-thalassemia mutation and those who were heterozygous for the C>T polymorphism (rs7482144) at the HBG2 promoter nt −158 bp were excluded from these anlyses.
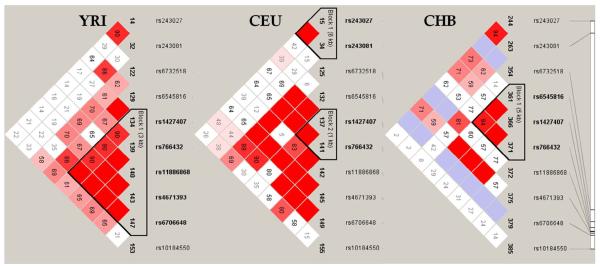
The highly significant association of the SNP rs766432 with HbF/F-cells is further supported by significant association of rs6545816 in the Thai subjects (p-value 0.009). Both SNPs are found to be in LD according to the Chinese HapMap data (Fig.1) [10]. Among African Americans, rs6545816 is not associated with HbF (p-value 0.808). This SNP is not within the same LD block as rs766432 in the African HapMap data (Fig. 1). SNP rs11886868 (position 60,631,897) which was found to be associated with HbF in Sardinians with β-thalassemia and African Americans with SCA [7] is also within the same LD block in both Africans and Europeans. Taken together, our findings, and those from previous studies [6, 7], suggest that possible functional motifs responsible for modulating HbF level or F-cell numbers might reside within or immediately adjacent to a 3 kb region bounded by rs1427407 (position 60,629,694) and rs4671393 (position 60,632,602) in intron 2 of BCL11A.
The frequency of the minor allele, C, in rs766432 associated with augmented HbF/F-cells is 0.30 and 0.25 among Chinese and Africans respectively, but only 0.12 among Europeans according to HapMap data. It might be speculated that the differences in allele frequencies are related to selective advantage due to the prevalence of TM and SCA in the Asian and African populations.
Our analyses did not reproduce the association of rs243027 and rs243081 with F-cell numbers6. In the Thai and African American subjects, the large p-values suggest no evidence for association (Table 1). The lack of association significance in the Chinese subjects (p-values of 0.11 and 0.16 respectively) could conceivably be due to insufficient sample size. These two SNPs, rs243027 and rs243081 are located 3' to exon 5 of BCL11A, 106 kb away from the present association peak at rs766432 in intron 2. They are not in LD with the region tagged by rs766432 in all three populations (Fig. 1). In the normal European study, the p-values for rs243027 and rs243081 were E-8 and E-9, which were genome-wide significant but much less than the p-values of E-20 and E-17 observed for their association peaks at re1427407 and rs766432 respectively6. This observation reinforces our conclusion that the functional variants influencing HbF level or F-cell numbers are much closer to rs766432.
The C>T SNP (rs7482144) at 158 bp 5' of HBG2 on chromosome 11p15.4 accounts for 9% to 13% of the genetic variance of HbF/F-cells in Chinese β-thalassemia heterozygotes and in healthy Europeans.6,9,11 The contribution of the QTL on chromosome 6q23 to the genetic variance of HbF/F-cells was estimated to be 19%, and BCL11A on chromosome 2p16.1 to be 15%6. These findings could be helpful for predicting disease severity as higher HbF levels or increased F-cell numbers can ameliorate disease severity in TM and SCA. The molecular mechanisms underlying the functional properties of these 3 major HbF/F-cell QTLs are presently not understood. BCL11A is highly conserved, and codes for a transcription factor containing three C2H2-type zinc finger motifs, a proline rich region, and an acidic domain. Its mutations are associated with B-cell malignancies [12]. It has also been shown to bind to GC-rich motif and functions as a transcriptional repressor [13]. A search of the cisRED database (http://www.cisred.org) did not reveal any functionally relevant conserved sequence motifs within 4 kb of rs766432 in either direction. Thus, future research will need to decipher how BCL11A acts to modulate HbF/F-cell production before the present findings can be exploited to search for possible pharmacological targets to develop novel and effective therapeutic agents. Furthermore, these data indicate that fully half of the genetic variance of HbF/F-cells is currently unaccounted for and awaits discovery.
Figure 3.
Linkage disequilibrium plots incorporating all 6 SNPs presented in Table 1, plus 3 SNPs which were previously reported [6,7]. These plots were generated using HapMap data with the program HaploView 4.0. Each square reports the value of D', with the standard LD color scheme: white D'<1 and LOD<2; blue D'=1 and LOD<2; shades of pink/red D'<1 and LOD≥2; bright red D'=1 and LOD≥2. YRI, trios from Ibadan, Nigeria; CEU, trios from Utah residents with northern and western European ancestry; CHB, Han Chinese from Beijing, China.
Acknowledgments
Supported in part by NIDDK R01 DK069646 NHLBI R21 HL080463; R01 HL68970; R01 HL87681; U54 HL70819
Footnotes
Publisher's Disclaimer: This is a PDF file of an unedited manuscript that has been accepted for publication. As a service to our customers we are providing this early version of the manuscript. The manuscript will undergo copyediting, typesetting, and review of the resulting proof before it is published in its final citable form. Please note that during the production process errors may be discovered which could affect the content, and all legal disclaimers that apply to the journal pertain.
REFERENCES
- 1.Steinberg MH, Forget BG, Higgs DR, Nagel RL, editors. Disorders of Hemoglobin: Genetics, Pathophysiology, and Clinical Management. Cambridge Univ. Press; Cambridge, UK: 2001. [Google Scholar]
- 2.Gilman JG, Huisman THJ. DNA sequence variation associated with elevated fetal Gγ globin production. Blood. 1985;66:783–787. [PubMed] [Google Scholar]
- 3.Thein SL, Menzel S, Peng X, et al. Intergenic variants of HBS1L-MYB are responsible for a major quantitative trait locus on chromosome 6q23 influencing fetal hemoglobin levels in adults. Proc. Natl. Acad. Sci. USA. 2007;104:11346–11351. doi: 10.1073/pnas.0611393104. [DOI] [PMC free article] [PubMed] [Google Scholar]
- 4.Garner C, Menzel S, Martin C, et al. Interaction between two quantitative trait loci affects fetal haemoglobin expression. Ann. Hum. Genet. 2005;69:707–714. doi: 10.1111/j.1529-8817.2005.00188.x. [DOI] [PubMed] [Google Scholar]
- 5.Dover GJ, Smith KD, Chang YC, et al. Fetal hemoglobin levels in sickle cell disease and normal individuals are partially controlled by an X-linked gene located at Xp22.2. Blood. 1992;80:816–824. [PubMed] [Google Scholar]
- 6.Menzel S, Garner C, Gut I, et al. A QTL influencing F cell production maps to a gene encoding a zinc-finger protein on chromosome 2p15. Nat. Genet. 2007;39:1197–1199. doi: 10.1038/ng2108. [DOI] [PubMed] [Google Scholar]
- 7.Uda M, Galanello R, Sanna S, et al. Genome-wide association study shows BCL11A associated with persistent fetal hemoglobin and amelioration of the phenotype of β-thalassemia. Proc. Natl. Acad. Sci. USA. 2008;105:1620–1625. doi: 10.1073/pnas.0711566105. [DOI] [PMC free article] [PubMed] [Google Scholar]
- 8.Charache S, Terrin ML, Moore RD, et al. Effect of hydroxyurea on the frequency of painful crises in sickle cell anemia. Investigators of the Multicenter Study of Hydroxyurea in Sickle Cell Anemia. N. Engl. J. Med. 1995;332:1317–1322. doi: 10.1056/NEJM199505183322001. [DOI] [PubMed] [Google Scholar]
- 9.Gibney GT, Panhuysen CIM, So JCC, et al. Variation and heritability of Hb F and F-cells among β-thalassemia heterozygotes in Hong Kong. Am. J. Hematol. 2008;83:458–464. doi: 10.1002/ajh.21150. [DOI] [PubMed] [Google Scholar]
- 10.International HapMap Consortium A haplotype map of the human genome. Nature. 2005;437:1299–1320. doi: 10.1038/nature04226. [DOI] [PMC free article] [PubMed] [Google Scholar]
- 11.Garner C, Tatu T, Reittie JE, et al. Genetic influences on F cells and other hematologic variables: a twin heritability study. Blood. 2000;95:342–346. [PubMed] [Google Scholar]
- 12.Liu H, Ippolito GC, Wall JK, et al. Functional studies of BCL11A: characterization of the conserved BCL11A-XL splice variant and its interaction with BCL6 in nuclear paraspeckles of germinal center B cells. Mol. Cancer. 2006;5:18–33. doi: 10.1186/1476-4598-5-18. [DOI] [PMC free article] [PubMed] [Google Scholar]
- 13.Senawong T, Peterson VJ, Leid M. BCL11A-dependent recruitment of SIRT1 to a promoter template in mammalian cells results in histone deacetylation and transcriptional repression. Arch. Biochem. Biophys. 2005;434:316–325. doi: 10.1016/j.abb.2004.10.028. [DOI] [PMC free article] [PubMed] [Google Scholar]


