

Abstract
AIM: To determine the gene expression profile data for the whole liver during development of dimethylni-trosamine (DMN)-induced hepatic fibrosis.
METHODS: Marker genes were identified for different types of hepatic cells, including hepatic stellate cells (HSCs), Kupffer cells (including other inflammatory cells), and hepatocytes, using independent temporal DNA microarray data obtained from isolated hepatic cells.
RESULTS: The cell-type analysis of gene expression gave several key results and led to formation of three hypotheses: (1) changes in the expression of HSC-specific marker genes during fibrosis were similar to gene expression data in in vitro cultured HSCs, suggesting a major role of the self-activating characteristics of HSCs in formation of fibrosis; (2) expression of mast cell-specific marker genes reached a peak during liver fibrosis, suggesting a possible role of mast cells in formation of fibrosis; and (3) abnormal expression of hepatocyte-specific marker genes was found across several metabolic pathways during fibrosis, including sulfur-containing amino acid metabolism, fatty acid metabolism, and drug metabolism, suggesting a mechanistic relationship between these abnormalities and symptoms of liver fibrosis.
CONCLUSION: Analysis of marker genes for specific hepatic cell types can identify the key aspects of fibrogenesis. Sequential activation of inflammatory cells and the self-supporting properties of HSCs play an important role in development of fibrosis.
Keywords: Liver fibrosis, Gene expression, Microarray, Dimethylnitrosamine, Marker genes, Hepatic stellate cell, Kupffer cell, Hepatocytes, Metabolic pathway
INTRODUCTION
The pathological relationship between chronic inflammation and formation of fibrosis has been established in various organs, including the liver, kidney, lung and pancreas. Although liver fibrosis has been studied extensively, the underlying mechanisms remain unclear and drugs to prevent and treat fibrosis are only partially effective. DNA microarray technology offers an approach to this kind of complex problems, and microarray analyses of the whole liver have been reported for liver fibrosis[1,2]. However, these analyses did not address the behavior of individual hepatic cell-types and the interactions of hepatic cells during fibrosis. Therefore, in the current study we identified hepatic cell-specific marker genes that could be used to understand the in vivo behavior of each type of hepatic cells during fibrogenesis.
About 70%-80% of hepatic cells are parenchymal hepatocytes, while the non-parenchymal cells are mainly composed of Kupffer cells, hepatic stellate cells (HSC) and sinusoidal endothelial cells (SECs)[3,4]. Kupffer cells are the resident monocytes in liver, and act in phagocytosis of foreign substances such as microorganisms, as well as management of inflammatory processes. Kupffer cells and infiltrated monocytes and lymphocytes are considered to trigger inflammation in the early phase of hepatitis and then maintain chronic inflammation. HSCs control hepatic and cardiovascular contraction, and produce extracellular matrix (ECM) components and cytokines for repair of organs. HSCs are also believed to have a central role in hepatic fibrosis formation. Hepatocytes fulfill the main functions of the liver, including regulation of nutrition, production of major serum proteins, and elimination of unnecessary materials to maintain homeostasis of the whole body[4].
In the current study, we first examined gene expression profiles of hepatic cells that were isolated at different time points during liver fibrosis. Marker genes specific for different types of hepatic cells were obtained by comparing these profiles and using information from previous studies. DNA microarray data for the whole liver were then interpreted during liver fibrogenesis using the hepatic cell-type specific marker genes. Our results suggest that new pathological properties and intracellular events are associated with each cell type during liver fibrogenesis, and provide candidates for diagnostic markers of liver fibrosis.
MATERIALS AND METHODS
Animals and experimental protocols
Male Sprague-Dawley rats (Charles River Japan, Yokohama, Japan) weighing 160-190 g were housed with unrestricted access to food (CRF-1, Oriental Yeast, Tokyo, Japan) and water in air-conditioned animal quarters with a 12 h light/dark cycle (light between 07:00 and 19:00 h). Hepatic fibrosis was induced by intraperitoneal injection of 0.5% dimethylnitrosamine (DMN; Wako Pure Chemical Industries, Osaka, Japan) at 2 mL/kg of body weight for three consecutive days each week for four weeks. Blood samples were drawn from the inferior vena cava on d 0, 4, 7, 14, 21 and 28, respectively. Liver specimens obtained on these days were dissected and immediately frozen in liquid nitrogen. Fibrosis was confirmed by haematoxylin and eosin (HE) staining of the liver tissue. The hydroxyproline content of liver specimens was determined as previously described by Horie et al[5] . Plasma alanine aminotransferase (ATL) and aspartate aminotransferase (AST) were measured using commercial kits (Fuji Film, Tokyo, Japan), and hyaluronic acid levels were determined using a commercial ELISA kit (Fujirebio, Tokyo, Japan). The animal facilities and protocol were reviewed and approved by the Institutional Animal Care and Use Committee of Ajinomoto Co., Inc.
Preparation of HSCs, inflammatory cells (including Kupffer cells) and hepatocytes
HSCs were isolated from rat liver using the pronase-collagenase digestion method as previously reported[6]. Kupffer cell fraction was prepared with an elutriator, using essentially the same method as previously described[6], and hepatocytes were isolated as previously described[7].
Selection of marker genes for hepatic cells
Hepatic cells (HSCs, Kupffer cell fraction and hepatocytes) were isolated from the liver on d 0, 4, 7, 14, 21 and 28 during liver fibrogenesis. The isolated hepatic cells at each time point were subjected to DNA microarray analysis. If the maximum or minimum expression of a gene in hepatocytes was ten times higher or lower than that of the same gene in HSCs and the Kupffer cell fraction, the up- or down-regulated gene was defined as a hepatocyte-specific marker gene. If the maximum or minimum expression of a gene in HSCs was ten times higher or lower than that of the same gene in hepatocytes and three times higher or lower than the same gene in the Kupffer cell fraction, this gene was defined as a HSC-specific marker gene. Similarly, if the maximum or minimum expression of a gene in the Kupffer cell fraction was ten times higher or lower than that of the same gene in hepatocytes and three times higher or lower than the same gene in HSCs, the gene was defined as an inflammatory cell-specific marker gene. An explanation of the use of the term ‘inflammatory cell’, rather than ‘Kupffer cell’, was given in the Results section. The ratios used to determine cellular specificity were based on previous reports[8,9]: the number of hepatocytes was about ten times higher than that of the inflammatory cell fraction or HSCs, while the number of Kupffer cells was similar to that of HSCs. Use of a high ratio improved the definition of cellular specificity, but also decreased the number of marker genes. However, we found that these ratios were the most appropriate for identification of a set of genes for analysis of liver fibrogenesis.
Microarray analysis
RNAs both from frozen liver tissues and from each isolated cell type were prepared using Isogen reagent (Nippon Gene), and the quality and quantity of each RNA sample were assessed using an Agilent Bioanalyzer 2100 (Agilent Technologies, Inc.). RNA samples were reverse-transcribed with a poly (dT) oligonucleotide attached to a T7 promoter and copied into dsDNA (Invitrogen). In vitro RNA transcription was performed to incorporate biotin-labeled ribonucleotides into the cRNA transcripts using a RNA transcript labeling kit (Enzo Biochem). Some of the RNA (15 g) was utilized for hybridization to a rat genome U34A array (Affymetrix) and a quality assay using test 3 array probe chips was performed according to the manufacturer’s protocol. After hybridization and subsequent washing using the Affymetrix Fluidics Station 400, fluorescence signals amplified with streptavidin phycoerythrin were measured using the Affymetrix scanner, and the results were analyzed using the MicroArray suite software. In the whole liver analysis, two rats and two arrays were used at each time point (d 4, 7, 14, 21 and 28). In the cell-type-specific analysis, one rat which was selected by ALT/AST score and one array were used at each time point (d 4, 7, 14, 21 and 28).
Statistical analysis
Clustering of K-means was performed using the TIGR MeV (MultiExperiment Viewer)[10]. Gene expression profiles in the chronic phase were clustered into 10 patterns using K-means analysis. Clustered genes with a tendency to temporally decrease (clusters 1, 3 and 10) or increase (clusters 7 and 9) were selected as gene markers that had a strong relationship with fibrogenesis.
RESULTS
Time course of gene expression profiles for the whole liver during fibrogenesis
Administration of DMN for three days induced an inflammatory reaction in liver cells simulating the active phase in hepatitis, and the subsequent lack of administration of DMN for four days was used to simulate the remission phase in hepatitis. Repetition of this cycle led to fibrosis in three or four weeks, as shown in Figure 1. AST (GOT) and ALT (GPT) increased on the days of DMN administration and decreased on the days during which DMN was not administered (Figure 1), but both AST and the hyaluronic acid content in serum, a marker of fibrosis[11], gradually increased on days without DMN administration. The inflammatory reaction in periods without DMN administration was weaker than that in periods with DMN-administration, but gradually increased in intensity and response. Based on the behavior shown in Figure 1, gene expression profiles on d 4 (just after a period of DMN administration) were defined as representative of the acute phase response, and those on d 7, 14, 21 and 28 (just before a period of DMN administration) were defined as representative of the chronic phase response.
Figure 1.

Histological and biochemical analyses of fibrogenesis. A-C: Histological staining (HE staining) of control liver sections (A) and sections obtained on d 4 (B) and d 21 (C), respectively, after DMN administration; D: Biochemical analysis of fibrogenesis showing plasma AST levels (IU/L, solid line), plasma hyaluronic acid levels (ng/mL, dashed line), and liver hydroxyproline levels (ng/mL, dotted line). The x-axis shows the days of fibrogenesis, and each value on the graph is shown as the mean ± SE, n = 5.
Marker genes indicating fibrotic activity of HSCs
HSCs were isolated from liver at each time point over the time course of development of DMN-induced fibrosis. Marker genes expressed mainly in HSCs were selected from a DNA microarray analysis, as described in the Materials and Methods, and the selected HSC-specific marker genes are listed in Figure 2. In addition, HSCs isolated from normal rats were cultured in vitro for 7 d and DNA microarray analysis of these cells was performed on d 0, 4, and 7, respectively. Marker genes identified in isolated HSCs in the DMN-induced fibrosis model showed the same behavior in the in vitro culture, supporting the HSC specificity of the selected marker genes. The behavior of HSC-specific marker genes in vivo during fibrogenesis was analyzed using DNA microarray data for the whole liver at each time point during development of DMN-induced fibrosis. These data could indicate the actual behavior of the marker genes in vivo, since the data from isolated HSCs might contain some bias due to isolation stimuli. The behavior of HSC-specific marker genes is shown in Figure 2, and supplemental background data are provided in Figure 3. The genes were separated into 2 groups as shown in Figure 2. Group 1 contained marker genes that were linearly up-regulated during fibrogenesis and in the acute inflammation phase, whereas group 2 contained marker genes that were linearly up-regulated during fibrogenesis but not in the acute inflammation phase. Both groups could be further separated into 2 subgroups. Group 1-1 included marker genes that were linearly up-regulated during fibrogenesis and remained in an up-regulated state on d 28, and group 1-2 included marker genes that were also linearly up-regulated during fibrogenesis but then decreased in expression on d 28. Group 2 was similarly separated into groups 2-1 and 2-2. In summary, two groups of HSC-specific marker genes were identified, one in which the genes responded to inflammatory stimuli and the other in which the genes did not respond to such stimuli. Furthermore, HSC-specific marker genes were found that could identify biological changes in HSCs in the late phase of fibrosis.
Figure 2.

Marker genes for hepatic stellate cells (HSCs). Expression profiles of the whole liver and in vitro cultured isolated HSCs were obtained using a rat genome U34A array (Affymetrix). Gene markers for HSCs are listed. For analysis of HSCs in the whole liver, expression intensities are given for d 0, and expression intensity data for d 4, 7, 14, 21 and 28 are shown as ratios to the d 0 expression data. The classification of group1 (2) corresponds to the presence (absence) of up-regulated peak in the acute inflammation phase. For analysis of in vitro cultured HSCs, expression levels for d 0 are also shown, and data for d 4 and 7 are similarly shown as ratios to the expression level on d 0. Italicized values indicate an “absent” call by the Affymetrix software. Bold text indicates the highest ratio in the chronic phase (d 7, 14, 21 and 28).
Figure 3.

Marker genes in hepatic stellate cells (HSC). Expression profiles of the whole liver, of isolated HSCs during fibrogenesis, and of in vitro cultured isolated HSCs were obtained using a rat Genome U34A Array (Affymetrix). Marker genes for HSCs are listed. Expression intensities are shown for d 0, and expression intensity data for d 4, 7, 14, 21 and 28 are displayed as ratios to the d 0 expression levels for the analysis of whole liver and isolated HSCs. For in vitro cultured HSCs, the d 0 data are similarly shown as expression intensities, and data on d 4 and 7 are shown as ratios to the expression levels on d 0. Italics indicate an “absent” call by the Affymetrix software, and bold text indicates the highest ratio in the chronic phase (d 7, 14, 21 and 28).
Marker genes indicating inflammatory activity in immune cell populations
The Kupffer cell fraction was separated from other hepatic cells at each time point during the course of fibrosis development, and marker genes expressed mainly in the Kupffer cell fraction were selected from the DNA microarray analysis. These marker genes are shown in Figure 4, and supplemental background data are provided in Figure 5. Marker genes in the Kupffer cell fraction indicated the presence of other hematopoietic cells, such as mast cells, lymphocytes, erythrocytes and their progenitors in this fraction, as shown in Figures 4 and 5. Since the source cell population for these marker genes could not be confirmed, a particular hematopoietic cell was postulated to be the source of each marker gene based on previous reports as shown in supplemental Table 1. These data indicated that the method used for isolation of Kupffer cells was not appropriate in fibrotic liver, although it was effective for isolation of normal liver cells. However, despite this drawback, the marker genes could be used to study the behavior of inflammatory cells during fibrogenesis, and these genes were therefore defined as inflammatory cell-specific marker genes. The behavior of the inflammatory cell-specific marker genes in vivo during fibrogenesis was analyzed using DNA microarray data for the whole liver at each time point during DMN-induced fibrogenesis of marker genes, as summarized in Figures 4 and 5.
Figure 4.

Marker genes for hematopoietic cells in the Kupffer cell fraction. Expression profi les of the whole liver and the isolated Kupffer cell fraction during fi brogenesis were obtained using a rat genome U34A array (Affymetrix). Marker genes for hematopoietic cells in the Kupffer cell fraction are listed. Expression intensities are given for d 0, and expression intensity data for d 4, 7,14, 21 and 28 are shown as ratios to the d 0 expression data for analysis of hematopoietic cells in whole liver. The classifi cation of genes into groups 1-4 and corresponds to the maximum change of expression at the different time points on d 7, 14, 21, 28 and 4, respectively. Italicized values indicate an “absent” call by the Affymetrix software. The bold values indicate the highest or lowest ratio in the chronic phase (d 7, 14, 21 and 28). Cell types in the infl ammatory cell fraction are as follows: M: Monocytes and their progenitors; L: Lymphocytes and their progenitors; E: Erythrocytes and their progenitors; P: Platelets and their progenitors; Leu: Other kinds of leukocytes and their progenitors.
Figure 5.

Marker genes in hematopoietic cells in the Kupffer cell fraction. Expression profiles of the whole liver and the isolated Kupffer cell fraction during fibrogenesis were obtained using a rat Genome U34A Array (Affymetrix). Marker genes of hematopoietic cells in the Kupffer cell fraction are listed. Expression intensities are shown for d 0, and the expression intensity data for d 4, 7, 14, 21 and 28 are displayed as ratios to the d 0 expression levels. Italics indicate an “absent” call by the Affymetrix software. Bold values indicate the highest or lowest ratio in the chronic phase (d 7, 14, 21 and 28). The cell types in the infl ammatory cell fraction are as follows: M: Monocytes and their progenitors; L: Lymphocytes and their progenitors; E: Erythrocytes and their progenitors; P: Platelets and their progenitors; Leu: Other kinds of leukocytes and their progenitors.
Table 1.
References used in the definition of types of hematopoietic cells in the Kupffer cell fraction
| No. | Reference |
| 1 | Tordjmann T, Soulie A, Guettier C, Schmidt M, Berthou C, Beaugrand M, Sasportes M. Perforin and granzyme B lytic protein expression during chronic viral and autoimmune hepatitis. Liver 1998; 18: 391-397 |
| 2 | Lautenschlager I. Characteristics of the strongly Ia-positive cells in rat liver. Scand J Immunol 1984; 20: 333-338 |
| 3 | Boisclair J, Dore M, Beauchamp G, Chouinard L, Girard C. Characterization of the inflammatory infiltrate in canine chronic hepatitis. Vet Pathol 2001; 38: 628-635 |
| 4 | Ahlenstiel G, Woitas RP, Rockstroh J, Spengler U. CC-chemokine receptor 5 (CCR5) in hepatitis C--at the crossroads of the antiviral immune response? J Antimicrob Chemother 2004; 53: 895-898 |
| 5 | Eis V, Luckow B, Vielhauer V, Siveke JT, Linde Y, Segerer S, De Lema GP, Cohen CD, Kretzler M, Mack M, Horuk R, Murphy PM, Gao JL, Hudkins KL, Alpers CE, Grone HJ, Schlondorff D, Anders HJ. Chemokine receptor CCR1 but not CCR5 mediates leukocyte recruitment and subsequent renal fibrosis after unilateral ureteral obstruction. J Am Soc Nephrol 2004; 15: 337-347 |
| 6 | McCabe MJ Jr, Dias JA, Lawrence DA. Lead influences translational or posttranslational regulation of Ia expression and increases invariant chain expression in mouse B cells. J Biochem Toxicol 1991; 6: 269-276 |
| 7 | Wilson KM, Labeta MO, Pawelec G, Fernandez N. Cell-surface expression of human histocompatibility leucocyte antigen (HLA) class II-associated invariant chain (CD74) does not always correlate with cell-surface expression of HLA class II molecules. Immunology 1993; 79: 331-335 |
| 8 | Kiley SC, Parker PJ. Differential localization of protein kinase C isozymes in U937 cells: evidence for distinct isozyme functions during monocyte differentiation. J Cell Sci 1995; 108 (Pt 3): 1003-1016 |
| 9 | Allen JN, Liao Z, Moore SA, Wewers MD. Changes in mononuclear phagocyte microtubules after endotoxin stimulation. II. Changes in microtubule composition. Am J Respir Cell Mol Biol 1997; 16: 127-132 |
| 10 | Devergne O, Peuchmaur M, Humbert M, Navratil E, Leger-Ravet MB, Crevon MC, Petit MA, Galanaud P, Emilie D. In vivo expression of IL-1 beta and IL-6 genes during viral infections in human. Eur Cytokine Netw 1991; 2: 183-194 |
| 11 | Thornton AJ, Ham J, Kunkel SL. Kupffer cell-derived cytokines induce the synthesis of a leukocyte chemotactic peptide, interleukin-8, in human hepatoma and primary hepatocyte cultures. Hepatology 1991; 14: 1112-1122 |
| 12 | Manthey CL, Kossmann T, Allen JB, Corcoran ML, Brandes ME, Wahl SM. Role of Kupffer cells in developing streptococcal cell wall granulomas. Streptococcal cell wall induction of inflammatory cytokines and mediators. Am J Pathol 1992; 140: 1205-1214 |
| 13 | Zhu XL, Zellweger R, Zhu XH, Ayala A, Chaudry IH. Cytokine gene expression in splenic macrophages and Kupffer cells following haemorrhage. Cytokine 1995; 7: 8-14 |
| 14 | Loike JD, Kaback E, Silverstein SC, Steinberg TH. Lactate transport in macrophages. J Immunol 1993; 150: 1951-1958 |
| 15 | Daberkow RL, White BR, Cederberg RA, Griffin JB, Zempleni J. Monocarboxylate transporter 1 mediates biotin uptake in human peripheral blood mononuclear cells. J Nutr 2003; 133: 2703-2706 |
| 16 | Merezhinskaya N, Ogunwuyi SA, Mullick FG, Fishbein WN. Presence and localization of three lactic acid transporters (MCT1, -2, and -4) in separated human granulocytes, lymphocytes, and monocytes. J Histochem Cytochem 2004; 52: 1483-1493 |
| 17 | Marra F, Valente AJ, Pinzani M, Abboud HE. Cultured human liver fat-storing cells produce monocyte chemotactic protein-1. Regulation by proinflammatory cytokines. J Clin Invest 1993; 92: 1674-1680 |
| 18 | Guc D, Gulati P, Lemercier C, Lappin D, Birnie GD, Whaley K. Expression of the components and regulatory proteins of the alternative complement pathway and the membrane attack complex in normal and diseased synovium. Rheumatol Int 1993; 13: 139-146 |
| 19 | Schwaeble W, Huemer HP, Most J, Dierich MP, Strobel M, Claus C, Reid KB, Ziegler-Heitbrock HW. Expression of properdin in human monocytes. Eur J Biochem 1994; 219: 759-764 |
| 20 | Yamanouchi S, Kuwahara K, Sakata A, Ezaki T, Matsuoka S, Miyazaki J, Hirose S, Tamura T, Nariuchi H, Sakaguchi N. A T cell activation antigen, Ly6C, induced on CD4+ Th1 cells mediates an inhibitory signal for secretion of IL-2 and proliferation in peripheral immune responses. Eur J Immunol 1998; 28: 696-707 |
| 21 | Manoussaka MS, Smith RJ, Conlin V, Toomey JA, Brooks CG. Fetal mouse NK cell clones are deficient in Ly49 expression, share a common broad lytic specificity, and undergo continuous and extensive diversification in vitro. J Immunol 1998; 160: 2197-2206 |
| 22 | Wrammert J, Kallberg E, Agace WW, Leanderson T. Ly6C expression differentiates plasma cells from other B cell subsets in mice. Eur J Immunol 2002; 32: 97-103 |
| 23 | Katz P, Whalen G, Kehrl JH. Differential expression of a novel protein kinase in human B lymphocytes. Preferential localization in the germinal center. J Biol Chem 1994; 269: 16802-16809 |
| 24 | Valent P, Ashman LK, Hinterberger W, Eckersberger F, Majdic O, Lechner K, Bettelheim P. Mast cell typing: demonstration of a distinct hematopoietic cell type and evidence for immunophenotypic relationship to mononuclear phagocytes. Blood 1989; 73: 1778-1785 |
| 25 | Titos E, Claria J, Planaguma A, Lopez-Parra M, Villamor N, Parrizas M, Carrio A, Miquel R, Jimenez W, Arroyo V, Rivera F, Rodes J. Inhibition of 5-lipoxygenase induces cell growth arrest and apoptosis in rat Kupffer cells: implications for liver fibrosis. FASEB J 2003; 17: 1745-1747 |
| 26 | Titos E, Claria J, Planaguma A, Lopez-Parra M, Gonzalez-Periz A, Gaya J, Miquel R, Arroyo V, Rodes J. Inhibition of 5-lipoxygenase-activating protein abrogates experimental liver injury: role of Kupffer cells. J Leukoc Biol 2005; 78: 871-878 |
| 27 | Sawano A, Iwai S, Sakurai Y, Ito M, Shitara K, Nakahata T, Shibuya M. Flt-1, vascular endothelial growth factor receptor 1, is a novel cell surface marker for the lineage of monocyte-macrophages in humans. Blood 2001; 97: 785-791 |
| 28 | Coppola S, Narciso L, Feccia T, Bonci D, Calabro L, Morsilli O, Gabbianelli M, De Maria R, Testa U, Peschle C. Enforced expression of KDR receptor promotes proliferation, survival and megakaryocytic differentiation of TF1 progenitor cell line. Cell Death Differ 2006; 13: 61-74 |
| 29 | Fernandez Pujol B, Lucibello FC, Zuzarte M, Lutjens P, Muller R, Havemann K. Dendritic cells derived from peripheral monocytes express endothelial markers and in the presence of angiogenic growth factors differentiate into endothelial-like cells. Eur J Cell Biol 2001; 80: 99-110 |
| 30 | Bowling WM, Flye MW, Qiu YY, Callery MP. Inhibition of phosphatidylinositol-3'-kinase prevents induction of endotoxin tolerance in vitro. J Surg Res 1996; 63: 287-292 |
| 31 | Capodici C, Hanft S, Feoktistov M, Pillinger MH. Phosphatidylinositol 3-kinase mediates chemoattractant-stimulated, CD11b/CD18-dependent cell-cell adhesion of human neutrophils: evidence for an ERK-independent pathway. J Immunol 1998; 160: 1901-1909 |
| 32 | Bracke M, Nijhuis E, Lammers JW, Coffer PJ, Koenderman L. A critical role for PI 3-kinase in cytokine-induced Fcalpha-receptor activation. Blood 2000; 95: 2037-2043 |
| 33 | Zweifel M, Breu K, Matozan K, Renner E, Welle M, Schaffner T, Clavien PA. Restoration of hepatic mast cells and expression of a different mast cell protease phenotype in regenerating rat liver after 70%-hepatectomy. Immunol Cell Biol 2005; 83: 587-595 |
| 34 | Pemberton AD, Brown JK, Wright SH, Knight PA, Miller HR. The proteome of mouse mucosal mast cell homologues: the role of transforming growth factor beta1. Proteomics 2006; 6: 623-631 |
| 35 | Schwartz LB. Analysis of MC(T) and MC(TC) mast cells in tissue. Methods Mol Biol 2006; 315: 53-62 |
| 36 | Henningsson F, Yamamoto K, Saftig P, Reinheckel T, Peters C, Knight SD, Pejler G. A role for cathepsin E in the processing of mast-cell carboxypeptidase A. J Cell Sci 2005; 118: 2035-2042 |
| 37 | Chen ZQ, He SH. Cloning and expression of human colon mast cell carboxypeptidase. World J Gastroenterol 2004; 10: 342-347 |
| 38 | Lagasse E, Clerc RG. Cloning and expression of two human genes encoding calcium-binding proteins that are regulated during myeloid differentiation. Mol Cell Biol 1988; 8: 2402-2410 |
| 39 | Bhardwaj RS, Zotz C, Zwadlo-Klarwasser G, Roth J, Goebeler M, Mahnke K, Falk M, Meinardus-Hager G, Sorg C. The calcium-binding proteins MRP8 and MRP14 form a membrane-associated heterodimer in a subset of monocytes/macrophages present in acute but absent in chronic inflammatory lesions. Eur J Immunol 1992; 22: 1891-1897 |
| 40 | Ryckman C, Vandal K, Rouleau P, Talbot M, Tessier PA. Proinflammatory activities of S100: proteins S100A8, S100A9, and S100A8/A9 induce neutrophil chemotaxis and adhesion. J Immunol 2003; 170: 3233-3242 |
| 41 | Yoshimoto T, Suzuki H, Yamamoto S, Takai T, Yokoyama C, Tanabe T. Cloning and expression of arachidonate 12-lipoxygenase cDNA from porcine leukocytes. Adv Prostaglandin Thromboxane Leukot Res 1991; 21A: 29-32 |
| 42 | Gu JL, Natarajan R, Ben-Ezra J, Valente G, Scott S, Yoshimoto T, Yamamoto S, Rossi JJ, Nadler JL. Evidence that a leukocyte type of 12-lipoxygenase is expressed and regulated by angiotensin II in human adrenal glomerulosa cells. Endocrinology 1994; 134: 70-77 |
| 43 | Nakamura M, Ueda N, Kishimoto K, Yoshimoto T, Yamamoto S, Ishimura K. Immunocytochemical localization of platelet-type arachidonate 12-lipoxygenase in mouse blood cells. J Histochem Cytochem 1995; 43: 237-244 |
| 44 | Kaminski WE, Jendraschak E, Baumann K, Kiefl R, Fischer S, Marcus AJ, Broekman MJ, von Schacky C. Human mononuclear cells express 12-LX: coordinated mRNA regulation with 5-LX and FLAP genes. Blood 1996; 87: 331-340 |
| 45 | Takenaga K, Nakamura Y, Sakiyama S. Expression of a calcium binding protein pEL98 (mts1) during differentiation of human promyelocytic leukemia HL-60 cells. Biochem Biophys Res Commun 1994; 202: 94-101 |
| 46 | Yancopoulos GD, Oltz EM, Rathbun G, Berman JE, Smith RK, Lansford RD, Rothman P, Okada A, Lee G, Morrow M. Isolation of coordinately regulated genes that are expressed in discrete stages of B-cell development. Proc Natl Acad Sci USA 1990; 87: 5759-5763 |
| 47 | Quelo I, Jurdic P. Differential regulation of the carbonic anhydrase II gene expression by hormonal nuclear receptors in monocytic cells: identification of the retinoic acid response element. Biochem Biophys Res Commun 2000; 271: 481-491 |
| 48 | Baron WF, Pan CQ, Spencer SA, Ryan AM, Lazarus RA, Baker KP. Cloning and characterization of an actin-resistant DNase I-like endonuclease secreted by macrophages. Gene 1998; 215: 291-301 |
| 49 | Kitabatake Y, Kawamura S, Yamashita M, Okuyama K, Takayanagi M, Ohno I. The expression of mRNA for calcitonin gene-related peptide receptors in a mucosal type mast cell line, RBL-2H3. Biol Pharm Bull 2004; 27: 896-898 |
| 50 | Makino Y, Nakamura H, Ikeda E, Ohnuma K, Yamauchi K, Yabe Y, Poellinger L, Okada Y, Morimoto C, Tanaka H. Hypoxia-inducible factor regulates survival of antigen receptor-driven T cells. J Immunol 2003; 171: 6534-6540 |
| 51 | Frank M. MAL, a proteolipid in glycosphingolipid enriched domains: functional implications in myelin and beyond. Prog Neurobiol 2000; 60: 531-544 |
The reference numbers correspond to the numbers in Figure 5 in the supplementary data.
The acute phase response was followed by an immunological response, based on the increase in expression of Kupffer cell (or macrophage) markers such as Lyz, Gzmb, and Il1b, as well as surface markers of T cells, such as T-cell receptor, Il2rb, Cd8, Cd76, and Cd45. The up-regulated expression of these genes seemed to indicate activation of Kupffer cells and T lymphocytes, as well as activation of the interaction between these cells, around d 7. Temporary up-regulation of mast cell markers such as chemokines and mast cell proteases indicated the invasion and/or activation of mast cells around d 14, which is of interest since mast cells are known not only to cause acute inflammation, but also to have a role in the induction of chronic inflammation[12-14]. However, whether activation of mast cells is essential for liver fibrosis is unknown. Peak expression of B cell markers such as immunoglobulin occurred on d 21 or d 28, and therefore activation or invasion of B cells seemed to reach its peak in the late phase. Overall, these results showed that inflammatory cell-specific marker genes could be used to monitor the transition of active inflammatory cell populations in fibrosis, and this sequential activation or invasion of inflammatory cells might be related to the stage of fibrotic progression.
Marker genes indicating damage to hepatocytes
Hepatocytes were separated from other hepatic cells at each time point during the course of DMN-induced fibrogenesis, and marker genes expressed mainly in hepatocytes were selected by DNA microarray analysis. The behavior of hepatocyte-specific marker genes in vivo during fibrogenesis was analyzed using DNA microarray data for the whole liver at each time point during fibrosis development. Marker genes were categorized based on their functions, as shown in Figure 6. Many abnormally expressed genes were identified and temporal analysis revealed groups of genes showing consistent variation in expression. Gene expression profiles in the chronic phase (d 7, 14, 21 and 28) were clustered into 10 patterns using K-means analysis. Clustered genes with a tendency to temporally decrease (clusters 1, 3 and 10) or increase (clusters 7 and 9) were selected, and then genes were further selected based on a strong correlation coefficient (≥ 0.7 or ≤ -0.7) with fibrosis stage (that is, d 7, 14, 21 and 28). The time courses of expression ratios are shown in Figure 7 as supplemental data. The 41 down-regulated and 19 up-regulated genes that were finally selected are shown in Table 2. These genes appeared to have a strong relationship with progression of fibrosis, and might also share common regulatory expression mechanisms.
Figure 6.

Marker genes for hepatocytes. Expression profiles of whole liver or isolated hepatocytes during fibrogenesis were obtained using a rat Genome U34A Array (Affymetrix). Marker genes for hepatocytes, which are the main contributors to the expression profile of the whole liver, are listed. Expression intensities are given for d 0, and expression intensity data for d 4, 7, 14, 21 and 28 are displayed as ratios to the d 0 expression data. Italics indicate an “absent” call by the Affymetrix software. Genes with the highest or lowest ratio in the chronic phase are shown in bold text.
Figure 7.
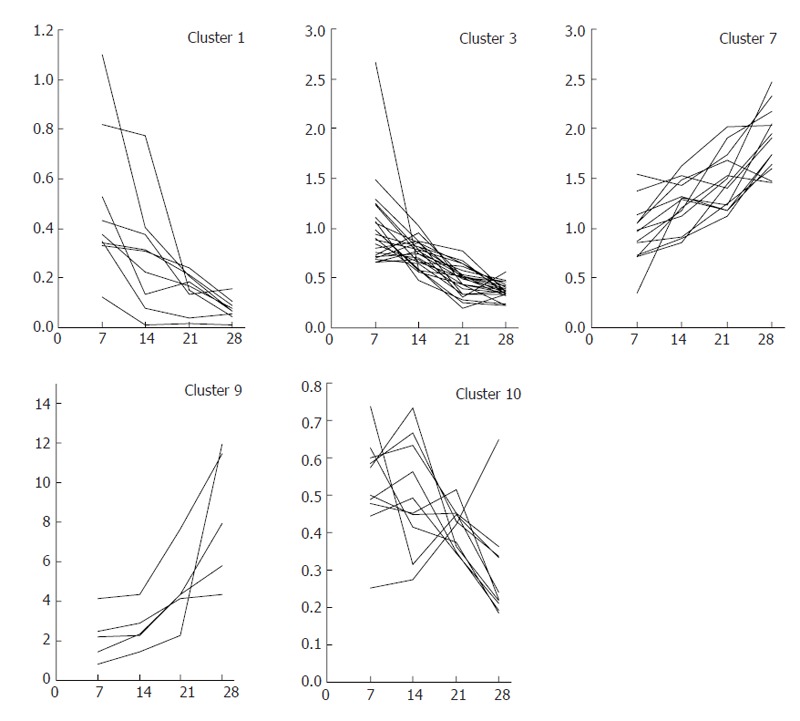
Cluster of genes that increased or decreased in expression with progression of fibrogenesis. Gene expression profiles in the chronic phase (d 7, 14, 21 and 28) were clustered into 10 patterns using K-means analysis. Clustered genes with a tendency to temporally decrease (clusters 1, 3 and 10) or increase (clusters 7 and 9) were selected as gene markers that had a strong relationship with fibrogenesis.
Table 2.
Marker genes for hepatocytes that showed a strong relationship with fibrogenesis
| Functional category | Cluster No. | Direction of change | Annotation | Symbol | Common |
| Amino acid metabolism | 7 | Increase | Glutamate oxaloacetate transaminase 1 | Got1 | J04171 |
| 7 | Increase | Glutamic-pyruvate transaminase (alanine aminotransferase) | Gpt | D10354 | |
| 9 | Increase | Glutathione-S-transferase, alpha type2 | Gsta2 | AA945082 | |
| 3 | Decrease | Cytosolic cysteine dioxygenase 1 | Cdo1 | AA942685 | |
| 10 | Decrease | Cysteine-sulfinate decarboxylase | Csad | M64755 | |
| Cholesterol synthesis | 3 | Decrease | Nuclear receptor subfamily 0, group B, member 2 | Nr0b2 | D86745 |
| Steroid hormone synthesis | 7 | Increase | Hydroxysteroid (17-beta) dehydrogenase 9 | Hsd17b9 | U89280 |
| 7 | Increase | (20-alpha-hydroxysteroid dehydrogenase) | --- | AA866264 | |
| 1 | Decrease | Hydroxysteroid (17-beta) dehydrogenase 2 | Hsd17b2 | X91234 | |
| 3 | Decrease | Sulfotransferase, estrogen preferring | Ste | S76489 | |
| Lipid biosynthesis, metabolism, fatty acid & lipid transport | 9 | Increase | Carboxylesterase 2 (intestine, liver) (drug metabolism) | Ces2 | AB010635 |
| 1 | Decease | 2-hydroxyphytanoyl-CoA lyase(peroxisomal) alpha-oxidation | Hpcl2 | AA893239 | |
| 3 | Decease | Carboxylesterase 3 | Ces3 | L46791 | |
| 3 | Decease | Hydroxyacid oxidase 2 (long chain)(peroxisomal)( alpha-oxidation) | Hao2 | AI232087 | |
| 3 | Decease | Fatty acid binding protein 7, brain (cytosolic) | Fabp7 | U02096 | |
| 10 | Decease | Alpha-methylacyl-CoA racemase Peroxisomal) | Amacr | U89905 | |
| Retinoid synthesis & metabolism | 3 | Decease | Retinol dehydrogenase type II (RODH II) | RoDHII | U33500 |
| 10 | Decease | Retinol dehydrogenase type III | Rdh3 | U18762 | |
| Dlucolysis & gluconeogenesis | 7 | Increase | Glucokinase | Gck | X53588 |
| 3 | Decrease | Phosphoenolpyruvate carboxykinase 1(PEPCK1) (cytosolic) | Pck1 | K03243 | |
| 3 | Decrease | Pyruvate carboxylase | Pc | U32314 | |
| 3 | Decrease | Solute carrier family 37 (glycerol-6-phosphate transporter), member 4 | Slc37a4 | AF080468 | |
| 3 | Decrease | Ribonuclease, RNase A family 4 | Rnase4 | AF041066 | |
| 3 | Decrease | Ectonucleotide pyrophosphatase/phosphodiesterase 2(lysophospholipaseD) | Enpp2 | D28560 | |
| Drug-metabolism | 7 | Increase | Cytochrome P450, family 3, subfamily a, polypeptide 13 | Cyp3a13 | U46118 |
| 9 | Increase | Aldehyde dehydrogenase family 1, member A1 | Aldh1a1 | AF001898 | |
| 1 | Decrease | Cytochrome P450, family 1, subfamily a, polypeptide 2 | Cyp1a2 | E01184 | |
| 1 | Decrease | Cytochrome P450, subfamily IIC (mephenytoin 4-hydroxylase) | Cyp2c | X79081 | |
| 1 | Decrease | Flavin containing monooxygenase 1 | Fmo1 | M84719 | |
| 3 | Decrease | Cytochrome P450, family 17, subfamily a, polypeptide 1 | Cyp17a1 | M21208 | |
| 3 | Decrease | Cytochrome P450, family 3, subfamily a, polypeptide 11 | Cyp3a11 | M13646 | |
| 3 | Decrease | Alcohol dehydrogenase 4 (class II), pi polypeptide | Adh4 | X90710 | |
| 3 | Decrease | 3-hydroxybutyrate dehydrogenase (heart, mitochondrial) | Bdh | AA817846 | |
| 3 | Decrease | Camello-like 1 N-acetyltransferase 8, NAT8) | Cml1 | AA892382 | |
| 3 | Decrease | (hydroxysteroid sulfotransferase ) | --- | M31363 | |
| 3 | Decrease | (hydroxysteroid sulfotransferase subunit) | --- | AA818122 | |
| Growth factors & their receptors | 7 | Increase | Lipopolysaccharide binding protein | Lbp | L32132 |
| 9 | Decrease | Insulin-like growth factor binding protein 2 | Igfbp2 | J04486 | |
| 3 | Decrease | Activin beta E | Inhbe | AF089825 | |
| 10 | Decrease | Growth hormone receptor | Ghr | S49003 | |
| 10 | Decrease | Insulin-like growth factor binding protein 1 | Igfbp1 | M58634 | |
| 10 | Decrease | Deiodinase, iodothyronine, type I | Dio1 | X57999 | |
| Hepatic secretory proteins | 7 | Increase | Alpha-fetoprotein | Afp | X02361 |
| 1 | Decrease | Alpha-2u globulin PGCL4 /// alpha-2u globulin PGCL2 /// alpha-2u-globulin (L type)/// alpha-2u globulin PGCL1 /// alpha-2u globulin PGCL3 | Obp3 /// LOC298109 /// LOC298116 /// LOC259246 /// LOC259244 | M27434 | |
| 1 | Decrease | Alpha-2u globulin PGCL4 (Ppp2r2a protein phosphatase 2 (formerly 2A), regulatory subunit B (PR 52), alpha isoform) | Obp3 | J00738 | |
| 10 | Decrease | Metallothionein | Mt1a | AI102562 | |
| Protease & protease inhibitor | 9 | Increase | Lipocalin 2 | Lcn2 | AA946503 |
| 1 | Decrease | Elastase 1, pancreatic | Ela1 | L00117 | |
| 10 | Decrease | Esterase 2 (liver carboxylesterase) | Es2 | M20629 | |
| 3 | Decrease | Serine protease inhibitor | Spin2a | D00752 | |
| Cell surface proteins & structural proteins | 7 | Increase | Keratin complex 2, basic, gene 8 (cytokeratin-8) | Krt2-8 | S76054 |
| 7 | Increase | Similar to cytokeratin(keratin complex 1, acidic, gene 18) | (Krt1-18) | AI072634 | |
| Signal transduction | 3 | Decrease | Regucalcin | Rgn | D31662 |
| Transporters | 7 | Increase | solute carrier family 17 (sodium phosphate), member 1 | Slc17a1 | U28504 |
| 7 | Increase | Aquaporin 7 | Aqp7 | AB000507 | |
| 9 | Increase | ATP-binding cassette, sub-family B (MDR/TAP), member 1 | Abcb1 | M81855 | |
| 3 | Decrease | Solute carrier family 10 (sodium/bile acid cotransporter family), member 1 | Slc10a1 | M77479 | |
| Protein related vitamins | 10 | Decrease | L-gulono-gamma-lactone oxidase | Gulo | D14564 |
| Others | 7 | Increase | Rabphilin 3A-like (without C2 domains) | Rph3al | AF022774 |
| 1 | Decrease | Carbonic anhydrase 3 | Ca3 | AF037072 |
Gene expression profiles in the chronic phase (d 7, 14, 21 and 28) were clustered into 10 patterns using K-means analysis. Clustered genes that showed a tendency to temporally decrease (clusters 1, 3 and 10) or increase (clusters 7 and 9) were selected, as shown in Table 1 in the supplemental data. Among these genes, those showing a strong relation with fibrogenesis were further selected based on a t-test statistical analysis of the rate of change in expression intensity and the number of days of fibrosis. Hepatocyte-specific gene markers showing a strong relation with fibrogenesis are listed.
Down-regulation of the expression of Cdo1 and Csad showed a strong relationship with fibrotic stage, while expression of Gsta2 was simultaneously up-regulated. Down-regulation of other metabolic enzymes in sulfur-containing metabolic pathways is also shown in Figure 6. These data suggested a broad range of abnormalities in sulfur-containing amino acid metabolic pathways in fibrosis. Regarding other genes, Hao2 and Hpcl2 had a role in fatty acid oxidation in peroxisome, while Amacr was associated with beta-oxidation of pristanoyl-CoA and C27-bile acyl-CoAs. The down-regulation of these genes and other metabolic enzymes related to fatty acid oxidation (Figure 6) suggested abnormalities in the fatty acid oxidation process in fibrosis. The expression of Amacr might be related to that of the nuclear receptor subfamily 0, group B, member 2 (Nr0b2), and changes in NrOb2 expression may affect one of the key molecules in cholesterol biosynthesis. Up-regulation of Gk and down-regulation of Pepck1, PC and Slc37a4 suggested abnormalities in gluconeogenesis, glycogen storage and glycolysis, while down-regulation of Ste and Hsd17b2 suggested an abnormality of estrogen metabolism in the liver. Decreased expression of many Cyp drug metabolism enzymes was also found in progression of fibrosis, and abnormalities in hormonal signaling were suggested by the down-regulation of Inhbe, Ghr and Dio1. These results showed that identification of hepatocyte-specific marker genes could allow analysis of functional changes in fibrosis, and all the identified abnormalities might have major effects on hepatic function.
DISCUSSION
Marker genes for HSCs
Markers of HSCs such as Acta 2, Cryab, Spp1, Prnp, and Pai-1 were strongly up-regulated on d 4, and then quickly decreased in expression following a gradual up-regulation. On the other hand, other HSC markers such as Gpc3, Lox, and Mgp did not show marked up-regulation on d 4, but their expression level increased linearly during fibrogenesis. Therefore, HSCs may be associated with events in two different phases, such as repair in the acute phase response and fibrosis in the chronic phase response. These two groups of HSC marker genes may also be differentially regulated. Marker genes in one group may be expressed both in undifferentiated and in differentiated HSCs, while marker genes in the other group may be expressed mainly in differentiated HSCs. The functional changes associated with differentiation of HSCs during fibrosis are not clear. Schnabel et al[15] have temporally divided the activation process of HSCs into an initiation phase and a perpetuation phase, and HSCs in the initiation phase may play a role in wound healing[16,17] and are then eliminated by apoptosis[18,19], although some HSCs in the initiation phase differentiate into cells in the perpetuation phase. The two kinds of marker genes found in our work may be associated with the two phases.
In the present study, gene expression in HSCs in vivo was mostly similar to that found in vitro, suggesting that HSCs can be activated and produce ECM with few factors contributed by other cell types. Since HSCs also produce auto-stimulating factors such as TGF-beta, chemokines, PDGF, and IGF-1, our results strongly suggest that HSCs have self-supporting properties and few exogenous factors are required for their activation and differentiation. Even if inflammation induced by virus activation stimulates long-term or weak hepatitis, HSCs may be able to autonomously activate and promote fibrosis, and this property of HSCs may be central to promotion of fibrogenesis. Sancho-Bru et al[20] have recently reported that a culture model of HSCs could not exactly match the activated phenotype found in DNA microarray analysis of isolated HSCs from cirrhotic human livers, because in culture marker genes for HSCs in the perpetuation phase are predominantly expressed, relative to those in the initiation phase. However, isolation of HSCs may also alter the expression of some genes, especially the expression of genes associated with inflammation, as shown in Figures 2 and 4. Therefore, compared to studies of isolated HSCs, our approach reveals the actual behavior of HSCs in vivo during fibrosis.
Gpc3 has been recently proposed as a serum and histochemical marker for hepatocellular carcinoma[21,22], since it is only weakly expressed in hepatocytes in normal and cirrhotic livers. However, in our study, Gpc3 was expressed in isolated HSCs during fibrogenesis, but weakly in cultured HSCs, suggesting that HSCs require extracellular factors for expression of Gpc3 during fibrogenesis, or that Gpc3-expressing cells with abnormal characteristics may contaminate the HSC fraction. The cell type showing expression of Gpc3 requires further study.
Marker genes for inflammatory cells
In the present study, gene expression in the inflammatory cell-fraction indicated the presence of several kinds of hematopoietic cells in this fraction, leading to some uncertainty in the data from the rat fibrosis model. However, the behavior of mast cells is of note, since temporary up-regulation of mast cell markers such as chemokines and mast cell proteases indicated invasion and/or activation of mast cells around d 14. Invasion of a marked number of mast cells could not be detected with HE staining, and therefore the number of invading mast cells must be small. Mast cells not only cause acute inflammation, but also have a role in induction of chronic inflammation[12,14], and involvement of mast cells in hepatic fibrosis has been reported[12,23-25]. RANTES, a chemokine that is produced by T cells and stimulates mast cells[26,27], showed its peak expression on d 14, as shown in Figure 4. RANTES has been suggested to be a mediator of progression from acute to chronic inflammation in colitis[28], and further studies are of importance to determine whether RANTES activation of mast cells is essential for liver fibrosis.
Marker genes for hepatocytes
DNA microarray analysis of whole liver in experimental animal models of hepatic fibrosis has been reported[1,2], and characteristic behavior of hepatocyte-specific marker genes over the time course of fibrogenesis was found in this study. DNA microarray data for the whole liver are similar to those for hepatocytes, since 70% of hepatic cells are hepatocytes[8,9], and data on d 28 are generally similar to those in previous reports. However, our temporal data indicate progressive abnormal gene expression in fibrogenesis, including in the early phase of fibrogenesis. Furthermore, since our data did not contain genes expressed in other hepatic cells, the hepatocyte-specific gene set allowed examination of the molecular network in hepatocytes.
Clustered abnormalities were found in genes associated with metabolism of sulfur-containing amino acids in this study. Similar abnormalities in metabolism of sulfur-containing amino acids have been reported[29,30], and an increase in methionine concentration in blood has been found in cirrhosis[31,32], which may be related to changes in gene expression in sulfur-containing amino acid metabolism. Furthermore, S-adenosylmethionine has an important role in methylation, including the methylation of DNA. Since abnormalities likely induce tumorigenesis due to DNA instability, it is of note that long-term suppression of S-adenosylmethionine synthetase increases the risk of tumorigenesis[33]. Glycine methyltransferase also has been implicated in DNA instability[34,35], and long-term suppression of this enzyme also has an associated risk of tumorigenesis during liver fibrosis. A metabolite of methionine, homocysteine, is also suspected as a risk factor for cardiovascular disease[36,37], and an increase in the concentration of homocysteine has been found in cirrhosis[38]. Abnormal homocysteine metabolism may also have an important role in the pathogenesis of liver failure, including fatty liver, activation of HSCs (i.e., enhancement of fibrosis), cardiovascular disease, and HCC. Finally, biosynthesis of taurine from cysteine may be suppressed, possibly leading to painful muscle cramps, which are a complication of cirrhosis caused by taurine deficiency[39]. Therefore, in summary, it is apparent that abnormalities in sulfur-containing amino acid metabolism can result in development of serious diseases.
Down-regulation of enzymes related to beta-oxidation in TAA-induced experimental fibrosis has been reported[29]. Studies of the Aox knockout mouse[40] suggest that metabolites of fatty acids in beta oxidation accumulate in the liver and stimulate PPAR-alpha, resulting in peroxisome proliferation, and tumorigenesis is a potential risk in long-term administration of PPAR-alpha agonists and in the Aox-1 knockout mouse[40,41]. Radical accumulation by blocking metabolic enzymes associated with beta-oxidation has been suggested as one explanation of tumorigenesis in Aox knockout mice, and furthermore, microarray analysis of Aox-deficient mice can show up-regulation of Lcn2, a marker of carcinogenesis[42]. Interestingly markers such as Lcn2 and Cd36 were up-regulated in hepatocytes during fibrogenesis and in the inflammatory cell fraction in the late phase in our model. Although tumorigenesis due to PPAR alpha agonist is thought not to occur in humans[41,43], abnormalities in lipid metabolism during liver fibrosis may have a role in steatofibrosis and/or enhancement of fibrosis and HCC.
Up-regulation of Gck and down-regulation of Pck1 in hepatocytes suggest a decrease in gluconeogenesis, and suppression of gluconeogenesis has been reported in cirrhosis[44]. A deficiency of Scl37a4 enzyme activity in humans causes glycogen storage disease type 1 (GSD-1) genetic disorders[45] and suppression of this molecule is associated with hepatic steatosis[46]. Abnormalities in metabolism and synthesis of sex hormone have also been found in fibrotic liver, and an increased ratio of estrogen to testosterone in serum induces feminization, which is a complication in cirrhotic males[47]. Abnormality of sex-hormone metabolism is also related to liver malignancies[48,49].
Down-regulation of Ghr is also found in hepatocytes, and long-term suppression of growth signals may greatly influence fundamental hepatic vitality and produce abnormal hepatic regeneration. Insensitivity to growth hormones in cirrhosis has been reported[50,51], and administration of growth hormone protects against experimental liver fibrosis[52]. Rgn, a regulator of calcium signaling, may have an important role in regulation of proliferation and apoptosis of hepatocytes, as well as in formation of HCC[53,54], and down-regulation of regucalcin in our model suggested a risk of HCC development. An association of Afp, Ste, Mt1a, Lcn2, Abcb1 Cml1 (Nat8) and Ca3 with hepatocellular carcinoma (HCC) formation has also been reported. Accumulation of estrogen in the liver is suspected to promote HCC[55,56], and NAT8 polymorphism may be related to HCC[57,58]. Down-regulation of metallothionein[59-61] and carbonic anhydrase[62,63], up-regulation of Mdr/Tap[64] and Lcn[42,65] occur in HCC, and proliferation of hepatoma cells is suppressed by over-expression of Rgn[53,66]. The abnormal expression of all these genes in our model is similar to that in HCC, suggesting the importance of understanding whether such changes in gene expression reflect a tumorigenic environment or even promote tumorigenesis.
Differential regulations of genes involved in key events of liver fibrosis
In addition to the expression profiles of cell type specific marker genes discussed above, we here describe how genes involved in key events of liver fibrogenesis are differentially regulated. Gene expression profiles of the whole liver for different functional categories in liver fibrogenesis, such as ECM synthesis/degradation, inflammation and oxidative stress, are shown in Figure 8. Since both synthesis and degradation of ECM occur simultaneously, both genes are put together. Figure 8 shows that most genes in each category have a common and mutually correlated expression pattern, showing different regulations for different categories. Most genes of ECM synthesis/degradation as shown in Figure 8A have a peak of up-regulation on d 4 and a following gradual up-regulation along with the progression of fibrosis, and interestingly these genes are classified into group 1 of the HSC -specific genes as shown in Figure 2. Another type of genes of ECM synthesis/degradation as shown in Figure 8B have no peak on d 4 and only a gradual up-regulation along with the progression of fibrosis, and are classified into group 2 of the HSC-specific genes as shown in Figure 2. Many genes are also involved in the inflammatory category, and here only some of them are plotted as representative in Figure 8C. Most genes of inflammation have a peak on d 4 or 7 commonly, and are classified in group 1 of the Kupffer cell fraction specfic genes as shown in Figure 4. Most genes in the catregory of oxidative stress in Figure 8D have a minimum expression on d 4, in contrast to the genes of inflammation having a peak on d 4 or 7, and are involved in hepatocyte specific genes as shown in Figure 6.
Figure 8.
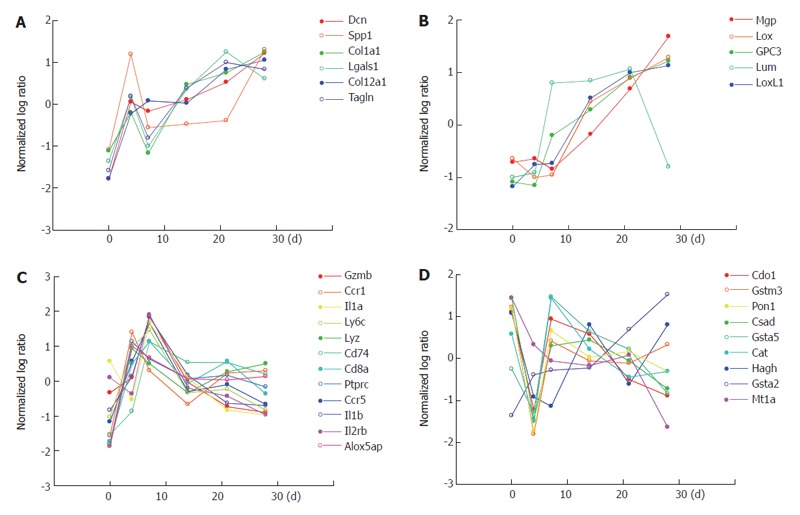
Differential regulations of genes involved in key events of liver fibrosis. Gene expression profiles of different events in liver fibrogenesis such as ECM synthesis/degradation, inflammation and oxidative stress, are shown. The x-axis showing the days of fibrogenesis (d 0, 4, 7 14, 21, 28) and the y-axis the normalized log ratio(scaled in terms of mean and SD, and the log base 2) of the whole liver gene expression. A and B: genes of ECM synthesis/degradation classified into group 1 (2) of HSCs as shown in Figure 2; C: genes of inflammation involved in the Kupffer cell fraction as shown in Figure 4; D: genes of oxidative stress involved in the hepatocytes as shown in Figure 6.
Gene expression profiles viewed from both cell types and functional categories have made more clear image on how the temporal expression pattern are closely associated in terms of both the cell specificity and functions in liver fibrosis, and are regulated differently in different categories but in a mutually correlated manner within the same category.
Pathological overview of the behavior of HSCs, inflammatory cells, and hepatocytes in fibrogenesis
Our results from gene-expression profiling using hepatic cell-specific marker genes support the hypothesis shown in Figure 9. Comparisons of gene expression in HSCs in vivo and in vitro strongly suggest that HSCs have self-supporting properties and that few exogenous molecules are required to activate and differentiate HSCs. Hepatocytes have been shown to suffer from serious stress during fibrogenesis, and signals from suppressed hepatocytes, such as radicals, prophlogistic substances and toxic metabolites due to abnormal metabolism, are able to stimulate Kupffer cells and HSCs, leading to subsequent production of HSC-stimulating-factors such as TNF-α and IL-1 by Kupffer cells. Therefore, HSCs, Kupffer cells and other inflammatory cells produce factors such as TGF-beta that suppress hepatocyte vitality and result in hepatocyte injury. Sequential activation of inflammatory cells such as lymphocytes and mast cells may be essential in this process, and even if this stimulatory circuit is small in scale during early remission of fibrogenesis, it can be maintained with appropriate stimulation even at long intervals, with small-scale inflammation induced by C-type hepatitis virus propagation. The self-supporting characteristics of HSCs may have a central role in maintenance of this circuit.
Figure 9.

Circuit model of hepatic cells in fibrogenesis. Gene expression profiles show that HSCs have self-activating properties, and that widespread damage to hepatocytes occurred in development of fibrosis, suggesting a self-activating circuit model of fibrogenesis. After an initial stimulatory trigger caused by events such as virus infection, hepatic cells are able to stimulate each other, and the self-activating properties of HSCs maintain this cycle over the long term. Details are given in the text.
ACKNOWLEDGMENTS
We thank Ms. Sonoko Ishizaki of Ajinomoto Co., for preparation of Kupffer cells. Additionally, we thank Mr. Kazuhisa Takemoto and Ms. Kunie Shimode for experimental assistance and manuscript preparation, respectively.
Footnotes
S- Editor Wang J L- Editor Wang XL E- Editor Bi L
References
- 1.Utsunomiya T, Okamoto M, Hashimoto M, Yoshinaga K, Shiraishi T, Tanaka F, Mimori K, Inoue H, Watanabe G, Barnard GF, et al. A gene-expression signature can quantify the degree of hepatic fibrosis in the rat. J Hepatol. 2004;41:399–406. doi: 10.1016/j.jhep.2004.05.015. [DOI] [PubMed] [Google Scholar]
- 2.Jiang Y, Liu J, Waalkes M, Kang YJ. Changes in the gene expression associated with carbon tetrachloride-induced liver fibrosis persist after cessation of dosing in mice. Toxicol Sci. 2004;79:404–410. doi: 10.1093/toxsci/kfh120. [DOI] [PubMed] [Google Scholar]
- 3.Geerts A. History, heterogeneity, developmental biology, and functions of quiescent hepatic stellate cells. Semin Liver Dis. 2001;21:311–335. doi: 10.1055/s-2001-17550. [DOI] [PubMed] [Google Scholar]
- 4.Kmieć Z. Cooperation of liver cells in health and disease. Adv Anat Embryol Cell Biol. 2001;161:III–XIII, 1-151. doi: 10.1007/978-3-642-56553-3. [DOI] [PubMed] [Google Scholar]
- 5.Horie T, Sakaida I, Yokoya F, Nakajo M, Sonaka I, Okita K. L-cysteine administration prevents liver fibrosis by suppressing hepatic stellate cell proliferation and activation. Biochem Biophys Res Commun. 2003;305:94–100. doi: 10.1016/s0006-291x(03)00691-0. [DOI] [PubMed] [Google Scholar]
- 6.Kawada N, Seki S, Inoue M, Kuroki T. Effect of antioxidants, resveratrol, quercetin, and N-acetylcysteine, on the functions of cultured rat hepatic stellate cells and Kupffer cells. Hepatology. 1998;27:1265–1274. doi: 10.1002/hep.510270512. [DOI] [PubMed] [Google Scholar]
- 7.Ishizaki-Koizumi S, Sonaka I, Fujitani S, Nishiguchi S. Mechanisms of the protective effect of L-alanine to D-galactosamine-induced hepatocellular injury: comparative studies of L-alanine and pyruvate. Biochem Biophys Res Commun. 2002;291:738–743. doi: 10.1006/bbrc.2002.6508. [DOI] [PubMed] [Google Scholar]
- 8.Friedman SL, Rockey DC, McGuire RF, Maher JJ, Boyles JK, Yamasaki G. Isolated hepatic lipocytes and Kupffer cells from normal human liver: morphological and functional characteristics in primary culture. Hepatology. 1992;15:234–243. doi: 10.1002/hep.1840150211. [DOI] [PubMed] [Google Scholar]
- 9.ten Hagen TL, van Vianen W, Bakker-Woudenberg IA. Isolation and characterization of murine Kupffer cells and splenic macrophages. J Immunol Methods. 1996;193:81–91. doi: 10.1016/0022-1759(96)00045-2. [DOI] [PubMed] [Google Scholar]
- 10.Margolin AA, Greshock J, Naylor TL, Mosse Y, Maris JM, Bignell G, Saeed AI, Quackenbush J, Weber BL. CGHAnalyzer: a stand-alone software package for cancer genome analysis using array-based DNA copy number data. Bioinformatics. 2005;21:3308–3311. doi: 10.1093/bioinformatics/bti500. [DOI] [PubMed] [Google Scholar]
- 11.Kozłowska J, Łoch T, Jabłońska J, Cianciara J. [Biochemical markers of fibrosis in chronic hepatitis and liver cirrhosis of viral origin] Przegl Epidemiol. 2001;55:451–458. [PubMed] [Google Scholar]
- 12.Armbrust T, Batusic D, Ringe B, Ramadori G. Mast cells distribution in human liver disease and experimental rat liver fibrosis. Indications for mast cell participation in development of liver fibrosis. J Hepatol. 1997;26:1042–1054. doi: 10.1016/s0168-8278(97)80113-4. [DOI] [PubMed] [Google Scholar]
- 13.Shimizu S, Satomura K, Aramaki T, Katsuta Y, Takano T, Omoto Y. Hepatic chymase level in chronic hepatitis: co-localization of chymase with fibrosis. Hepatol Res. 2003;27:62–66. doi: 10.1016/s1386-6346(03)00194-3. [DOI] [PubMed] [Google Scholar]
- 14.Stoyanova II. Relevance of mast cells and hepatic lobule innervation to liver injury. Rom J Gastroenterol. 2004;13:203–209. [PubMed] [Google Scholar]
- 15.Schnabl B, Purbeck CA, Choi YH, Hagedorn CH, Brenner D. Replicative senescence of activated human hepatic stellate cells is accompanied by a pronounced inflammatory but less fibrogenic phenotype. Hepatology. 2003;37:653–664. doi: 10.1053/jhep.2003.50097. [DOI] [PubMed] [Google Scholar]
- 16.Diegelmann RF, Evans MC. Wound healing: an overview of acute, fibrotic and delayed healing. Front Biosci. 2004;9:283–289. doi: 10.2741/1184. [DOI] [PubMed] [Google Scholar]
- 17.Lalazar A, Wong L, Yamasaki G, Friedman SL. Early genes induced in hepatic stellate cells during wound healing. Gene. 1997;195:235–243. doi: 10.1016/s0378-1119(97)00159-5. [DOI] [PubMed] [Google Scholar]
- 18.Elsharkawy AM, Oakley F, Mann DA. The role and regulation of hepatic stellate cell apoptosis in reversal of liver fibrosis. Apoptosis. 2005;10:927–939. doi: 10.1007/s10495-005-1055-4. [DOI] [PubMed] [Google Scholar]
- 19.Janoschek N, van de Leur E, Gressner AM, Weiskirchen R. Induction of cell death in activated hepatic stellate cells by targeted gene expression of the thymidine kinase/ganciclovir system. Biochem Biophys Res Commun. 2004;316:1107–1115. doi: 10.1016/j.bbrc.2004.02.147. [DOI] [PubMed] [Google Scholar]
- 20.Sancho-Bru P, Bataller R, Gasull X, Colmenero J, Khurdayan V, Gual A, Nicolás JM, Arroyo V, Ginès P. Genomic and functional characterization of stellate cells isolated from human cirrhotic livers. J Hepatol. 2005;43:272–282. doi: 10.1016/j.jhep.2005.02.035. [DOI] [PubMed] [Google Scholar]
- 21.Capurro M, Wanless IR, Sherman M, Deboer G, Shi W, Miyoshi E, Filmus J. Glypican-3: a novel serum and histo-chemical marker for hepatocellular carcinoma. Gastroenterology. 2003;125:89–97. doi: 10.1016/s0016-5085(03)00689-9. [DOI] [PubMed] [Google Scholar]
- 22.Moriguchi H, Sato C. The values and limitations of glypican-3 as a novel tumor marker for hepatocellular carcinoma from clinical and economic viewpoints. Gastroenterology. 2004;127:679–680. doi: 10.1053/j.gastro.2004.03.082. [DOI] [PubMed] [Google Scholar]
- 23.Akiyoshi H, Terada T. Mast cell, myofibroblast and nerve terminal complexes in carbon tetrachloride-induced cirrhotic rat livers. J Hepatol. 1998;29:112–119. doi: 10.1016/s0168-8278(98)80185-2. [DOI] [PubMed] [Google Scholar]
- 24.Matsunaga Y, Kawasaki H, Terada T. Stromal mast cells and nerve fibers in various chronic liver diseases: relevance to hepatic fibrosis. Am J Gastroenterol. 1999;94:1923–1932. doi: 10.1111/j.1572-0241.1999.01232.x. [DOI] [PubMed] [Google Scholar]
- 25.Yamashiro M, Kouda W, Kono N, Tsuneyama K, Matsui O, Nakanuma Y. Distribution of intrahepatic mast cells in various hepatobiliary disorders. An immunohistochemical study. Virchows Arch. 1998;433:471–479. doi: 10.1007/s004280050276. [DOI] [PubMed] [Google Scholar]
- 26.Conti P, DiGioacchino M. MCP-1 and RANTES are mediators of acute and chronic inflammation. Allergy Asthma Proc. 2001;22:133–137. doi: 10.2500/108854101778148737. [DOI] [PubMed] [Google Scholar]
- 27.Juremalm M, Nilsson G. Chemokine receptor expression by mast cells. Chem Immunol Allergy. 2005;87:130–144. doi: 10.1159/000087640. [DOI] [PubMed] [Google Scholar]
- 28.Ajuebor MN, Hogaboam CM, Kunkel SL, Proudfoot AE, Wallace JL. The chemokine RANTES is a crucial mediator of the progression from acute to chronic colitis in the rat. J Immunol. 2001;166:552–558. doi: 10.4049/jimmunol.166.1.552. [DOI] [PubMed] [Google Scholar]
- 29.Low TY, Leow CK, Salto-Tellez M, Chung MC. A proteomic analysis of thioacetamide-induced hepatotoxicity and cirrhosis in rat livers. Proteomics. 2004;4:3960–3974. doi: 10.1002/pmic.200400852. [DOI] [PubMed] [Google Scholar]
- 30.Pisi E, Marchesini G. Mechanisms and consequences of the impaired trans-sulphuration pathway in liver disease: Part II. Clinical consequences and potential for pharmacological intervention in cirrhosis. Drugs. 1990;40 Suppl 3:65–72. doi: 10.2165/00003495-199000403-00007. [DOI] [PubMed] [Google Scholar]
- 31.Cascino A, Cangiano C, Calcaterra V, Rossi-Fanelli F, Capocaccia L. Plasma amino acids imbalance in patients with liver disease. Am J Dig Dis. 1978;23:591–598. doi: 10.1007/BF01072593. [DOI] [PubMed] [Google Scholar]
- 32.Almasio P, Bianchi G, Marchesini G, Luca A, Bugianesi E, Le Grazie C, Pagliaro L. Sulphur amino acid pattern in chronic liver disease. Ital J Gastroenterol. 1994;26:21–25. [PubMed] [Google Scholar]
- 33.Matsui H, Kawada N. Effect of S-adenosyl-L-methionine on the activation, proliferation and contraction of hepatic stellate cells. Eur J Pharmacol. 2005;509:31–36. doi: 10.1016/j.ejphar.2004.12.041. [DOI] [PubMed] [Google Scholar]
- 34.Singh V, Miranda TB, Jiang W, Frankel A, Roemer ME, Robb VA, Gutmann DH, Herschman HR, Clarke S, Newsham IF. DAL-1/4.1B tumor suppressor interacts with protein arginine N-methyltransferase 3 (PRMT3) and inhibits its ability to methylate substrates in vitro and in vivo. Oncogene. 2004;23:7761–7771. doi: 10.1038/sj.onc.1208057. [DOI] [PubMed] [Google Scholar]
- 35.Tseng TL, Shih YP, Huang YC, Wang CK, Chen PH, Chang JG, Yeh KT, Chen YM, Buetow KH. Genotypic and phenotypic characterization of a putative tumor susceptibility gene, GNMT, in liver cancer. Cancer Res. 2003;63:647–654. [PubMed] [Google Scholar]
- 36.Lalouschek W, Aull S, Deecke L, Schnider P, Uhl F, Zeiler K. [Hyperhomocyst(e)inemia--an independent risk factor of stroke] Fortschr Neurol Psychiatr. 1996;64:271–277. doi: 10.1055/s-2007-996395. [DOI] [PubMed] [Google Scholar]
- 37.Tsai MY, Arnett DK, Eckfeldt JH, Williams RR, Ellison RC. Plasma homocysteine and its association with carotid intimal-medial wall thickness and prevalent coronary heart disease: NHLBI Family Heart Study. Atherosclerosis. 2000;151:519–524. doi: 10.1016/s0021-9150(99)00409-8. [DOI] [PubMed] [Google Scholar]
- 38.Look MP, Riezler R, Reichel C, Brensing KA, Rockstroh JK, Stabler SP, Spengler U, Berthold HK, Sauerbruch T. Is the increase in serum cystathionine levels in patients with liver cirrhosis a consequence of impaired homocysteine transsulfuration at the level of gamma-cystathionase. Scand J Gastroenterol. 2000;35:866–872. doi: 10.1080/003655200750023255. [DOI] [PubMed] [Google Scholar]
- 39.Yamamoto S. Oral taurine therapy for painful muscle cramp in liver cirrhosis. Am J Gastroenterol. 1994;89:457–458. [PubMed] [Google Scholar]
- 40.Chu R, Lim H, Brumfield L, Liu H, Herring C, Ulintz P, Reddy JK, Davison M. Protein profiling of mouse livers with peroxisome proliferator-activated receptor alpha activation. Mol Cell Biol. 2004;24:6288–6297. doi: 10.1128/MCB.24.14.6288-6297.2004. [DOI] [PMC free article] [PubMed] [Google Scholar]
- 41.Gonzalez FJ. Recent update on the PPAR alpha-null mouse. Biochimie. 1997;79:139–144. doi: 10.1016/s0300-9084(97)81506-4. [DOI] [PubMed] [Google Scholar]
- 42.Meyer K, Lee JS, Dyck PA, Cao WQ, Rao MS, Thorgeirsson SS, Reddy JK. Molecular profiling of hepatocellular carcinomas developing spontaneously in acyl-CoA oxidase deficient mice: comparison with liver tumors induced in wild-type mice by a peroxisome proliferator and a genotoxic carcinogen. Carcinogenesis. 2003;24:975–984. doi: 10.1093/carcin/bgg040. [DOI] [PubMed] [Google Scholar]
- 43.Roglans N, Bellido A, Rodríguez C, Cabrero A, Novell F, Ros E, Zambón D, Laguna JC. Fibrate treatment does not modify the expression of acyl coenzyme A oxidase in human liver. Clin Pharmacol Ther. 2002;72:692–701. doi: 10.1067/mcp.2002.128605. [DOI] [PubMed] [Google Scholar]
- 44.Changani KK, Jalan R, Cox IJ, Ala-Korpela M, Bhakoo K, Taylor-Robinson SD, Bell JD. Evidence for altered hepatic gluconeogenesis in patients with cirrhosis using in vivo 31-phosphorus magnetic resonance spectroscopy. Gut. 2001;49:557–564. doi: 10.1136/gut.49.4.557. [DOI] [PMC free article] [PubMed] [Google Scholar]
- 45.Chou JY. The molecular basis of type 1 glycogen storage diseases. Curr Mol Med. 2001;1:25–44. doi: 10.2174/1566524013364112. [DOI] [PubMed] [Google Scholar]
- 46.Bandsma RH, Wiegman CH, Herling AW, Burger HJ, ter Harmsel A, Meijer AJ, Romijn JA, Reijngoud DJ, Kuipers F. Acute inhibition of glucose-6-phosphate translocator activity leads to increased de novo lipogenesis and development of hepatic steatosis without affecting VLDL production in rats. Diabetes. 2001;50:2591–2597. doi: 10.2337/diabetes.50.11.2591. [DOI] [PubMed] [Google Scholar]
- 47.Maruyama Y, Adachi Y, Aoki N, Suzuki Y, Shinohara H, Yamamoto T. Mechanism of feminization in male patients with non-alcoholic liver cirrhosis: role of sex hormone-binding globulin. Gastroenterol Jpn. 1991;26:435–439. doi: 10.1007/BF02782811. [DOI] [PubMed] [Google Scholar]
- 48.Rossi L, Leveri M, Gritti C, De Silvestri A, Zavaglia C, Sonzogni L, Silvestri L, Civardi E, Mondelli MU, Silini EM. Genetic polymorphisms of steroid hormone metabolizing enzymes and risk of liver cancer in hepatitis C-infected patients. J Hepatol. 2003;39:564–570. doi: 10.1016/s0168-8278(03)00355-6. [DOI] [PubMed] [Google Scholar]
- 49.Granata OM, Carruba G, Montalto G, Miele M, Bellavia V, Modica G, Blomquist CH, Castagnetta LA. Altered androgen metabolism eventually leads hepatocellular carcinoma to an impaired hormone responsiveness. Mol Cell Endocrinol. 2002;193:51–58. doi: 10.1016/s0303-7207(02)00095-3. [DOI] [PubMed] [Google Scholar]
- 50.Bucuvalas JC, Horn JA, Chernausek SD. Resistance to growth hormone in children with chronic liver disease. Pediatr Transplant. 1997;1:73–79. [PubMed] [Google Scholar]
- 51.Donaghy AJ, Delhanty PJ, Ho KK, Williams R, Baxter RC. Regulation of the growth hormone receptor/binding protein, insulin-like growth factor ternary complex system in human cirrhosis. J Hepatol. 2002;36:751–758. doi: 10.1016/s0168-8278(02)00049-1. [DOI] [PubMed] [Google Scholar]
- 52.Chen S, Wang HT, Yang B, Fu YR, Ou QJ. Protective effects of recombinant human growth hormone on cirrhotic rats. World J Gastroenterol. 2004;10:2894–2897. doi: 10.3748/wjg.v10.i19.2894. [DOI] [PMC free article] [PubMed] [Google Scholar]
- 53.Izumi T, Yamaguchi M. Overexpression of regucalcin suppresses cell death and apoptosis in cloned rat hepatoma H4-II-E cells induced by lipopolysaccharide, PD 98059, dibucaine, or Bay K 8644. J Cell Biochem. 2004;93:598–608. doi: 10.1002/jcb.20214. [DOI] [PubMed] [Google Scholar]
- 54.Tsurusaki Y, Yamaguchi M. Role of regucalcin in liver nuclear function: binding of regucalcin to nuclear protein or DNA and modulation of tumor-related gene expression. Int J Mol Med. 2004;14:277–281. [PubMed] [Google Scholar]
- 55.Farrell GC, Koltai A, Murray M. Source of raised serum estrogens in male rats with portal bypass. J Clin Invest. 1988;81:221–228. doi: 10.1172/JCI113299. [DOI] [PMC free article] [PubMed] [Google Scholar]
- 56.Lampropoulou-Karatzas C, Goritsas P, Makri MG. Low serum testosterone: a special feature of hepatocellular carcinoma. Eur J Med. 1993;2:23–27. [PubMed] [Google Scholar]
- 57.Agundez JA, Olivera M, Ladero JM, Rodriguez-Lescure A, Ledesma MC, Diaz-Rubio M, Meyer UA, Benitez J. Increased risk for hepatocellular carcinoma in NAT2-slow acetylators and CYP2D6-rapid metabolizers. Pharmacogenetics. 1996;6:501–512. doi: 10.1097/00008571-199612000-00003. [DOI] [PubMed] [Google Scholar]
- 58.Yu MW, Pai CI, Yang SY, Hsiao TJ, Chang HC, Lin SM, Liaw YF, Chen PJ, Chen CJ. Role of N-acetyltransferase polymor-phisms in hepatitis B related hepatocellular carcinoma: impact of smoking on risk. Gut. 2000;47:703–709. doi: 10.1136/gut.47.5.703. [DOI] [PMC free article] [PubMed] [Google Scholar]
- 59.Endo T, Yoshikawa M, Ebara M, Kato K, Sunaga M, Fukuda H, Hayasaka A, Kondo F, Sugiura N, Saisho H. Immunohistochemical metallothionein expression in hepatocellular carcinoma: relation to tumor progression and chemoresistance to platinum agents. J Gastroenterol. 2004;39:1196–1201. doi: 10.1007/s00535-004-1471-1. [DOI] [PubMed] [Google Scholar]
- 60.Huang GW, Yang LY. Metallothionein expression in hepatocellular carcinoma. World J Gastroenterol. 2002;8:650–653. doi: 10.3748/wjg.v8.i4.650. [DOI] [PMC free article] [PubMed] [Google Scholar]
- 61.Waalkes MP, Diwan BA, Rehm S, Ward JM, Moussa M, Cherian MG, Goyer RA. Down-regulation of metallothionein expression in human and murine hepatocellular tumors: association with the tumor-necrotizing and antineoplastic effects of cadmium in mice. J Pharmacol Exp Ther. 1996;277:1026–1033. [PubMed] [Google Scholar]
- 62.Kuo WH, Chiang WL, Yang SF, Yeh KT, Yeh CM, Hsieh YS, Chu SC. The differential expression of cytosolic carbonic anhydrase in human hepatocellular carcinoma. Life Sci. 2003;73:2211–2223. doi: 10.1016/s0024-3205(03)00597-6. [DOI] [PubMed] [Google Scholar]
- 63.Saarnio J, Parkkila S, Parkkila AK, Pastorekova S, Haukipuro K, Pastorek J, Juvonen T, Karttunen TJ. Transmembrane carbonic anhydrase, MN/CA IX, is a potential biomarker for biliary tumours. J Hepatol. 2001;35:643–649. doi: 10.1016/s0168-8278(01)00193-3. [DOI] [PubMed] [Google Scholar]
- 64.Nagasue N, Dhar DK, Makino Y, Yoshimura H, Nakamura T. Overexpression of P-glycoprotein in adenomatous hyperplasia of human liver with cirrhosis. J Hepatol. 1995;22:197–201. doi: 10.1016/0168-8278(95)80429-3. [DOI] [PubMed] [Google Scholar]
- 65.Hanai J, Mammoto T, Seth P, Mori K, Karumanchi SA, Barasch J, Sukhatme VP. Lipocalin 2 diminishes invasiveness and metastasis of Ras-transformed cells. J Biol Chem. 2005;280:13641–13647. doi: 10.1074/jbc.M413047200. [DOI] [PubMed] [Google Scholar]
- 66.Misawa H, Inagaki S, Yamaguchi M. Suppression of cell proliferation and deoxyribonucleic acid synthesis in the cloned rat hepatoma H4-II-E cells overexpressing regucalcin. J Cell Biochem. 2001;84:143–149. doi: 10.1002/jcb.1274. [DOI] [PubMed] [Google Scholar]