Abstract
AIM: To elucidate the significance of Doppler measurements of hepatic vein in cirrhotic patients and to correlate with liver dysfunction and hepatic hemodynamics.
METHODS: One hundred patients with liver cirrhosis and 60 non-cirrhotic controls were studied. Doppler waveforms were obtained from right hepatic vein and flow velocity measured during quiet respiration. Doppler measurements were also obtained from portal trunk, right portal vein and proper hepatic artery.
RESULTS: Hepatic vein waveforms were classified into three classical patterns. Flat waveform was uncommon. Mean hepatic vein velocity was significantly higher in cirrhotic patients (12.7 ± 6.4 vs 5.1 ± 2.1 and 6.2 ± 3.2 cm/s; P < 0.0001). The poorer the grade of cirrhosis, the higher was the mean velocity. Maximum forward velocity was never greater than 40 cm/s in controls. Degree of ascites was found to be highly correlated with mean velocity. “Very high” group (≥ 20 cm/s) presented clinically with moderate to massive ascites. Correlations between right portal flow and mean velocity was significant (P < 0.0001, r = 0.687).
CONCLUSION: Doppler waveforms of hepatic vein, which is independent of liver dysfunction, should be obtained during normal respiration. Mean hepatic vein velocity reflects the change in hepatic circulation associated with progression of liver cirrhosis. It can be used as a new parameter in the assessment of liver cirrhosis.
Keywords: Hepatic vein, Hepatic vein velocity, Doppler ultrasound
INTRODUCTION
There are many studies on inflow to the liver in liver cirrhosis (LC) in relation to hepatic dysfunction and portal hypertension. In LC, there are changes in liver parenchyma as well as alteration of hepatic vasculature, including morphological changes of the hepatic vein. Furthermore, it is accepted that abnormal circulation caused by hyperdynamic circulation and intrahepatic shunt persists in cirrhotic liver. Therefore, we assumed that an alteration in hepatic venous hemodynamics is present in cirrhotic liver. It is of interest to find out the clinical significance of hepatic venous hemodynamic changes in liver cirrhosis, and to explore which factor, singly or in combination, produces such changes if there is any. Due to the fact that hemodynamic studies of the hepatic vein is still limited, we aimed to study the hepatic venous hemodynamics using non-invasive Doppler ultrasonography.
Doppler waveform of the hepatic vein (HV) in healthy humans is a triphasic waveform, consisting of two neg-ative waves and one positive wave[1]. As for abnormal hemodynamics of the hepatic vein in cirrhotic liver, there are reports of Doppler studies suggesting that the waveform becomes flat when hepatocellular function is impaired, and some studies even proposed that flattening of the hepatic waveform could be used as a diagnostic tool for chronic parenchymal liver disease[2-6]. However, there are equivocal results regarding change in waveforms of the HV in parenchymal liver diseases. The large degree of overlap in the waveforms between various types of parenchymal liver diseases makes the interpretation of waveform difficult. In this study, we aimed to reevaluate the use of Doppler waveform of the right hepatic vein in LC without respiratory maneuver, as there have been conflicting reports on use of it as a diagnostic tool in the chronic parenchymal liver disease. Furthermore, we studied a quantitative analysis of hepatic venous blood flow, which, to the best of our knowledge, has not been reported previously.
MATERIALS AND METHODS
Subjects
One hundred and sixteen consecutive patients with LC, subjected to Doppler examination from July 2002 to September 2003, were enrolled in this prospectively designed study. Patients with enlarged inferior right hepatic vein (n = 2), portal thrombosis (n = 5), hepatofugal portal blood flow (n = 2), tricuspid regurgitation (n = 2), insufficient visualization of hepatic artery (n = 2), right portal vein (n = 1), and right hepatic vein (n = 2) were excluded from the study. Remaining 100 patients (57 women and 43 men; mean age 63 ± 7 years) were studied. The diagnosis of LC was based on histopathology and/or imaging diagnosis along with clinical and biochemistry parameters. The etiology of LC was viral in 77 (HCV: 69; HBV: 7; HCV + HBV: 1), alcohol in 14 and primary biliary cirrhosis in 9 patients. The severity of liver dysfunction, as assessed by Child-Pugh scoring system[7], was A in 46, B in 29 and C in 25 patients. In addition, study was carried out in randomly selected 60 non-cirrhotic patients as controls. Among them were 30 patients with histopathological diagnosis of chronic hepatitis (14 women and 16 men; mean age 57 ± 7 years) without any evidence of LC and same number of volunteers (17 women and 13 men; mean age 57 ± 6 years) without any clinical, laboratory or imaging evidence of liver disease. Causes of chronic hepatitis were hepatitis C virus in 24, hepatitis B virus in 6 patients. The control group did not differ significantly from the study population with respect to age, sex, height and weight. Cardiac disease and respiratory disease that may cause change in the Doppler waveform of the hepatic vein were ruled out in all patients and controls.
Instrument
The instrument used in this study was a pulsed Doppler flowmeter (PowerVision 8000) with a 3.75-MHz convex and sector probe. The system is equipped with software to compute the time-averaged velocity from the velocity spectral display after placement of the calipers. Doppler sample volume was positioned in the center of the vessel or at the point when it was defined. The sample width was selected to cover almost entire vessel diameter. Pulse repetition frequency was adjusted so as not to exceed the limit of the displayed maximum velocity. Care was taken to ensure that the angle of insonation was always smaller than 60. Internal diameter of the vessels was measured manually after optimizing B mode images.
Doppler measurements
Each subject was examined after overnight fasting in supine position after a rest of 15 min so as to avoid any influence of food, posture and exercise. Overall assessment of the hepatobiliary system by B mode was made before Doppler examination. Size of the right lobe in cirrhotic patients was assessed by the method described by Matsutani et al[8]. Visual grading of ascites as appeared during ultrasonography was done. Right hepatic vein was approached from right intercostal space. The reason behind choosing the right hepatic vein over other is that the middle and left hepatic vein often join each other before draining to the inferior venacava. Doppler study of the hepatic vein was performed by positioning the sample volume between 2-3 cm from the opening into the inferior venacava. Patients were asked to breath normally during tracing of the waveforms. Hepatic Doppler waveforms were divided into three types. The waveforms were considered triphasic when one of the waves showed reversed flow, that is, any wave above the baseline. Flat waveforms were those without any phasic oscillation. Those without reversed flow but showing phasic oscillations were regarded as biphasic waveform. Mean flow velocity was calculated automatically by the instrument after tracing of the spectral display (of one cardiac cycle), whereas maximum and minimum velocity were calculated manually. For flat waveforms, ECG was simultaneously recorded to determine one complete cardiac cycle.
The portal vein was evaluated at about middle of the portal trunk by approaching from the epigastrium with the probe placed slightly obliquely. The right portal vein was approached from the right intercostal spaces. Mean velocity and flow (of portal trunk and right portal vein) were calculated by instrument after obtaining Doppler waveforms. The hepatic artery was examined similarly to the portal trunk as it runs almost parallel with the portal vein before entering into the hepatic hilum. At this position gastroduodenal arteries are expected to have branched from the common hepatic artery. Peak systolic velocity was calculated manually, whereas mean velocity was calculated by the instrument after manual tracing of the maximum point of the spectral display. Doppler examinations were performed by two authors (SKC and SM) without prior knowledge of clinical and biochemical status of the study population. Three readings were taken for each vessel and the mean of three was noted as the final reading. Written informed consent was obtained from all the patients and controls. The study protocol conforms to the ethical guidelines of the 1975 Helsinki Declaration, and approved by Senior Staff Committee.
Statistical analysis
The statistical analyses were carried out using SPSS ver. 10.0 (SPSS Inc., Chicago, IL, USA). All the measurements were expressed as mean ± SD. To compare means, Student’s t test was performed. For multiple values, ANOVA (analysis of variance) with LSD (least square design) was used. P < 0.05 and r > 0.6 were considered statistically significant.
RESULTS
Hepatic vein waveforms
All non-cirrhotic controls showed triphasic waveforms of HV. In cirrhotic patients triphasic pattern was observed in 49 (49%) patients, biphasic in 48 (48%) patients and flat in 3 (3%) patients. Types of the waveforms according to the grade of liver function are shown in Table 1. The result showed that the appearance of waveform was independent of the degree of severity of liver dysfunction as graded by Child-Pugh score. Flat waveform was very rare, appearing only on three occasions. Out of 3 patients, 2 were Child-Pugh A and were clinically stable. Hepatic encephalopathy and ascites were absent in all 3 patients.
Table 1.
Hepatic vein waveforms in study population n (%)
|
Non-cirrhotic controls |
Liver cirrhosis patients |
||||
| No liver | Chronic | A | B | C | |
| pathology | hepatitis | n = 46 | n = 29 | n = 25 | |
| Triphasic | 30 | 30 | 26 (56.6%) | 16 (55.2%) | 7 (28%) |
| Biphasic | 0 | 0 | 18 (39.1%) | 13 (44.8%) | 17 (68%) |
| Flat | 0 | 0 | 2 (4.3%) | 0 | 1 (4%) |
There was no correlation between waveforms and liver dysfunction.
Correlation of hepatic vein velocity with liver dysfunction
Table 2 summarizes the results of hemodynamic data in the study population. Mean hepatic vein velocity was significantly higher in cirrhotics than non-cirrhotic controls (12.7 ± 6.4 vs 5.1 ± 2.1 and 6.2 ± 3.2 cm/s; P < 0.001) (Figure 1). There was no statistical significance of mean among three etiological subsets of cirrhotic patients (data not shown). The poorer the grade of cirrhosis by Child-Pugh grade, the higher was the velocity (Figure 2). Rise in MHVV was independent of hepatic vein diameter. We defined the “very high” group as those patients who had MHVV 20 cm/s or more. We took watershed of 20 cm/s as it was more than mean plus SD values and provided best separation between two groups. There were 15 patients who had MHVV more than 20 cm/s. Similarly, maximum forward velocity was higher in LC patients than controls (Figure 3). It was never more than 40 cm/s in controls. There was no correlation of MHVV with serum bilirubin (P < 0.11, r = 0.279), serum albumin (P < 0.12, r = -0.276) and prothrombin time (P < 0.002, r = - 0.377) (Figure 4 A-C). On the other hand, there was strong correlation of MHVV with grades of ascites. We divided the patients into three groups: nil (n = 62), minimal (n = 16) and moderate to massive (n = 22), depending upon the accumulation of ascitic fluid. Cases associated with moderate to massive ascites had significantly higher MHVV than other groups (Figure 5). Correspondingly, “very high” group were always associated with moderate to massive ascites.
Table 2.
Hemodynamic data in study population (mean ± SD)
|
Control (non-cirrhotic) |
Liver cirrhosis |
||||
| NLP | CH | A | B | C | |
| Portal trunk | |||||
| Diameter (mm) | 8.9 ± 1.0 | 9.9 ± 1.0 | 11.9 ± 2.5 | 11.6 ± 2.0 | 12.5 ± 2.5 |
| MFV (cm/s) | 13.3 ± 3.1 | 11.5 ± 3.1 | 9.96 ± 2.91 | 9.40 ± 2.41 | 9.59 ± 2.54 |
| FV (mL/min) | 516 ± 96 | 504 ± 140 | 691 ± 323 | 700 ± 226 | 753 ± 206 |
| Right Portal vein | |||||
| Diameter (mm) | 7.5 ± 1.0 | 7.6 ± 1.0 | 9.1 ± 1.9 | 9.6 ± 2.0 | 9.7 ± 1.7 |
| MFV (cm/s) | 12.2 ± 3.7 | 11.2 ± 2.8 | 8.45 ± 2.97 | 8.31 ± 2.43 | 9.31 ± 2.01 |
| FV (mL/min) | 318 ± 92 | 282 ± 86 | 357 ± 182 | 365 ± 139 | 415 ± 169 |
| Proper hepatic artery | |||||
| Diameter (mm) | 2.8 ± 0.3 | 3.1 ± 0.5 | 3.6 ± 0.7 | 3.6 ± 0.7 | 3.8 ± 0.8 |
| MFV (cm/s) | 26.9 ± 5.1 | 24.4 ± 5.5 | 25.0 ± 10.8 | 26.3 ± 6.3 | 28.8 ± 11.3 |
| Vmax (cm/s) | 55.2 ± 12.0 | 55.3 ± 11.4 | 56.3 ± 18.5 | 61.1 ± 16.9 | 64.4 ± 21.8 |
| Hepatic vein | |||||
| Diameter (mm) | 5.8 ± 1.6 | 6.0 ± 1.1 | 5.5 ± 1.6 | 4.7 ± 1.1 | 4.7 ± 1.1 |
| MHVV (cm/s) | 5.1 ± 2.1 | 6.6 ± 3.2 | 9.7 ± 4.1 | 11.6 ± 5.4 | 19.1 ± 10.3 |
| MFFV (cm/s) | 23.1 ± 6.0 | 24.7 ± 6.3 | 31.8 ± 11.4 | 40.2 ± 16.4 | 48.8 ± 17.5 |
CH: Chronic hepatitis; NLP: No liver pathology; MHVV: Mean hepatic vein velocity; MFV: Mean flow velocity; FV: Flow volume; Vmax: Peak systolic velocity; MFFV: Maximum forward flow velocity.
Figure 1.
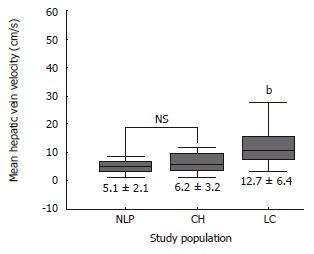
Mean hepatic vein velocity in study populations. It was significantly higher in cirrhotic patients than non-cirrhotic controls. (mean ± SD; bP < 0.0001 vs NLP and CH).
Figure 2.
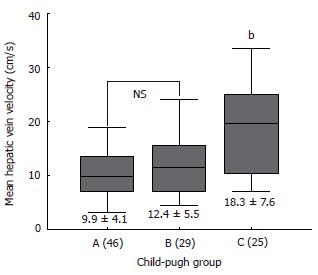
Mean hepatic vein velocity in study population. Hepatic vein velocity in cirrhotic patients according to Child-Pugh group (mean ± SD; bP < 0.0001 vs A and B).
Figure 3.
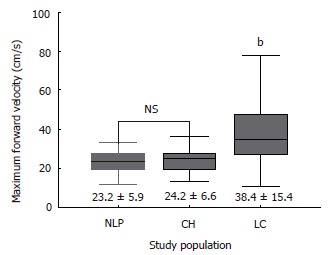
Maximum forward velocity of hepatic vein in study populations. (mean ± SD; bP < 0.0001 vs NLP and CH).
Figure 4.
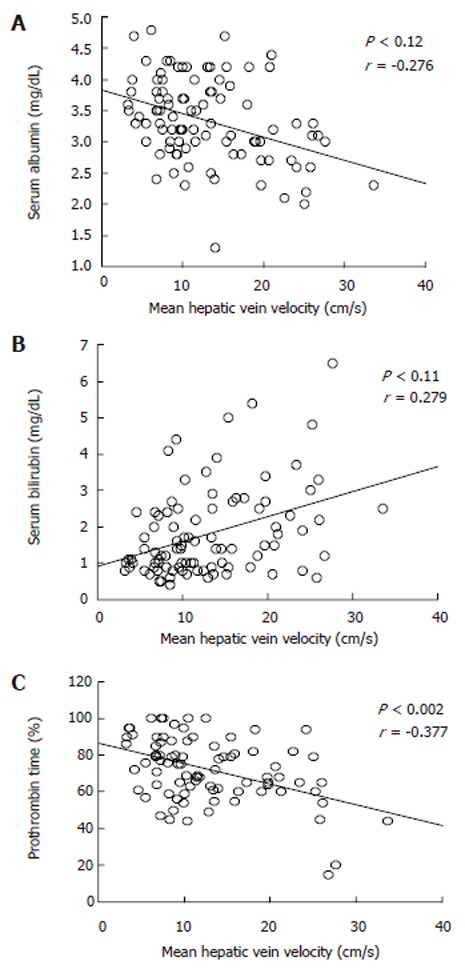
Relation between mean hepatic vein velocity and liver function test in cirrhotic patients. A: serum albumin; B: serum bilirubin; C: prothrombin time.
Figure 5.
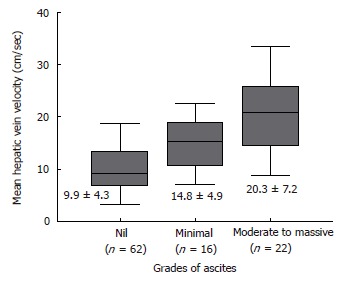
Mean hepatic vein velocity in patients depending upon the accumulation of ascites. (mean ± SD; bP < 0.01 vs nil and moderate to massive).
Correlation of hepatic vein velocity with hepatic hemodynamics
There was no correlation of MHVV with portal flow, portal velocity and hepatic artery velocity (r = -0.105, 0.391 and 0.297, respectively). However, we found a significant correlation of MHVV with right portal flow in LC patients (P < 0.0001, r = 0.687) (Figure 6A). No such correlation was seen in non-cirrhotic controls (P < 0.767, r = -0.042) (Figure 6B). Right portal flow was significantly higher in the “very high” group (331 ± 120 mL/min vs 526 ± 133 mL/min) (Figure 7). Those cases, which were not associated with increased right portal flow, had increased peak systolic velocity of the hepatic artery in the “very high” group.
Figure 6.
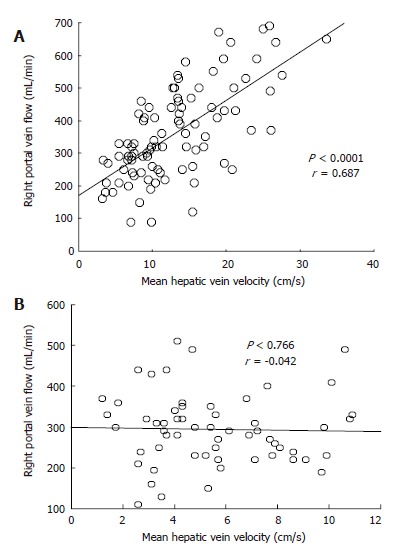
Correlation between mean hepatic vein velocity and right portal vein flow in cirrhotic patients (A) and controls (B).
Figure 7.
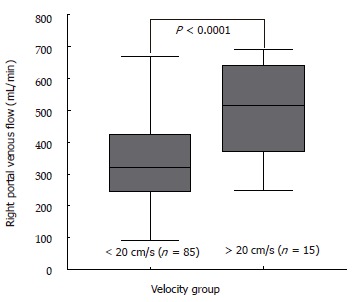
Right portal flow in cirrhotic patients. “Very high” group, which we defined as those having velocity ≥ 20 cm/s had increased perfusion of right lobe of the liver.
The intra-observer variability was 5% in the hepatic vein, 7% in the portal trunk and right portal vein and 10% in the hepatic artery measurements. Regarding tracing of waveform of right hepatic vein, it was nil.
DISCUSSION
This study argues against the appearance of flat waveform of the hepatic vein in cirrhotic patients with impaired liver function. This is based on the finding that the waveform of the hepatic vein in this study was independent of liver function and Child-Pugh score. Only 3 patients showed flat waveform and only 1 of them was C by Child-Pugh grading. However, change of waveform to biphasic from triphasic seems suggestive of some changes in the liver parenchyma as only cirrhotic patients showed change from triphasic to biphasic or flat waveform. Although the phasicity is cardiac in origin, predominantly the change in right atrial pressure changes, respiratory motion can alter the HV waveforms and its components[9]. We noticed that the negative oscillation disappears with respiratory maneuvers in some patients and this may be the reason for discrepancy in findings regarding the negative waves in many studies. However, this change in waveforms with different respiratory maneuvers was an equivocal finding and the reason is not well understood why it occurs in some patients only. In the same line, flat waveform in 9.33% (7/75) subjects without liver and cardiac disease can be explained[10]. Bolondi et al[2] have reported that the underlying mechanism of the change in the hepatic vein waveform may be related to liver fibrosis, which progressively reduces phasic oscillation in hepatic veins. However, in our patients, triphasic waveform was seen even in significantly atrophied liver with marked nodule formation on histopathological specimens. Our experience showed that inadvertent measurement of Doppler waveform from inferior right hepatic vein or enlarged marginal vein sometimes might give flat waveform. In two of the cases that were excluded in this study, flat waveforms were obtained from the inferior right hepatic vein, while right hepatic vein showed triphasic waveforms.
To our knowledge, this is the first time MHVV has been measured by Doppler in cirrhotic patients. It was significantly higher in cirrhotic than non-cirrhotic patients and there was significant difference of mean between cirrhotic and non-cirrhotic controls. Furthermore, the poorer the liver function, the higher was the MHVV. No increase in MHVV in chronic hepatitis patients indicates that no measurable hemodynamic changes occur before the onset of LC. On line with other studies[4], maximum forward velocity was also significantly elevated in LC patients. In non-cirrhotic patients, the maximum velocity was never higher than 40 cm/s. Thus, we propose that coupled with maximum forward velocity, it can be used as a supplementary diagnostic tool in liver cirrhosis. As there was no correlation between serum albumin, serum bilirubin, prothrombin time, role of liver cell dysfunction was ruled out. However, ascites showed significant correlation with MHVV which was significantly higher in the patients presenting clinically with moderate to massive ascites. Thus, we hypothesize that the MHVV is subjected to change with hepatic hemodynamics not directly related to liver cell function.
A positive correlation of hepatic vein velocity with grades of ascites was found. Although authentic volumetric data was not obtained in study cases, those cases with very high velocity had atrophied right lobe of the liver on ultrasonography (data not included). Our finding is also supported by Torres et al[11], who have reported that in LC, the right lobe frequently atrophies, while the left lateral lobe becomes hypertrophic. High inflow of the atrophied right lobe of the liver may be one of the plausible explanations of relation with ascites. In an in vitro liver perfusion system, lymph could be seen oozing from the surface of the liver when portal perfusion pressure was acutely increased[12]. However, further study is considered necessary to establish the exact role of hepatic microcirculation, which appears to be instrumental in modifying MHVV, with ascites formation, as it is still imprecisely known. If the mechanism is uncovered, measurement of MHVV can be used to evaluate the efficacy of different treatment modalities in the treatment of ascites related to LC.
In this study, cirrhotic patients showed correlation of MHVV with right portal flow, while non-cirrhotic controls demonstrated no correlation between them. In normal subjects, blood flows from the portal venules into the hepatic vein system traversing through hepatic sinusoids. An autoregulation of flow at the level of sinusoids is present in normal liver, which is supposed to control the blood flowing to the hepatic vein. However, in the cirrhotic liver, there are various changes. It is reported that a direct communication occurs between two venous systems[13]. Moreover, it has been hypothesized that functionally inactive pre-existing arterio-venous shunts are opened in a response to intense vasodilatation[14]. Hiraki et al[15] showed that maximum peak velocity of right portal vein decreased substantially with temporary occlusion of the right hepatic vein. Change in hepatic arterial hemodynamics was seen with the same maneuver. Therefore, the alteration in hemodynamics of the portal vein and hepatic artery can have an influence on hepatic vein, its flow and waveform. Our study also proves this fact as those cases associated with high velocity of the right hepatic vein were found to have increased perfusion of the right lobe of the liver by right portal vein. It can be explained by the fact that there is increased porto-venous shunt in cirrhotic liver and the flow may have bypassed to the hepatic vein, thereby increasing its flow velocity. In cases not associated with increased right portal flow, hepatic artery velocity was increased. Arterial flow is expected to increase in LC due to arterialization of the cirrhotic liver that contributes to increased inflow to the liver[16]. Furthermore, there is arterio-venous shunt formation in cirrhotic liver that usually can not be detected, even by standard imaging diagnostic procedures. In recent years, transit-time analysis of contrast agent in cirrhotic patients has been proposed for non-invasive diagnosis of LC[17]. The findings have shown that there is early arrival time of the contrast agent and early peak enhancement in HV of cirrhotic patients compared to non-cirrhotic patients. Similar study carried out recently concluded that intrahepatic hemodynamic changes are responsible for this[18]. This supports the result of our findings. However, there is deranged autoregulation of sinusoidal flow present in cirrhotic liver along with intrahepatic shunt formation; it is difficult to arbitrate which factor is more predominant to determine the correlation.
In vitro study has shown that Doppler flowmetry is relatively accurate and reproducible. Thus, this technique is increasingly being used in clinical practice to study hepatic hemodynamics. We have applied it to study the right hepatic vein and an attempt has been made to correlate the hemodynamic findings with severity of liver dysfunction in cirrhotic patients. We observed that the cirrhotic patients had increased velocity of the hepatic vein and those cases with very high velocity were having poorer liver function as graded by Child-Pugh classification. Correlation of MHVV with ascites, but not albumin, bilirubin or prothrombin time substantiates its association with hepatic microcirculation. Simple measurement of hepatic vein velocity can give information on deranged hepatic microcirculation. Hence, we advocate that Doppler measurement of hepatic vein velocity, which is non-invasive, can be used as a new parameter in the investigation of chronic parenchymal liver disease.
Footnotes
S- Editor Pan BR L- Editor Kumar M E- Editor Bai SH
References
- 1.Burns PN. Hemodynamics. In: Taylor KJW, Burns PN, Wells PNT, editors. Clinical applications of Doppler ultrasound. New York: Raven Press; 1988. pp. 46–75. [Google Scholar]
- 2.Bolondi L, Li Bassi S, Gaiani S, Zironi G, Benzi G, Santi V, Barbara L. Liver cirrhosis: changes of Doppler waveform of hepatic veins. Radiology. 1991;178:513–516. doi: 10.1148/radiology.178.2.1987617. [DOI] [PubMed] [Google Scholar]
- 3.Ohta M, Hashizume M, Tomikawa M, Ueno K, Tanoue K, Sugimachi K. Analysis of hepatic vein waveform by Doppler ultrasonography in 100 patients with portal hypertension. Am J Gastroenterol. 1994;89:170–175. [PubMed] [Google Scholar]
- 4.von Herbay A, Frieling T, Häussinger D. Association between duplex Doppler sonographic flow pattern in right hepatic vein and various liver diseases. J Clin Ultrasound. 2001;29:25–30. doi: 10.1002/1097-0096(200101)29:1<25::aid-jcu4>3.0.co;2-a. [DOI] [PubMed] [Google Scholar]
- 5.Colli A, Cocciolo M, Riva C, Martinez E, Prisco A, Pirola M, Bratina G. Abnormalities of Doppler waveform of the hepatic veins in patients with chronic liver disease: correlation with histologic findings. AJR Am J Roentgenol. 1994;162:833–837. doi: 10.2214/ajr.162.4.8141001. [DOI] [PubMed] [Google Scholar]
- 6.Arda K, Ofelli M, Calikoglu U, Olçer T, Cumhur T. Hepatic vein Doppler waveform changes in early stage (Child-Pugh A) chronic parenchymal liver disease. J Clin Ultrasound. 1997;25:15–19. doi: 10.1002/(sici)1097-0096(199701)25:1<15::aid-jcu3>3.0.co;2-n. [DOI] [PubMed] [Google Scholar]
- 7.Pugh RN, Murray-Lyon IM, Dawson JL, Pietroni MC, Williams R. Transection of the oesophagus for bleeding oesophageal varices. Br J Surg. 1973;60:646–649. doi: 10.1002/bjs.1800600817. [DOI] [PubMed] [Google Scholar]
- 8.Matsutani S, Kimura K, Ohto M, Okuda K. Ultrasonography in the diagnosis of portal hypertension. In: Okuda K, Benhamou JP, editors. Portal hypertension: Clinical and physiological aspects. Tokyo: Springer; 1987. pp. 197–206. [Google Scholar]
- 9.Abu-Yousef MM. Normal and respiratory variations of the hepatic and portal venous duplex Doppler waveforms with simultaneous electrocardiographic correlation. J Ultrasound Med. 1992;11:263–268. doi: 10.7863/jum.1992.11.6.263. [DOI] [PubMed] [Google Scholar]
- 10.Shapiro RS, Winsberg F, Maldjian C, Stancato-Pasik A. Variability of hepatic vein Doppler tracings in normal subjects. J Ultrasound Med. 1993;12:701–703. doi: 10.7863/jum.1993.12.12.701. [DOI] [PubMed] [Google Scholar]
- 11.Torres WE, Whitmire LF, Gedgaudas-McClees K, Bernardino ME. Computed tomography of hepatic morphologic changes in cirrhosis of the liver. J Comput Assist Tomogr. 1986;10:47–50. doi: 10.1097/00004728-198601000-00009. [DOI] [PubMed] [Google Scholar]
- 12.Okuda K. Anatomy of the liver. In: Okuda K, Mitchell DG, Itai Y, Ariyama J, editors. Hepatobiliary diseases: Pathophysiology and Imaging. Oxford: Blackwell Science; 2001. pp. 41–62. [Google Scholar]
- 13.Ohnishi K, Chin N, Saito M, Tanaka H, Terabayashi H, Nakayama T, Iida S, Nomura F, Okuda K. Portographic opacification of hepatic veins and (anomalous) anastomoses between the portal and hepatic veins in cirrhosis--indication of extensive intrahepatic shunts. Am J Gastroenterol. 1986;81:975–978. [PubMed] [Google Scholar]
- 14.Johnson G Jr, Dart CH Jr, Peters RM, Macfie JA. Hemodynamic changes with cirrhosis of the liver: control of arteriovenous shunts during operation for esophageal varices. Ann Surg. 1966;163:692–703. doi: 10.1097/00000658-196605000-00006. [DOI] [PMC free article] [PubMed] [Google Scholar]
- 15.Hiraki T, Kanazawa S, Mimura H, Yasui K, Tanaka A, Dendo S, Yoshimura K, Hiraki Y. Altered hepatic hemodynamics caused by temporary occlusion of the right hepatic vein: evaluation with Doppler US in 14 patients. Radiology. 2001;220:357–364. doi: 10.1148/radiology.220.2.r01au15357. [DOI] [PubMed] [Google Scholar]
- 16.Zoli M, Magalotti D, Bianchi G, Ghigi G, Orlandini C, Grimaldi M, Marchesini G, Pisi E. Functional hepatic flow and Doppler-assessed total hepatic flow in control subjects and in patients with cirrhosis. J Hepatol. 1995;23:129–134. doi: 10.1016/0168-8278(95)80326-2. [DOI] [PubMed] [Google Scholar]
- 17.Albrecht T, Blomley MJ, Cosgrove DO, Taylor-Robinson SD, Jayaram V, Eckersley R, Urbank A, Butler-Barnes J, Patel N. Non-invasive diagnosis of hepatic cirrhosis by transit-time analysis of an ultrasound contrast agent. Lancet. 1999;353:1579–1583. doi: 10.1016/S0140-6736(98)06373-9. [DOI] [PubMed] [Google Scholar]
- 18.Sugimoto H, Kaneko T, Hirota M, Tezel E, Nakao A. Earlier hepatic vein transit-time measured by contrast ultrasonography reflects intrahepatic hemodynamic changes accompanying cirrhosis. J Hepatol. 2002;37:578–583. doi: 10.1016/s0168-8278(02)00264-7. [DOI] [PubMed] [Google Scholar]


