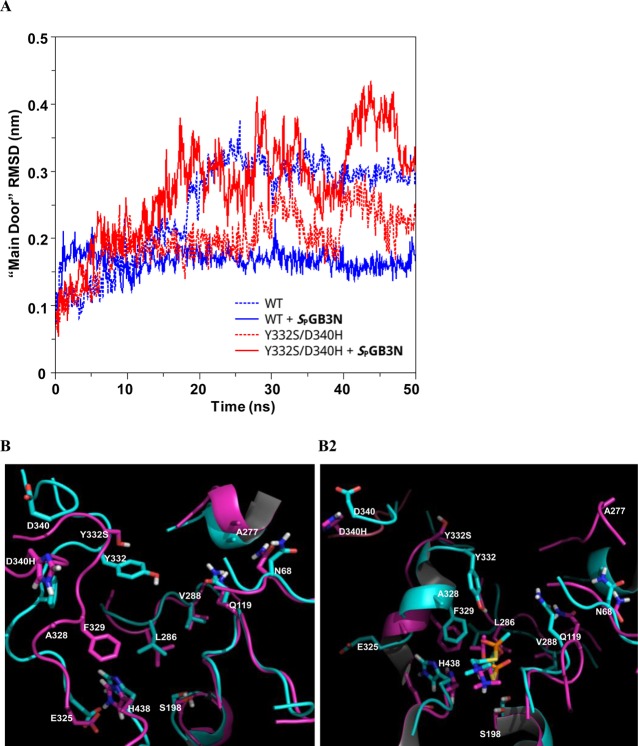
Figure 5.
(A) Plot of rmsd vs time of the “main door” backbone atoms (C, CA, and N) from the starting structure as a function of time for MD simulations of WT hBChE (blue) and the Y332S/D340H hBChE variant (red) in the presence (solid lines) or absence (dotted lines) of SPGB3N bound to the active site. (B) Overlay of structural models of noncomplexed WT, Y332S, and D340H hBChE (B1) and SPGB3N-complexed WT, Y332S, and D340H hBChE (B2) from MD simulations. For panels B1 and B2, side chains and secondary structure in the protein are colored cyan (WT) or pink (Y332S/D340H). Non-carbon atoms are colored blue (nitrogen), red (oxygen), yellow (sulfur), or white (polar hydrogens) in the depictions. (B1) Structural model of the atom alignment of WT and Y332S/D340H hBChE in the absence of SPGB3N after MD simulation for 50 ns. (B2) Structural model of atom alignment of WT and Y332S/D340H hBChE in the presence of SPGB3N after MD simulation for 50 ns. The SPGB3N in the WT complex is colored cyan, and the SPGB3N in the Y332S/D340H complex is colored pink.

