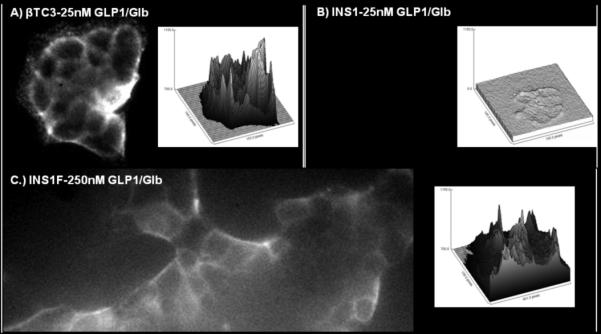
Figure 2.

Binding of Cy5-GLP-1/Glb 9 to βTC3 A) and INS-1F cells B & C). Cells were incubated with 25 nm ligand for 1 min then washed with images acquired 2 min following the wash. Surface plots to the right of each image show fluorescence intensity (y-axis) at each pixel within the image. At 25 nm ligand, fluorescence is high on the βTC3 cells A) but low for the INS-1F B), while at 250 nm ligand binding to the INS-1F cells is greatly increased C). Since the INS-1F cells only express the SUR1, the observation of binding only at 250 nm indicates that both receptors are required to bind significant ligand at lower concentrations; i.e., 25 nm.
