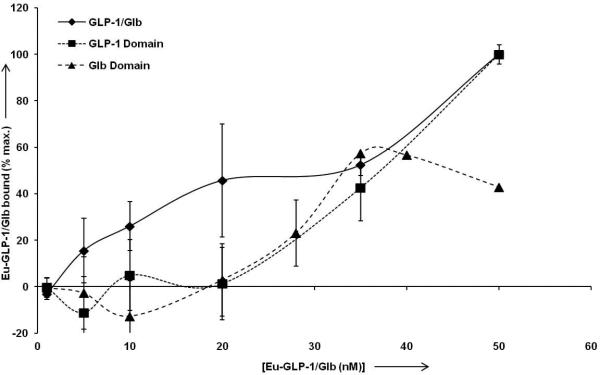
Figure 6.

High affinity binding of Eu-GLP-1/Glb 10. For normalization of data between experiments, and for optimal display of ‘high affinity’ binding, the data are normalized to the signal observed at 50 nm Eu-labelled ligand for each individual experiment. Analysis of the Eu-GLP-1/Glb 10 (diamonds) curve between 0.1 and 35 nm indicates high affinity binding with a Kd = 10.0 nm (+/− 1.4 nm, R2= 0.97). Competition with unlabelled 300 nm Glb blocks high affinity binding (below 35 nm, solid triangles), and thereby provides analysis of the GLP-1 binding domain within the Eu-GLP-1/Glb 10. Curve fitting indicates a Kd =57.1 nm (+/− 2.5 nm, R2= 0.998) for the GLP-1. Conversely, incubation with unlabeled GLP-1 provides analysis of the Glb domain within the Eu-GLP-1/Glb10 which is estimated to bind with a Kd = 30.5 nm (+/− 3.8 nm, R2 = .83).
