Abstract
Objective
This study presents inter-subject models of scalp-recorded electroencephalographic (sEEG) event-related potentials (ERPs) using intracranially recorded ERPs from electrocorticography and stereotactic depth electrodes in the hippocampus, generally termed as intracranial EEG (iEEG).
Approach
The participants were six patients with medically-intractable epilepsy that underwent temporary placement of intracranial electrode arrays to localize seizure foci. Participants performed one experimental session using a brain-computer interface (BCI) matrix spelling paradigm controlled by sEEG prior to the iEEG electrode implantation, and one or more identical sessions controlled by iEEG after implantation. All participants were able to achieve excellent spelling accuracy using sEEG, four of the participants achieved roughly equivalent performance in the iEEG sessions, and all participants were significantly above chance accuracy for the iEEG sessions. The sERPs were modeled using a linear combination of iERPs using two different optimization criteria.
Main Results
The results indicate that sERPs can be accurately estimated from the iERPs for the patients that exhibited stable ERPs over the respective sessions, and that the transformed iERPs can be accurately classified with an sERP-derived classifier.
Significance
The resulting models provide a new empirical representation of the formation and distribution of sERPs from underlying composite iERPs. These new insights provide a better understanding of ERP relationships and can potentially lead to the development of more robust signal processing methods for noninvasive EEG applications.
1. Introduction
A brain-computer interface (BCI) is a system that allows individuals with severe neuromuscular disorders to communicate and control devices using their brain waves [1, 2]. BCIs based on scalp-recorded electroencephalography (sEEG) have recently been demonstrated to provide a practical, long-term communication channel to severely disabled users [3, 4]. These BCIs employ the Matrix Speller [5], which elicits event-related potentials (ERPs) to flashing symbols. Because sEEG recording is noninvasive, it has been studied extensively in humans and its characteristics and capabilities for a BCI are well-established. ERPs have also been observed using intracranial electrodes on the cortex (i.e., electrocorticography(ECoG)) [6, 7] and in the hippocampus [8, 9, 10], termed here as intracranial EEG (iEEG). iEEG has also recently been demonstrated to be viable for controlling a BCI using ERPs [6, 7, 10, 11, 12, 13].
Because iEEG electrodes are closer to the source of the desired brain activity, these recordings have superior signal-to-noise ratio, and spatial and spectral characteristics compared to equivalent proximal sEEG recordings [14, 15, 16, 17, 18, 19]. While sEEG responses are well-characterized and understood, many equivalent iEEG responses have not yet been thoroughly characterized in terms of the new information offered by intracranial recording’s increased spatial resolution and bandwidth. In addition, while theoretical models relating iEEG and sEEG have been developed [20, 21, 22], empirical models have yet to be explored.
It has been proposed that future advances in BCI methods need to stem from a better understanding of the underlying neuroscience and neurophysiology [23]. While iEEG BCIs based on ERPs are likely not practical compared to other iEEG approaches [24], gaining a better understanding of the relationship between sEEG and iEEG can potentially lead to the development of more robust signal processing techniques for future noninvasive applications.
Since the tissue in the human head acts as a volume conductor for the brain’s electrical activity [25], it is conceivable that sEEG can be mathematically modeled as a mixture of underlying intracranial signals [26]. Since there are several major issues with simultaneous recording of sEEG and iEEG in temporarily implanted humans, such as the corruptive effects of the incision and implantation trauma on simultaneously monitored sEEG, the proposed approach relates sEEG data recorded pre-intracranial electrode implantation to iEEG data recorded after implantation. Because both sEEG- and iEEG-ERPs are represented using time-domain ensemble averages, their respective spatial and temporal characteristics are presumed to be well-defined and consistent. This can be confirmed by using BCI performance in the respective sessions as a metric. Thus, the resulting characteristic responses defined by ensemble averaging are used to create the models relating the sEEG and iEEG ERPs, herein referred to as sERPs and iERPs, respectively.
2. Materials and Methods
2.1. Patient Information
Data were collected from six patients with medically intractable epilepsy who underwent phase 2 evaluation for epilepsy surgery with temporary placement of intracranial grid or strip electrode arrays and/or depth electrodes to localize seizure foci prior to surgical resection. All six patients were presented at Mayo Clinic Florida’s multidisciplinary Surgical Epilepsy Conference where the consensus clinical recommendation was for the participant to undergo invasive monitoring primarily to localize the epileptogenic zone. The study was approved by the institutional review boards of Mayo Clinic, University of North Florida, and Old Dominion University. All participants gave their informed consent.
2.2. Electrode Locations and Clinical Recordings
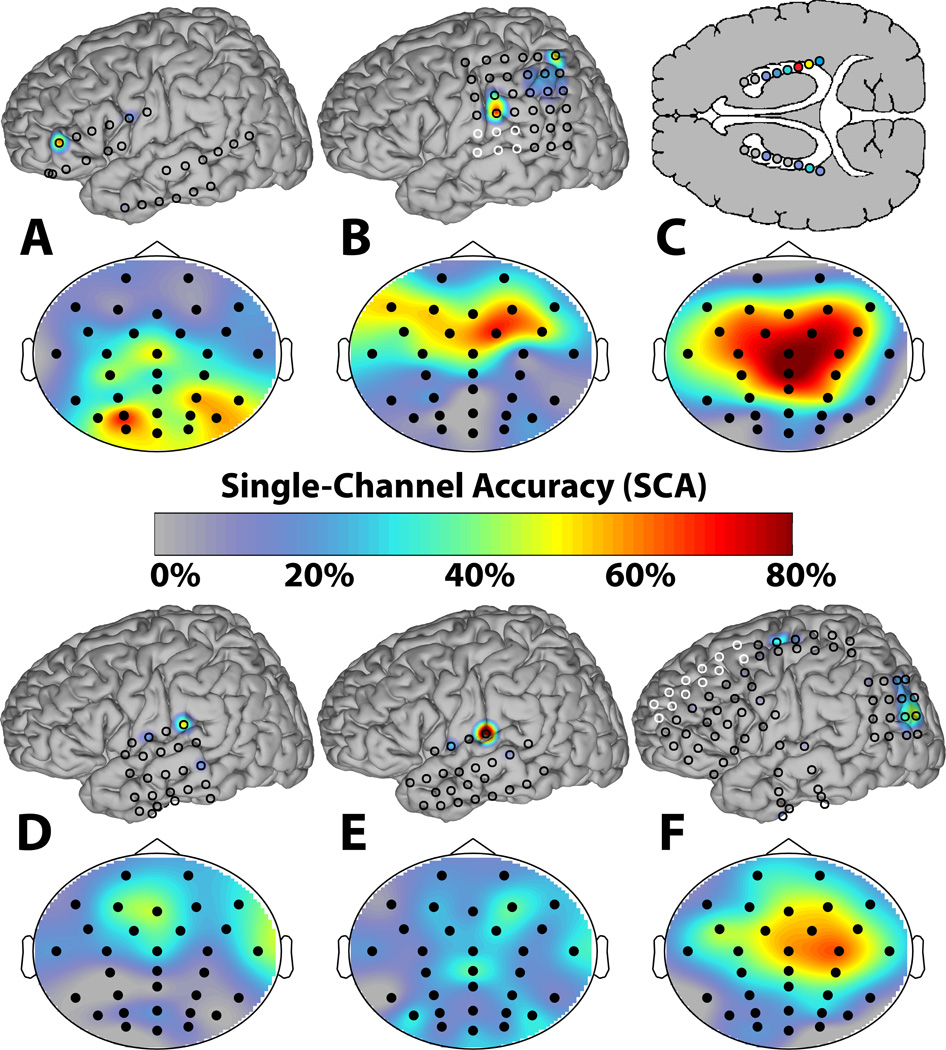
Electrode (AD-Tech Medical Instrument Corporation, Wisconsin) placements and duration of intracranial monitoring were based solely on the requirements of the clinical evaluation without any consideration of this study. All electrode placements were guided intraoperatively by Stealth MRI neuronavigational system (Medtronics, Inc, Minnesota). Each participant had postoperative anterior-posterior and lateral radiographs to verify electrode locations. After electrode implantation, all participants were admitted to an ICU room with epilepsy monitoring capability. Clinical recordings were gathered using 32- or 128-channel amplifiers. The intracranial electrode locations are illustrated in Figure 1.
Figure 1.
The iEEG and sEEG electrode locations and single channel accuracies (SCAs) for the six subjects (A–F). For each subject, the iEEG SCA topographies are plotted on generic brain models on the top with the electrode locations indicated by the circles. The black circles represent the electrodes that were used for the BCI recordings and modeling, whereas the white electrodes were only used for the clinical recordings and not represented in the models. The sEEG SCA topographies are on the bottom with the black dots representing the fixed 32-channel electrode positions according to the International 10–20 system [27]. Note that the iEEG figure for Subject C represents hippocampal depth electrodes through an axial cross-section, which are not illustrated as a contour plot. The SCAs were determined by using the ERP amplitude features from a single channel to derive the respective channel’s classifier based on [13].
2.3. BCI Data Acquisition
Prior to electrode implantation, the participants performed a single BCI session using sEEG. The sEEG was recorded using an ElectroCap International cap with 32 electrodes distributed over the scalp, based on the International 10–20 system [27] (see Figure 1). All sEEG electrodes were referenced to the right mastoid and amplified, bandpass filtered from 0.5–500 Hz, and digitized at 1200 Hz using two 16-channel g.USB amplifiers (Guger Medical Technologies, Austria). The high sampling rate was selected to be consistent with the intracranial data collection. Stimuli were presented and sEEG data were recorded using BCI2000, a general-purpose BCI system [28].
Subsequently, the patients performed one or more BCI sessions using iEEG. All testing was performed at least 24 hours after electrode implantation and at least six hours after a clinical seizure. Additionally, testing was performed only when the patient was clinically judged to be at cognitive baseline and free of physical discomfort that would affect attention and concentration. All iEEG electrodes were referenced to a scalp vertex electrode and recorded using the identical hardware (with two additional 16-channel g.USB amplifiers), software, and protocols as the sEEG data collection. The signals for the BCI experiments were acquired concurrent with the clinical monitoring via two 32-channel signal splitter units (AD-Tech Medical Instrument Corporation, Wisconsin). All common-referenced electrodes are herein referred to as channels.
2.4. Task, Procedure, and Design
The experimental protocol was based on the protocol used in an sEEG Matrix Speller study [13], and was consistent for both the sEEG and iEEG sessions. The patients sat in a comfortable chair (for sEEG sessions) or hospital bed (for iEEG sessions) approximately 75 cm from a video monitor and viewed a 6 × 6 matrix display of characters. The task was to focus attention on a specified character in the matrix and silently count the number of times this target character flashed, until a new character was specified for selection. All data was collected in the copy speller mode: words were presented on the top left of the video monitor and the character currently specified for selection was listed in parentheses at the end of the character string. Each session consisted of 8–11 experimental runs of the Matrix Speller paradigm; each run was composed of a word or series of characters chosen by the investigator. This set of characters spanned the set of characters contained in the matrix and was consistent for each session. Each session consisted of between 32–39 character epochs. A single session lasted approximately one hour.
2.5. Native Performance Analysis
Data from the pre-surgery sEEG sesson and the first uncorrupted iEEG session (e.g., patient was attentive, no hospital distractions, etc.) were analyzed. To assess the quality of the data for each session, the offline Matrix Speller accuracy was determined based on an optimal linear classifier for each subject. The classifiers were trained via stepwise discriminant analysis using first four runs from each session and tested using the subsequent four runs of the same session (refer to [13] for details regarding ERP classification). The native sEEG and iEEG accuracies after 15 flash sequences are reported in columns 2 and 3 of Table 1, respectively. All participants attained above 80% accuracy for the sEEG sessions and four participants attained above 80% for the iEEG sessions, which indicates that there are consistent ERPs for these respective sessions. Although two subjects attained relatively low accuracies for the iEEG sessions, the accuracies are still several standard deviations above chance accuracy according to a binomial distribution for 32 typed characters (i.e., independent Bernoulli trials) with a mean of 3%. Therefore, there is useful information in these sessions, albeit to a lesser extent. Note that this low iEEG performance can be attributed to some combination of suboptimal electrode positions, environment, physical and mental state, etc. Figure 1 shows the topographic single-channel accuracies obtained from the iERPs and sERPs, respectively, using the same classification procedure cited above with only features from a single channel used to derive the respective channel’s classifier [13]. This gives an indication of the relative importance of each channel for discriminating the ERPs.
Table 1. BCI Performance.
The second column indicates the number of iEEG channels selected for modeling with the total number iEEG channels recorded in parentheses (the number of sEEG channels is fixed at 32 for all subjects). The third and fourth columns give the results for the optimal linear classifier derived from the sEEG and iEEG data, respectively. The fifth and sixth columns give the results of the two proposed modeling schemes using the transformed iEEG as an input to an sEEG-derived classifier.
| Subject | # iEEG Electrodes | sEEG (%) | iEEG (%) | Performance(%) | Direct(%) |
|---|---|---|---|---|---|
| A | 2(26) | 100 | 25 | 19 | 19 |
| B | 5(32) | 93 | 100 | 100 | 38 |
| C | 4(16) | 100 | 100 | 100 | 50 |
| D | 3(30) | 100 | 44 | 25 | 19 |
| E | 2(26) | 88 | 81 | 63 | 63 |
| F | 9(64) | 100 | 88 | 81 | 32 |
Note that chance accuracy for the paradigm is 3%.
2.6. Modeling Approaches
2.6.1. Direct Modeling
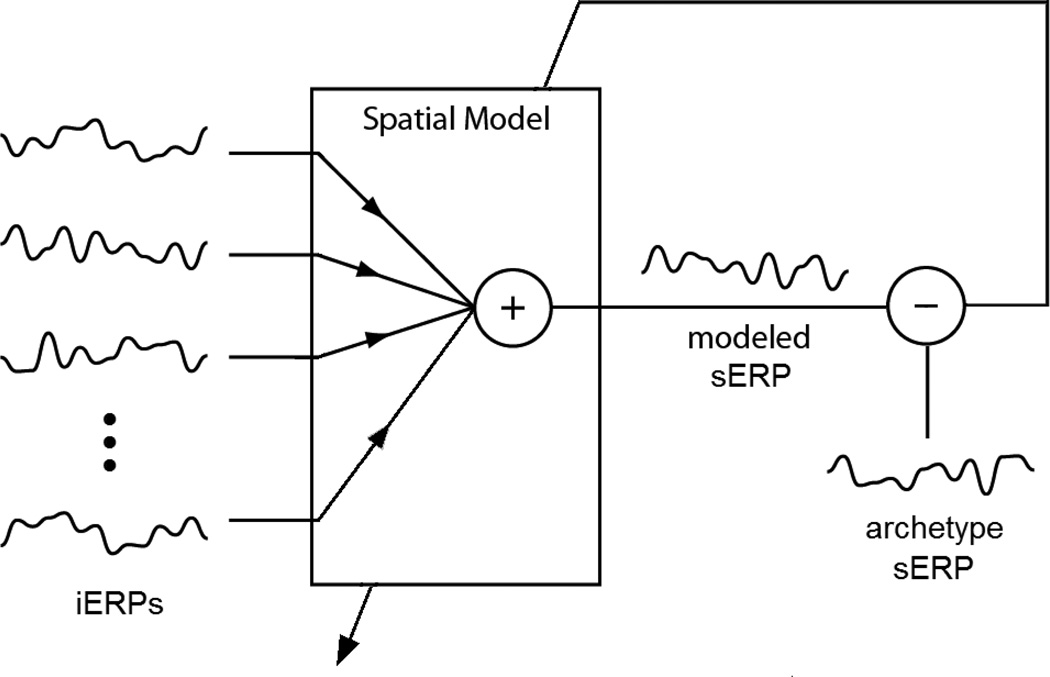
Direct modeling represents the initial approach to directly model the sERPs using a linear combination of the iERPs via ordinary least-squares regression. This equates to modeling each sERP as an instantaneous spatial model of iERPs as shown in Figure 2. The models were constructed exclusively using the target stimulus ERPs (resulting from a flash that the subject was instructed to attend) because they represent consistent, stimulus-locked neural activity, as opposed to the non-target stimulus data that primarily consist of spurious background brain activity. All data were lowpass filtered to 20Hz and decimated to 240Hz, to smooth the data while retaining sufficient samples for modeling and ERP visualization. For each sEEG and iEEG channel, 800-ms segments of data following each flash were extracted as the ERPs. The archetype sERP for each channel was formed by averaging all target sERPs for the session. The first half of the target iERPs (480 ERPs) were averaged for each channel and used in an ordinary least-square linear regression model to model each archetype sERP. It was determined that certain iERP channels primarily contained noise, so channels with a single-channel accuracy (defined in Section 2.5) less than an empirically-optimized threshold between 6–19% were excluded from the model. The individual thresholds were selected and validated using the training data, independent of the test data. This was found to significantly increase the modeling accuracy. The numbers of iEEG electrodes including in the models is provided in Table 1. The second half of the iERPs were used to validate the models as described in Section 2.7.
Figure 2.
Direct modeling block diagram. A linear combination of the iERPs are used to model each sERP independently using ordinary least-squares regression.
2.6.2. Performance-based Modeling
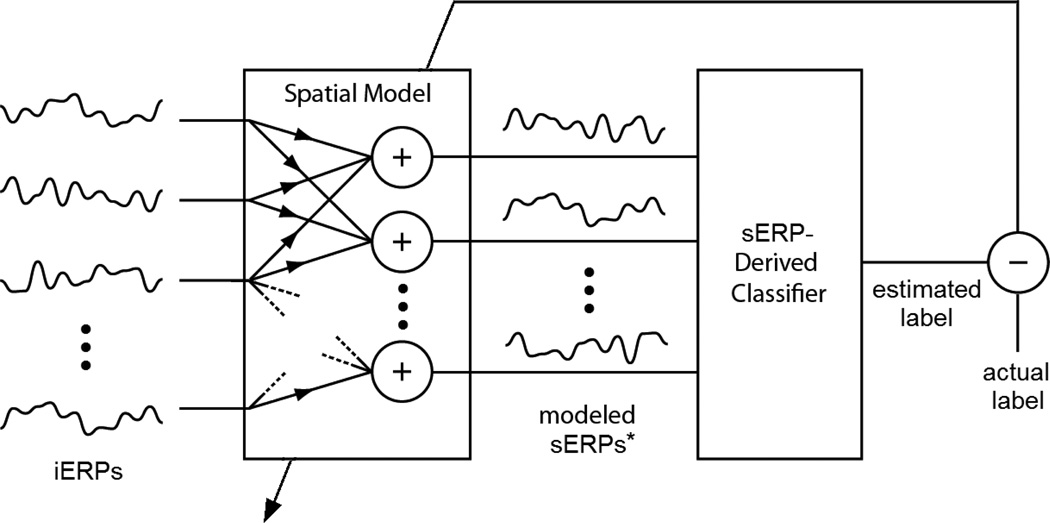
One limitation of the direct modeling approach is that the resulting models do not account for BCI performance. Because the iEEG-to-sEEG spatial model and sERP-derived linear classifier are merely cascaded linear transformations of the data, the spatial models can be directly optimized using BCI performance criterion (e.g., the classifier output).
All data were lowpass filtered and decimated to 20Hz according to the standards established for classification in [13]. For each sEEG and iEEG channel, 800-ms segments of data following each flash were extracted as the ERPs. An optimal Stepwise Linear Discriminant Analysis (SWLDA) classifier was trained using all target and nontarget sERPs from the session.
In this case, the ordinary least-squares regression equations for the cascaded linear system (i.e., the spatial model and sERP-derived classifier) is derived as follows:
| (1) |
where x is the feature vector corresponding to one flash stimulus. This feature vector is comprised of the concatenated spatial and temporal amplitude features of the ERP corresponding to the flash. b is a vector of feature weights and y is the instantaneous classifier output. In this case, x represents the modeled sERPs and b is the vector of predetermined sEEG-derived classifier weights. By representing each iERP observation as a matrix Z with dimensions [channels × time], x can be represented as:
| (2) |
where Ẑ is a matrix with dimensions of [sEEG features × iEEG features] created by repeating Z along the diagonal axis with all other elements set to zero. k represents the spatial modeling weights for the concatenation of all channels. Equation 1 now becomes:
| (3) |
Substituting R for bT Ẑ, k can be determined using ordinary least-squares regression:
| (4) |
This is conceptually depicted in Figure 3. As with the direct modeling approach, the first half of the iERPs (target and nontarget) were used to derive the spatial model using stepwise regression, which yielded better performance that ordinary least-squares regression. The second half of the iERPs were again used to validate the models as described in Section 2.7.
Figure 3.
Performance-based modeling block diagram. The optimal spatial model is determined by minimizing the output error of the classifier. An ordinary least-squares regression is used to solve for the spatial weights in the linear system created by the cascade of the spatial model with the fixed sERP-derived linear classifier. *This is a conceptual representation and the modeled sERPs may not be explicit representations of the archetype sERPs. However, the resulting spatial model structure is equivalent that of the direct modeling.
2.7. Model Validation
The two modeling approaches presented use distinct optimization criteria, so it is appropriate to validate and compare them using different performance metrics. To evaluate the archetype sERP reproduction ability of the direct models, the root mean-squared error (RMSE) was used. The spatial models for each approach were derived using the first half of the iERPs. The second half of the iERPs were used to validate the sERP model for each channel by computing the RMSE between the modeled sERP and the archetype sERP. First, each archetype sERP was scaled to have unit variance. The same scale factor was applied to the respective modeled sERP. This was done to remove any amplitude dependencies when comparing RMSE across channels. The RMSE was not evaluated for the performance-based models for several reasons. Firstly, since all of the sEEG channels were not included in the sEEG-derived classifier due to the step-wise selection procedure, contrary to the direct models, not all sEEG channels were represented in the performance-based models. Moreover, the performance-based models are optimized using a specific spatio-temporal combination of decimated amplitude features. The resulting performance-based models will tend to model these specific features rather than the full ERP waveforms. Thus, it is not very informative to evaluate the RMSE between the modeled and archetype sERPs for the performance-based models.
Since the ultimate objective is to gain a better understanding of these signals to improve BCI performance, the classification performance of both spatial modeling approaches was evaluated offline using the optimal sEEG-derived classifier for each subject (derived from the actual sERPs not the modeled sERPs). The spatial models for each approach were derived using the first half of the iERPs. The resulting classifier performance was computed using the second half of the iERPs. While the classifier output is equivalent to a score for each ERP, this can be ultimately represented as the percentage of correctly classified characters [13].
3. Results
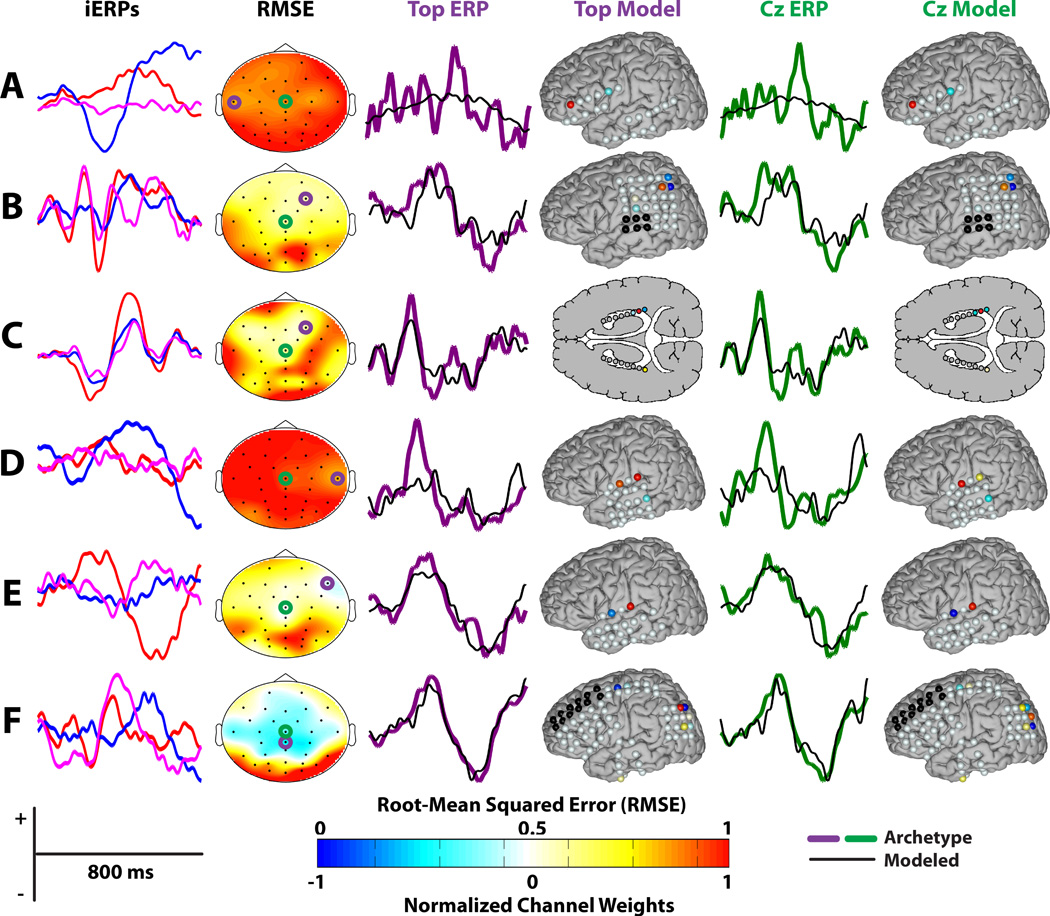
The classification performance of the two modeling approaches using the sEEG-derived classifier is provided in Table 1. Selected ERPs and spatial filters from the direct models are shown in Figure 4. The first column shows the three iERPs for each subject corresponding to the channels with the highest SCA. The second column shows the RMSE topographies. The third and fourth columns show the modeled ERPs and the corresponding spatial models, respectively, for the channel with the lowest RMSE. The fifth and sixth columns are the same as the third and fourth columns for channel Cz. Channel Cz was selected because it is generally considered as the most prominent location of the P300 response.
Figure 4.
ERPs and spatial models for direct modeling. The first column shows the three iERPs for each subject (A–F) corresponding to the channels with the highest SCA, with red representing the highest SCA and blue representing the second highest SCA. The second column shows the RMSE topographies with the channel corresponding to the lowest RMSE circled in purple and channel Cz circuled in green. The third and fourth column show the modeled ERPs and the corresponding spatial models, respectively, for the channel with the lowest RMSE (i.e. the Top ERP and Model). The fifth and sixth columns are the same as the third and fourth columns for channel Cz. The channel weights for the spatial models were normalized to have a maximum magnitude of 1.
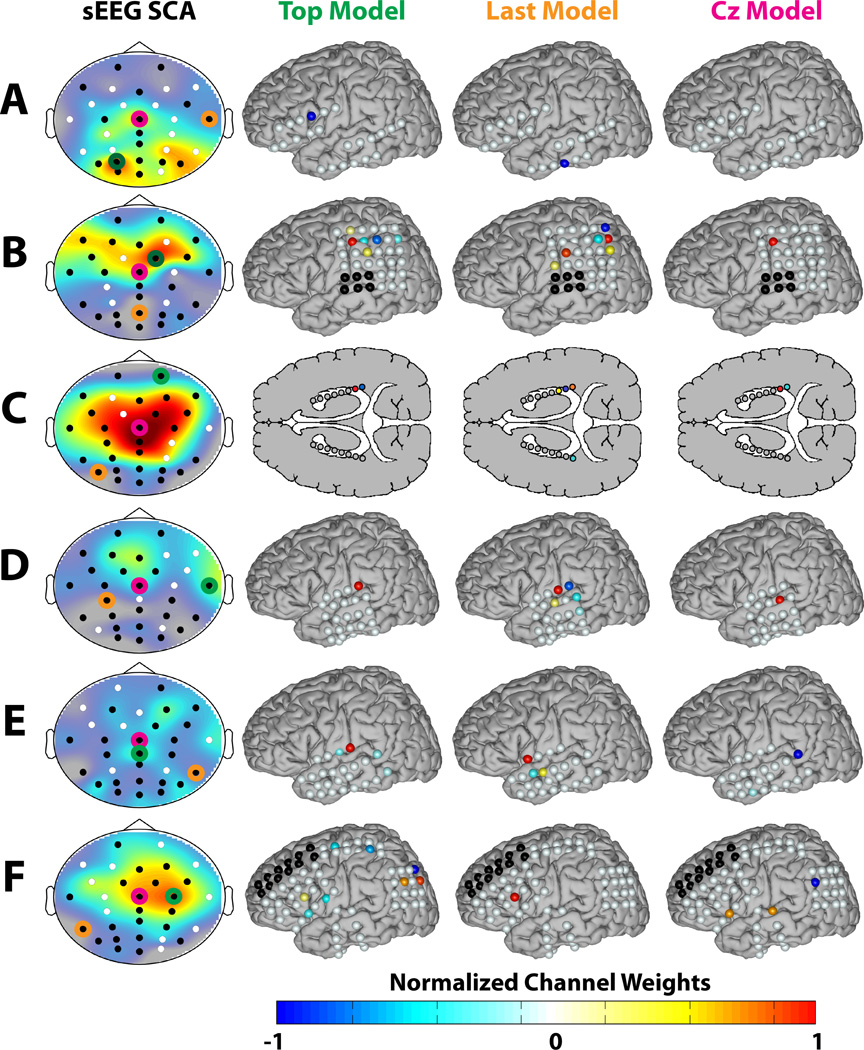
Selected spatial filters from the performance-based models are shown in Figure 5.The first column shows the sEEG SCAs for each subject and also indicates the channels that were included in the sEEG-derived classifier. The second column shows the spatial filter corresponding to the channel that was included in the sEEG-derived classifier having the highest SCA. The third column shows the spatial filter corresponding to the channel that was included in the sEEG-derived classifier having the lowest SCA. This model is included to illustrate how the iEEG contributes to sEEG channels that do not appear to contain much discriminative information in isolation (i.e., low SCA), but can benefit the classifier in conjunction with other channels. The fourth column shows the spatial filter corresponding to Cz for reference. The waveforms for the performance-based analysis are not visualized because the weights are derived based on spatio-temporal combinations of temporally-decimated amplitude features. Therefore, visually reconstructing the undecimated temporal waveforms from the performance-based weights is not very meaningful or interpretable.
Figure 5.
Spatial models for performance-based modeling. The first column shows the sEEG SCAs for each subject (A–F). This is is a replication of Figure 1 with the channels that were included in the sEEG-derived classifier represented by black dots and the excluded channels as white dots. Additionally, the channel that was included in the sEEG-derived classifier having the highest SCA is circled in green (i.e., the Top Model), the channel that was included in the sEEG-derived classifier having the lowest SCA is circled in orange (i.e., the Last Model), and Cz is circled in magenta. The second through fourth columns show the spatial filters corresponding to the Top Model, Last Model, and Cz, respectively. The Last Model is presented to illustrate how the iEEG contributes to sEEG channels that do not appear to contain much discriminative information in isolation (i.e., low SCA), but can benefit the classifier in conjunction with other channels.
4. Discussion
This study is the first to show that key information from scalp ERPs can be accurately modeled using intracranial ERPs that were recorded in separate sessions. This was validated by evaluating offline BCI performance on independent data. While the direct modeling approach can produce accurate representations of the archetype sERPs, this doesn’t necessarily translate to representations that maximize BCI performance. This is because the direct models minimize the modeling error of the ERP waveforms in their entirety. However, most practical BCI-ERP classifiers only use a specific combination of spatio-temporal features. Thus, from a BCI performance standpoint, the direct models are likely adversely affected by the irrelevant spatio-temporal features. In contrast, the performance-based models are designed to only account for the features that are relevant to classification. This is evinced by superior offline BCI performance shown in Table 1. However, the performance-based spatial models are not as clearly interpreted because the resulting spatial weights may only model a few specific time instances of the response and likely represent more complex spatio-temporal interactions than the direct models.
Consistent with [7, 12], the results suggest that iEEG electrode locations are crucial for BCI performance and, in this context, modeling. From Table 1, the BCI performance obtained by the modeling is clearly limited by the native iEEG BCI performance. The performance disparity between sEEG and iEEG for Subjects A and D can be explained by suboptimal iEEG electrode locations for capturing the desired ERPs, and possibly the patient’s physical/mental state in the hospital room during the iEEG session. Nevertheless, the performance-based modeling results for the other 4 of the 6 subjects was even comparable or equivalent to the native sEEG and iEEG performance, indicating that specific sERP and iERP features are closely related and the models accurately capture these relationships. It should also be noted that the direct models also provide a BCI performance that is much greater than chance, indicating that they also capture key feature relationships, albeit to a lesser extent.
The spatial filter weights shown in Figures 4 and 5 indicate that relatively few iEEG channels contribute to the estimated waveforms, which is expected from the iEEG SCAs shown in Figure 1. These weights also tend to occur in small spatially-localized groups or in more distant bi-polar pairs. This localized activity suggests that inverse spatial models may be effective for estimating the cortical/hippocampal activations, which can potentially lead to improved sEEG-BCI performance. Work on the inverse models associated with the direct and performance-based models, and their application to sEEG-BCI, is ongoing.
Only Subjects A and F had significant parietal-lobe overlap, which is a key region for the P300 response. As seen in Figure 4, the weights for these subjects are concentrated over the dorsal region of the parietal lobe. The modeling performance for these subjects was very high using both metrics. Subject C was the only subject with bilateral hippocampal depth electrodes. It is well known that there are P300 generators in the hippocampus [8, 9] and this subject also exhibited high modeling performance for both metrics. The spatial weights for both models were again concentrated around the right posterior region of the hippocampus. The modeling performance was also high for Subject E, with an unexpected localization in the temporal region. Subject D exhibited similar SCA and modeling localizations, but achieved comparatively poor modeling performance, as did Subject A. It should be noted that the Matrix Speller can evoke different ERP components and spatial distributions compared to the P300 generated by a classical oddball task, including frontal and occipital features [13, 6]. Therefore, while the Speller Matrix can generate ERPs related to the classical P300, the results should not solely be interpreted in the context of the classical P300 response.
Interestingly, the key electrodes for modeling are not always positioned directly under or even spatially adjacent to the respective sEEG electrodes. This indicates that the responses may be coming from more localized cortical sources and spreading over the scalp via volume conduction. Since the classical P300 response is generally observed centrally (near Cz) in sEEG, it is expected that both hemispheres are contributing to related sEEG responses. However, this cannot be easily validated without more complete iEEG coverage. Future work is needed to apply joint source localization techniques to the iEEG and sEEG responses. Also, from the the performance-based modeling results, it is clear that distinct combinations of spatio-temporal features contain the key discriminative information for BCI applications. Thus, statistical models will be developed to better understand the spatio-temporal characteristics of the responses.
Acknowledgments
This work was funded in part by the National Science Foundation (1064912), the National Institutes of Health (NIBIB/NINDS EB00856), and a Mayo Clinic Foundation CR20 Grant.
References
- 1.Wolpaw JR, Birbaumer N, McFarland DJ, Pfurtscheller G, Vaughan TM. Clinical neurophysiology. 2002;113:767–791. doi: 10.1016/s1388-2457(02)00057-3. [DOI] [PubMed] [Google Scholar]
- 2.Shih JJ, Krusienski DJ, Wolpaw JR. Mayo Clin Proc. 2012;87:268–279. doi: 10.1016/j.mayocp.2011.12.008. [DOI] [PMC free article] [PubMed] [Google Scholar]
- 3.Sellers EW, Vaughan TM, Wolpaw JR. Amyotrophic lateral sclerosis. 2010;11:449–455. doi: 10.3109/17482961003777470. [DOI] [PubMed] [Google Scholar]
- 4.Vaughan TM, McFarland DJ, Schalk G, Sarnacki WA, Krusienski DJ, Sellers EW, Wolpaw JR. Neural Systems and Rehabilitation Engineering, IEEE Transactions on. 2006;14:229–233. doi: 10.1109/TNSRE.2006.875577. [DOI] [PubMed] [Google Scholar]
- 5.Farwell LA, Donchin E. Electroencephalography and clinical Neurophysiology. 1988;70:510–523. doi: 10.1016/0013-4694(88)90149-6. [DOI] [PubMed] [Google Scholar]
- 6.Krusienski DJ, Shih JJ. Neurorehabilitation and neural repair. 2011;25:323–331. doi: 10.1177/1545968310382425. [DOI] [PMC free article] [PubMed] [Google Scholar]
- 7.Speier W, Fried I, Pouratian N. Clin Neurophysiol. 2013;124:1321–1328. doi: 10.1016/j.clinph.2013.02.002. [DOI] [PMC free article] [PubMed] [Google Scholar]
- 8.Linden DE. The Neuroscientist. 2005;11:563–576. doi: 10.1177/1073858405280524. [DOI] [PubMed] [Google Scholar]
- 9.Ludowig E, Bien CG, Elger CE, Rosburg T. Hippocampus. 2010;20:186–195. doi: 10.1002/hipo.20603. [DOI] [PubMed] [Google Scholar]
- 10.Krusienski D, Shih J. Journal of neural engineering. 2011;8:025006. doi: 10.1088/1741-2560/8/2/025006. [DOI] [PMC free article] [PubMed] [Google Scholar]
- 11.Shih JJ, Krusienski DJ. Journal of neuroscience methods. 2012;203:311–314. doi: 10.1016/j.jneumeth.2011.10.012. [DOI] [PMC free article] [PubMed] [Google Scholar]
- 12.Brunner P, Ritaccio AL, Emrich JF, Bischof H, Schalk G. Frontiers in neuroscience. 2011;5 doi: 10.3389/fnins.2011.00005. [DOI] [PMC free article] [PubMed] [Google Scholar]
- 13.Krusienski DJ, Sellers EW, McFarland DJ, Vaughan TM, Wolpaw JR. Journal of neuroscience methods. 2008;167:15–21. doi: 10.1016/j.jneumeth.2007.07.017. [DOI] [PMC free article] [PubMed] [Google Scholar]
- 14.Boulton AA, Baker GB, Vanderwolf CH. Neurophysiological Techniques: Applications to neural systems. Humana Press; 1990. [Google Scholar]
- 15.Freeman WJ, Holmes MD, Burke BC, Vanhatalo S. Clinical Neurophysiology. 2003;114:1053–1068. doi: 10.1016/s1388-2457(03)00045-2. [DOI] [PubMed] [Google Scholar]
- 16.Srinivasan R, Nunez PL, Silberstein RB. Biomedical Engineering, IEEE Transactions on. 1998;45:814–826. doi: 10.1109/10.686789. [DOI] [PubMed] [Google Scholar]
- 17.Ikeda A, Shibasaki H. Journal of Clinical Neurophysiology. 1992;9:509–520. doi: 10.1097/00004691-199210000-00005. [DOI] [PubMed] [Google Scholar]
- 18.Levine SP, Huggins JE, BeMent SL, Kushwaha RK, Schuh LA, Passaro EA, Rohde MM, Ross DA. Journal of clinical neurophysiology. 1999;16:439. doi: 10.1097/00004691-199909000-00005. [DOI] [PubMed] [Google Scholar]
- 19.Levine SP, Huggins JE, BeMent SL, Kushwaha RK, Schuh LA, Rohde MM, Passaro EA, Ross DA, Elisevich KV, Smith BJ. Rehabilitation Engineering, IEEE Transactions on. 2000;8:180–185. doi: 10.1109/86.847809. [DOI] [PubMed] [Google Scholar]
- 20.Edlinger G, Wach P, Pfurtscheller G. Biomedical Engineering, IEEE Transactions on. 1998;45:736–745. doi: 10.1109/10.678608. [DOI] [PubMed] [Google Scholar]
- 21.Kramer MA, Szeri AJ. Biomedical Engineering, IEEE Transactions on. 2004;51:1358–1365. doi: 10.1109/TBME.2004.827264. [DOI] [PubMed] [Google Scholar]
- 22.Nunez PL. Electric fields of the brain: the neurophysics of EEG. Oxford University Press; 2006. [Google Scholar]
- 23.Krusienski DJ, Grosse-Wentrup M, Galán F, Coyle D, Miller KJ, Forney E, Anderson CW. J Neural Eng. 2011;8:025002–025002. doi: 10.1088/1741-2560/8/2/025002. [DOI] [PMC free article] [PubMed] [Google Scholar]
- 24.Schalk G, Leuthardt EC. Biomedical Engineering, IEEE Reviews in. 2011;4:140–153. doi: 10.1109/RBME.2011.2172408. [DOI] [PubMed] [Google Scholar]
- 25.Akhtari M, Bryant H, Mamelak A, Flynn E, Heller L, Shih J, Mandelkem M, Matlachov A, Ranken D, Best E, et al. Brain Topography. 2002;14:151–167. doi: 10.1023/a:1014590923185. [DOI] [PubMed] [Google Scholar]
- 26.Krusienski DJ, Shih JJ. A case study on the relation between electroencephalographic and electrocorticographic event-related potentials; Engineering in Medicine and Biology Society (EMBC), 2010 Annual International Conference of the IEEE (IEEE); 2010. pp. 6019–6022. [DOI] [PubMed] [Google Scholar]
- 27.Sharbrough F, Chatrian G, Lesser R, Lüders H, Nuwer M, Picton T. J. Clin. Neurophysiol. 1991;8:200–202. [Google Scholar]
- 28.Schalk G, McFarland DJ, Hinterberger T, Birbaumer N, Wolpaw JR. Biomedical Engineering, IEEE Transactions on. 2004;51:1034–1043. doi: 10.1109/TBME.2004.827072. [DOI] [PubMed] [Google Scholar]


