Introduction
Distraction osteogenesis (DO) is a technique for skeletal expansion that uses the body’s natural healing capacity to form bone in response to mechanical tension across an osteotomy.[1–8] The standard clinical DO protocol, for both the axial and craniofacial skeletons, consists of a distraction rate of 1 mm/day achieved by manually turning an activation screw 1 to 4 times daily.[4–7, 9, 10] Attempts at increasing the rate of intermittent distraction beyond 1mm/day have generally resulted in insufficient bone formation and/or non-union.[5, 6, 10–13] Consequently, the disadvantages of DO include long treatment times, poor patient compliance and the need for frequent clinic visits and radiographs to monitor the process.[14, 15]
An automated, continuous distraction device (United States Patent #8177789) has been developed and tested by our group in a minipig mandibular model (NIH SBIR grant #5R44DE014803-03A).[3, 16, 17] We have reported clinical and radiographic bone healing at distraction rates up to 4.5 mm/day at the inferior border using this device and model.[18] Healing of the continuous, curvilinear DO wound has not been studied and further understanding could provide insight into any differences in the quantity and quality of bone formation at different rates and rhythms.
During the active distraction phase, a network of hematoma and fibrous tissue develops followed by the appearance of nests of cartilage and finally bone. As the callus consolidates, there is progressive replacement of fibrous tissue, hematoma and cartilage with trabecular bone.[11, 12, 19–21] Periosteal bone formation dominates early during the distraction phase and is followed by endosteal bone formation during mid- to end-fixation.[19, 22–24] Although endochondral ossification has been shown to contribute, intramembranous ossification is the primary method of bone formation in the DO wound.[6, 10, 13, 20, 21, 25–27] Alternatively, Ilizarov hypothesized that bone formation in response to DO may be a unique form of bone formation with elements of both endochondral and membranous mechanisms.[6] Ultimately, osteogenesis terminates with the maturation of osteocytes integrated into mineralized, lamellar bone.[19]
DO of the mandible also effects the surrounding soft tissues such as the digastric muscles, which lie inferior to the body of the mandible along the vector of distraction in the model reported in this study. DO induces myocyte proliferation leading to increased muscle length and volume in the digastric muscles.[28–32] Contained beneath the basal lamina of myocytes, myogenic stem (satellite) cells lie in a quiescent state maintained by the protein, paired-Box-7-protein (PAX7).[33–35] These satellite cells are responsible for the production of postnatal muscle mass and orchestrate muscle repair.[36] With transient expression of myogenic-differentiation-1 (MyoD), PAX7 will be downregulated and satellite cells will be stimulated to proliferate and differentiate into matured myocytes.[37] In addition, proliferating-cell-nuclear-antigen (PCNA), a highly conserved nuclear protein that is synthesized in the early G1 phase of mitosis, is expressed in response to muscle lengthening. PCNA represents a marker of cellular proliferation.[38] The digastric muscle, lying along the vector of distraction, elongates in response to DO. Upon reaching a critical threshold of muscular elongation, sarcomeres (i.e. sarcomerogenesis) are serially added to the ends of individual muscle fibers through a tension-induced, negative feedback mechanism.[28] Each of the aforementioned proteins will be either upregulated or downregulated depending on the regenerative (active satellite muscle cells) or dormant (inactive satellite muscle cells) state of the muscular tissue.[32] At the termination of the DO fixation period, muscular expansion and expression is expected to return to the baseline.[32]
The standard distraction rhythm of 1 mm/day has been shown in sheep to produce an adaptive response in distracted muscle.[39] Discontinuous DO at 3 mm/day produced a maladaptive response in muscle fibers with severe inflammation and damaged sarcomeres.[39] Acute lengthening up to 10 mm in rabbits revealed cross-sectional rupturing of muscle fiber bundles even after 35 days of consolidation.[31] Continuous DO, however, may allow for adaptive soft tissue expansion at rates greater than the 1 mm/day.
The purpose of this study was to evaluate bone formation in a continuous, curvilinear DO wound at rates of 1.5 and 3.0 mm/day as compared to discontinuous DO at 1 mm/day. We hypothesized that: 1) automated, continuous DO at rates of 1.5 and 3 mm/day would yield equivalent percent surface area (PSA) occupied by bone compared to discontinuous DO at 1 mm/day and 2) anterior digastric muscle would not be adversely affected by increased continuous distraction rates. The specific aims were: 1) to assess the percent surface area (PSA) occupied by bone of the continuous DO wound at 1.5 mm/day and 3.0 mm/day compared to discontinuous DO at 1 mm/day and 2) to assess the effect of continuous DO on digastric muscle wound healing.
Materials and Methods
Animals
Ten female Yucatan minipigs (age 4–6 months, 25–35 kg) in the mixed-dentition stage were acclimated for 10–15 days, prior to distraction, to new housing, a jacket to hold the control box, and a pureed diet. The Yucatan minipig model was selected for the similarity of bone turnover rate, occlusion, and chewing patterns to humans.[40, 41] The care and use of the minipigs for this study met the requirements of the Accreditation of Laboratory Animal Care standards and was approved by the Massachusetts General Hospital Subcommittee on Research Animal Care (SRAC 2009N0000073). The authors have read and are in full compliance with the Declaration of Helsinki.
The Automated Device
The previously reported automated, continuous, curvilinear implanted distraction device, located on the minipig’s dorsum, is driven by a hydraulic motor within a digital control box with position feedback. [3, 17, 18] As the distractor extends, position is determined by a single-coil, variable-inductance sensor connected between the distractor segments. A spring-powered, hydraulic reservoir supplies 2.0 megapascals (MPa) (full spring extension) to 3.4 MPa (full spring compression) of pressurized water to a microdispensing solenoid valve. At 15 minute intervals, this digitally-controlled valve will open for a period of 100 microseconds to 10 milliseconds (depending on required motion) to deliver 25–40 Newtons of actuation force to the hydraulic piston opening the distractor according to the desired position along a curvilinear side-rail (5 cm radius of curvature).
Surgical Procedure
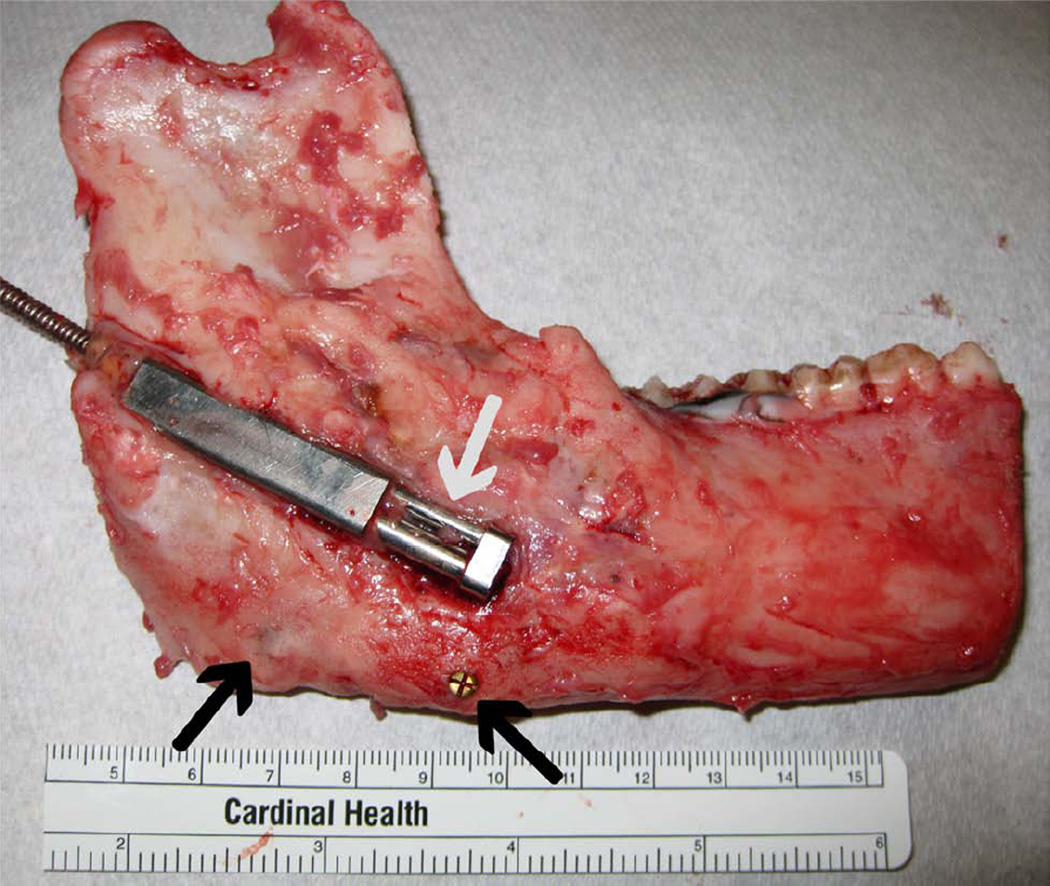
As previously reported[18], the minipigs were sedated with 4.4 mg/kg telazol and 2.2 mg/kg xylazine and administered 0.04 mg/kg atropine intramuscularly and then intubated orally. Through a submandibular incision, an osteotomy was created from the retromolar region superiorly to approximately 1 cm anterior to the gonial angle inferiorly. The distraction device was rigidly fixed across the osteotomy using biocortical screws (Dupuy Synthes, West Chester, PA, USA). Marker screws were placed on either side of the osteotomy at the inferior border for verification of the amount of distraction measured by the position sensor (Figure 1A). The hydraulic and sensor lines of the device were tunneled subcutaneously to the dorsum of the animal and connected to the control box. The device was activated to confirm function, reversed to baseline, and the distance between the marker screws was measured. Pigs were assessed at least twice per day for general appearance, activity level, weight and signs of infection throughout the distraction and consolidation period.
Figure 1.
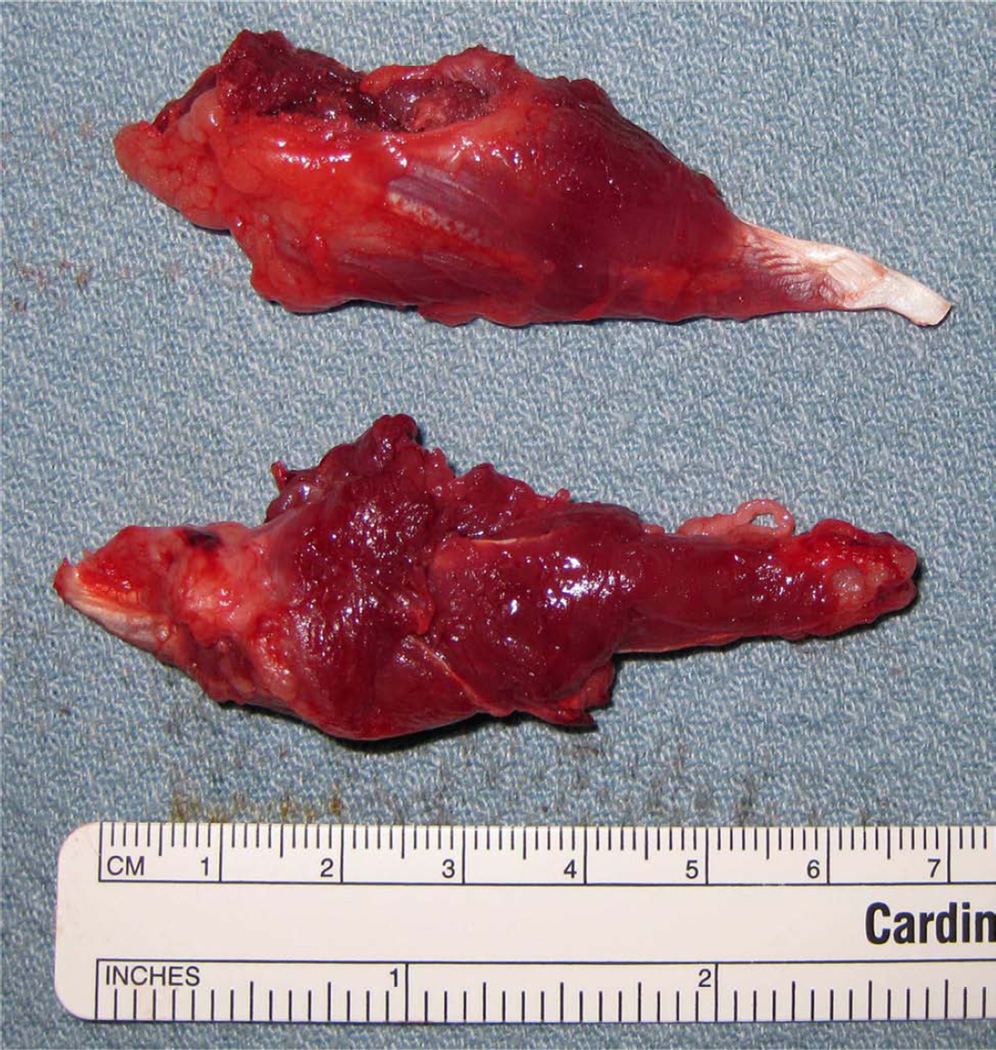
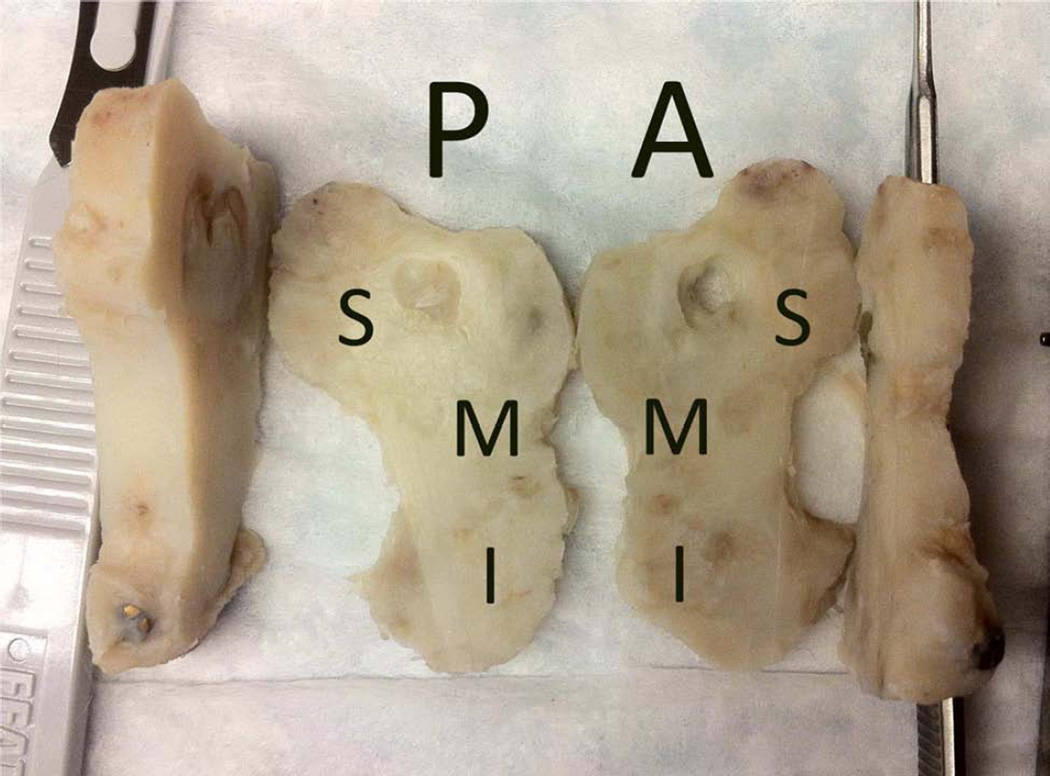
A, Intraoperative photograph with the distraction device fixed across the osteotomy with marker screws at inferior border (arrows). B, Harvested ex-vivo hemimandible with the distraction device opened 12 mm (arrows). C, Harvested ex-vivo ipsilateral and contralateral anterior digastric muscles. D, Coronally sectioned, decalcified regenerate with labeled superior (S), middle (M), inferior (I) thirds for the posterior (P) and anterior (A) sections.
Distraction Protocol
Two groups of minipigs underwent automated, continuous, curvilinear DO to 12 mm at the following rates: Group A (n=5) at 1.5 mm/day and Group B (n=5) at 3 mm/day. No latency period was used and following distraction, the fixation period was twice the amount of distraction in days (i.e. 24 days). Lateral radiographs and overjet measurements taken at Mid-DO, End-DO, and End-fixation were used to monitor the distraction gap. At end fixation, pigs were sedated, sacrificed, and the right mandibular body and angle containing the DO wound (Figure 1B) and the contralateral unoperated mandible were harvested along with the experimental and control side anterior digastric muscles (Figure 1C).
An additional control group for the histologic and histomorphometric analysis consisted of minipigs (n=2) that underwent unidirectional, discontinuous DO at 1 mm/day to 12 mm using the same protocol of 0-day latency and a fixation period of twice the duration of distraction (24 days).[19]
Histological Processing
The harvested mandibles were sectioned in the coronal plane at the middle of the regenerate on the distracted side and at the analogous location on the contralateral, unoperated side (Figure 1D). The mandibular specimens were fixed in 10% phosphate-buffered formalin and then decalcified in Cal-Ex® II (C5511-4D; Fisher Scientific, Pittsburg, PA, USA) solution (10% formic acid in 10% formalin solution) for approximately 3–5 weeks, followed by stabilization in 30% sucrose solution for 24 hours. The anterior digastric muscles were divided longitudinally and cross-sectionally and 2 sections per digastric muscle (1 longitudinal + 1 cross-sectional) were fixed in 2% paraformaldehyde in a 0.1 M cacodylate buffer at 4 °C for 3 days. All specimens were rinsed three times in phosphate-buffered saline (PBS) and stored in 70% ethanol at 20°C.
The mandibular specimens were then transversely divided into thirds: superior third (containing tooth buds), middle third (containing the inferior alveolar nerve), and inferior third. Due to cassette size constraint, specimens were divided at the junction of the middle and inferior thirds and paraffin embedded. This yielded a total of 4 cassettes per hemimandible. The blocks were then coronally sectioned at 6 µm intervals (24 serial sections) at the middle of the regenerate extending both anteriorly and posteriorly and mounted on Fisher-Frost® slides (Pittsburg, PA, USA). Of these, slides 11 and 24 from each block were randomly selected for histologic analysis. Digastric muscles were sagittally and coronally cut along the cross-sectional (2 cassettes with 24 serial sections) and longitudinal planes (2 cassettes with 24 serial sections) and mounted. Sections were stained with hematoxylin and eosin (H&E) for identification of bone, muscle, fibrous tissue, cartilage, and hematoma.
Microscopy
A Nikon Eclipse 80i® (Melville, NY, USA) bright field microscope with a Q Imaging microdigital color camera (Burnaby, BC, Canada) was used to obtain histologic images. Two slides from the anterior and posterior blocks (coronal plane) of each hemimandible were imaged. This yielded 120 images with a magnification of 40× (3 for each slide) and 600 images with a magnification of 200× (15 for each slide). 40× images were taken of the superior, middle and inferior thirds from the anterior and posterior blocks of the regenerate. Three coronal 200× images of the regenerate were taken from each of the following locations: superior, middle, inferior thirds, lingual and buccal periosteum (divided into thirds).
Histomorphometric Analysis
Images of the regenerate at 200× were used for descriptive and histomorphometric analysis through a previously reported technique.[19, 42] Using ImageJ® software (National Institutes of Health, Bethesda, MD), each image was analyzed by two independent reviewers (BJT and MEL) for the percentage of surface area (PSA) occupied by bone, fibrous tissue, cartilage, and hematoma in the superior, middle and inferior thirds of the periosteal surfaces (lingual and buccal) and endosteum. The average PSA occupied by each tissue type at all anatomic sites was also calculated for each animal and experimental group. PSA was calculated as the percentage of the specific tissue type (in pixels) of the total surface area of all tissues in the image (total pixels of the image). All values were analyzed with a standard statistical software package (Statistical Package of Social Sciences (SPSS), version 17.0; Chicago, IL). Independent t-tests (equal variances not assumed) were utilized to compare each group: Group A, B, contralateral unoperated mandible, and discontinuous DO at 1 mm/day from a previous study.[19] Statistical significance was considered with a P value less than 0.05 for each test (P<0.05).
Analysis of Digastric Muscles
Microscopy
Ipsilateral (distracted side) and contralateral digastric muscle histologic sections were assessed by a pathologist (WCF) blinded to the experimental group. Each slide was scored for the percentage of abnormal tissue defined as: the presence of necrosis, fibrosis, central nuclei, inflammation, and atophic or “moth-eaten” muscle fibers. The slides were graded on a semi-quantitative scale as follows: no abnormal tissue (score = 0), abnormal tissue evident in less than 5% of a specimen (score = 1), abnormal tissue evident in 5% to 50% of a specimen (score = 2), and abnormal histology evident in more than 50% of a specimen (score = 3).
Immunohistochemistry
Two longitudinal slides (sagittal sections) from the ipsilateral digastric muscle were prepared from each animal. Slides were incubated overnight at 60°C and then deparaffinized in xylenes (20 min). After serial rehydration in ethanol (100%, 95%, 80%, and 70% for 2.5min) the slides were rinsed in 1× PBS for 10 minutes. Then, microwave heat-induced antigen retrieval (10 min) in 1× PBS for PCNA (M0879; Dako, Carpinteria, CA) and MyoD (M-318; Santa Cruz Biotechnology, Santa Cruz, CA) or citrate-based unmasking solution (1/100 dilution; H 3300; Vector Laboratories, Burlingame, CA) for Pax7 (MAB1675; R&D Systems, Minneapolis, MN) were used to prepare the epitope sites for each antibody. Following the blocking of the endogenous proteins (X0909; Dako), and peroxidases (S2001; Dako), the slides were separately incubated with the primary antibodies at room temperature for 2 hours with the following concentrations: PCNA (5.25 µg/mL), Pax7 (10 µg/mL), and MyoD (4 µg/mL). Antigens were detected using a labeled streptavidin-biotin 2 system (LSAB2-HRP, K0675; Dako) with a 3-amino-9-ethylcarbazole substrate chromagen (K3464; Dako) to form an indicative red precipitate. All slides were counterstained with Mayer hematoxylin with Lillie modification (S3309; Dako). Negative controls were incubated in mouse immunoglobulin-G1 (IgG1) negative control solution (X0931; Dako). Minipig skin slides were used as a positive control.
Results
All 10 minipigs completed the acclimatization, distraction and fixation periods. One animal from each group developed a minor infection at the site of mandibular DO treated with systemic antibiotics (Table 1).[18]
Table 1.
Clinical data – distraction period, rate, and amount
| Protocol | Animal Number |
Distraction Period |
Total Distraction |
Complications |
|---|---|---|---|---|
| Group A | ||||
| 1.5 mm/d | 2–294 | 8 Days | 11.5 mm | None |
| 1.5 mm/d | 3–079 | 8 Days | 8.0 mm | Mandibular & Exit Port Infection |
| 1.5 mm/d | 4–088 | 8 Days | 12.1 mm | Loose Hardware |
| 1.5 mm/d | 4–067 | 8 Days | 7.0 mm | Torn Hydraulic Line |
| 1.5 mm/d | 5–040 | 8 Days | 11.5 mm | None |
| Group B | ||||
| 3.0 mm/d | 5–117 | 4 Days | 12.0 mm | None |
| 3.0 mm/d | 6–037 | 5 Days | 12.0 mm | Exit Port Infection |
| 3.0 mm/d | 7–105 | 9 Days | 13.0 mm | None |
| 3.0 mm/d | 8–056 | 6 Days | 12.5 mm | None |
| 3.0 mm/d | 8–028 | 4 Days | 12.0 mm | Mandibular Infection |
Regenerate Histological Analysis
Group A: 1.5mm/day Rate
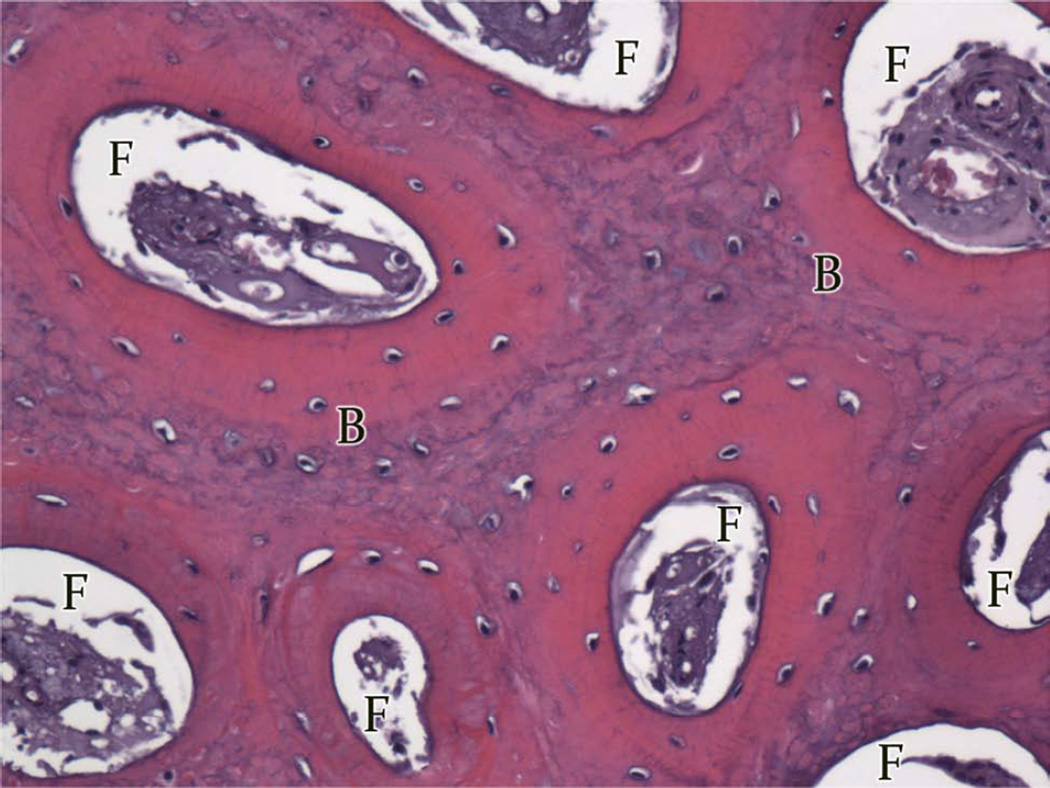
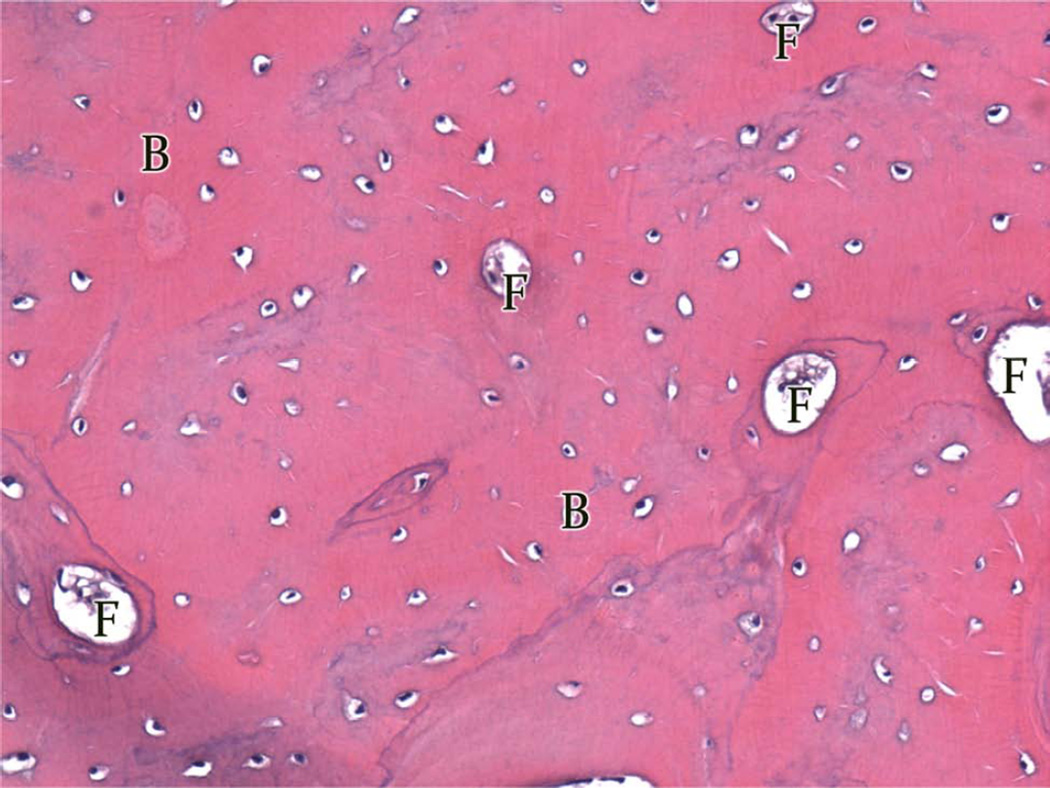
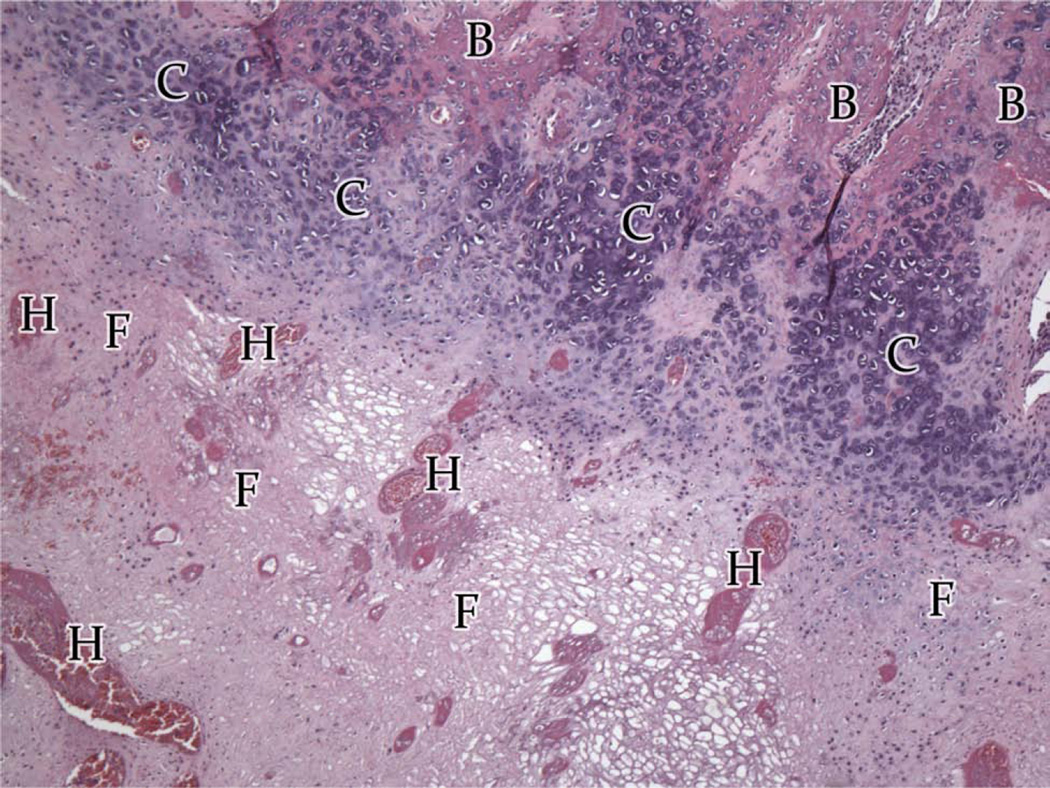
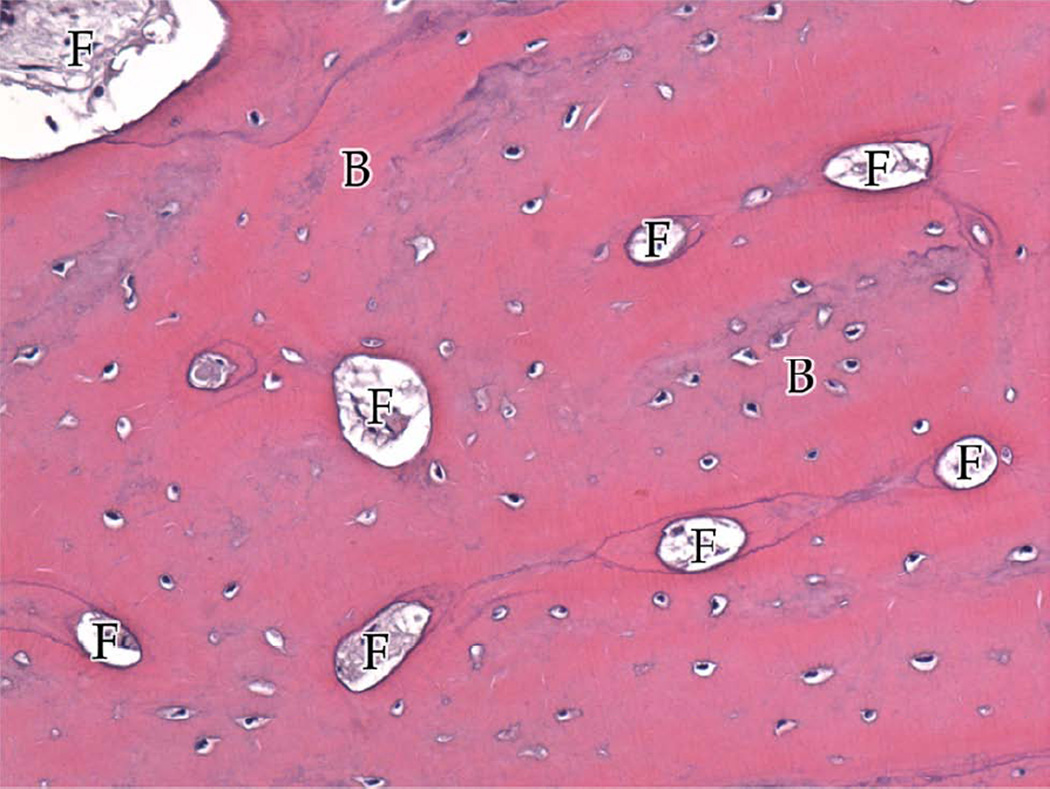
In Group A (Table 2; Figure 2A–C), 4 of the 5 animals had regenerate characterized by large areas of dense, mature bone or small islands of fibrous stroma being replaced by bone (i.e. ossifying centers). Intermixed in each region were areas of trabecular bone and fibrous connective tissue with infrequent islands of chrondrocytes or hematoma. Compact and trabecular bone represented the largest area of tissue. The remaining animal’s DO wound had large areas of fibrous tissue, cartilage, and hematoma (Figure 4). Islands of cartilage and hematoma were more prevalent in the inferior third. Overall, Group A had the most complete osteogenesis in the superior third and decreased osteogenesis in the inferior third. Similar amounts of ossification were found adjacent to the periosteum and the endosteum. No difference was observed between the buccal and lingual regions.
Table 2.
Percent surface area occupied by tissue type and region Group A
| Group A 1.5mm/day |
Average Bone PSA |
Average Fibrous PSA |
Average Hematoma PSA |
Average Cartilage PSA |
|---|---|---|---|---|
| Total | 64.36 ± 5.87 | 34.05 ± 4.88 | 0.74 ± 0.67 | 0.46 ± 0.28 |
| Superior Third | 69.55 ± 2.28 | 29.61 ± 1.68 | 0.11 ± 0.11 | 0.54 ± 0.54 |
| Middle Third | 68.30 ± 6.72 | 31.08 ± 6.16 | 0.04 ± 0.04 | 0.04 ± 0.04 |
| Inferior Third | 55.25 ± 11.21 | 41.44 ± 8.81 | 2.07 ± 1.86 | 0.81 ± 0.81 |
| Endosteum | 63.49 ± 5.91 | 34.91 ± 4.82 | 1.03 ± 0.93 | 0.15 ± 0.15 |
| Periosteum | 65.67 ± 5.90 | 32.75 ± 5.02 | 0.32 ± 0.29 | 0.93 ± 0.54 |
| Buccal Periosteum | 65.42 ± 7.79 | 32.40 ± 7.07 | 0.70 ± 0.04 | 1.49 ± 0.90 |
| Lingual Periosteum | 65.93 ± 5.10 | 33.11 ± 4.24 | 0.56 ± 0.56 | 0.37 ± 0.37 |
Figure 2.
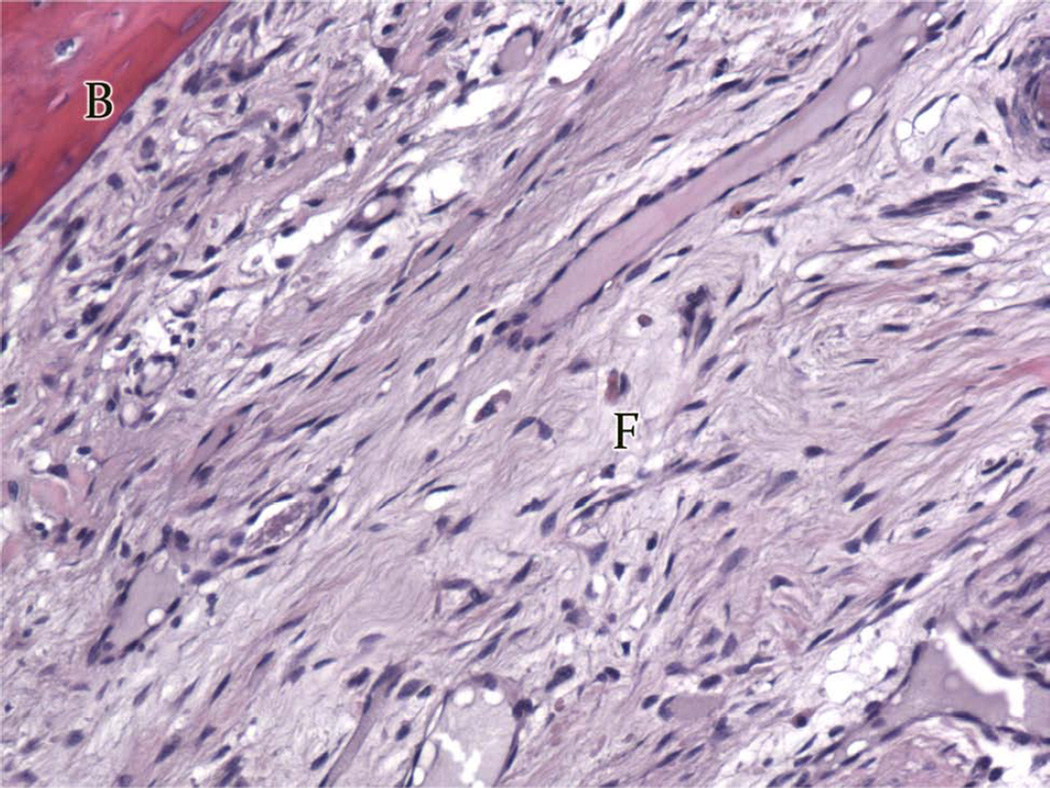
Group A, typical histologic images (H&E) of the regions of the regenerate (200×). A, Superior Region - minimal fibrous tissue (F) and abundant mature bone (B). B, Middle Region - small islands of fibrous stroma (F) in a background of dense bone (B). C, Inferior Region - ossification centers (OC) forming lamellar bone.
Figure 4.
Group A and B, atypical histologic images (H&E) of the regions of the regenerate. Variations from the average, A, Superior third - cartilage nests (C) flanked by fibrous tissue (F) and dense bone (B) (200×). B, Middle region – large islands of fibrous tissue amongst maturing bone (200×). C, Inferior Region - the regenerate in presence of infection (Animal #3-079). Large intermixed areas of hematoma (H), cartilage (C), and fibrous tissue (F) with small regions of bone (B) (40×).
Group B: 3.0mm/day Rate
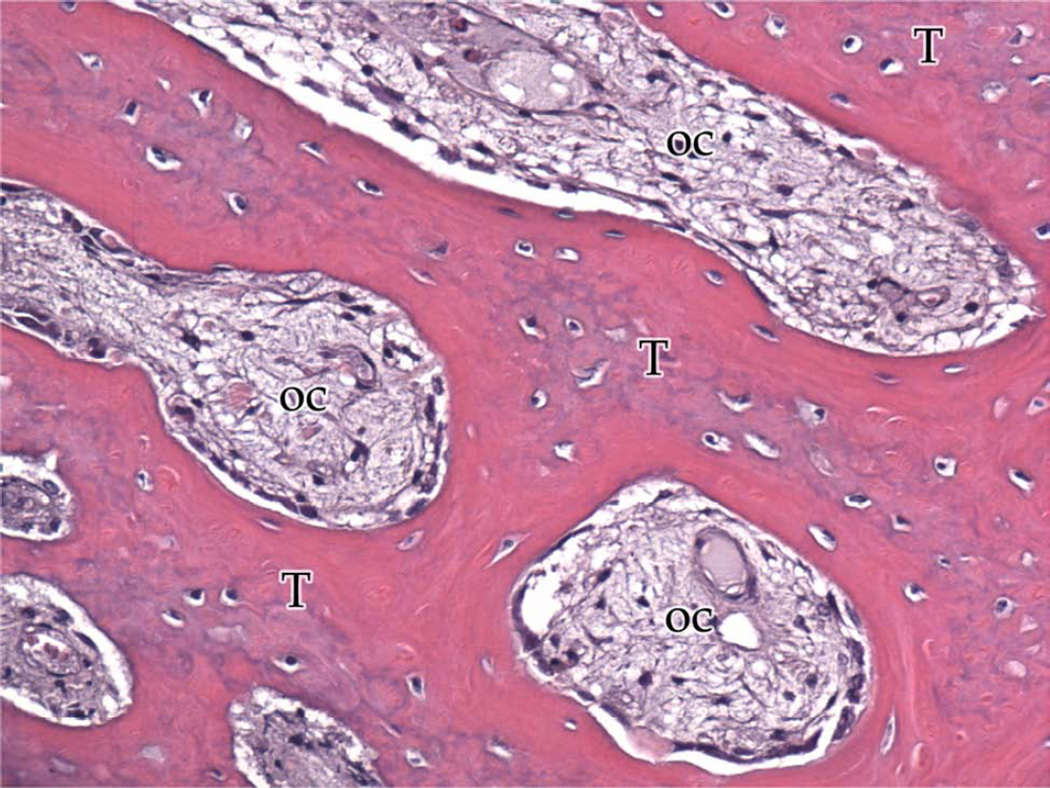
Group B (Table 3; Figure 3A–C) showed large areas of dense and trabecular bone, which represented the largest area of tissue with smaller areas of fibrous tissue. Within the bony trabeculae, ossifying centers were found with osteoblastic rimming at the periphery. Small islands of chondrocytes were observed scattered throughout each endosteal region (Figure 4). No hematoma was observed in any animal. The superior region demonstrated the most complete bone fill and inferior third the lowest. Regions adjacent to the periosteum appeared to have increased ossification compared with the endosteal bone. Lingual periosteal osteogenesis appeared to be more exuberant than that in the buccal periosteal region (63.72±4.44 PSA, P = 0.303).
Table 3.
Percent Surface Area occupied by tissue type and region Group B
| Group B 3.0mm/day |
Average Bone PSA |
Average Fibrous PSA |
Average Hematoma PSA |
Average Cartilage PSA |
|---|---|---|---|---|
| Total | 63.83 ± 3.37 | 34.81 ± 3.06 | 0.00 ± 0.00 | 1.09 ± 0.37 |
| Superior Third | 64.99 ± 5.80 | 33.40 ± 4.90 | 0.00 ± 0.00 | 1.51 ± 0.99 |
| Middle Third | 63.89 ± 3.65 | 34.40 ± 3.38 | 0.00 ± 0.00 | 1.23 ± 0.49 |
| Inferior Third | 62.60 ± 2.99 | 36.63 ± 3.35 | 0.00 ± 0.00 | 0.51 ± 0.51 |
| Endosteum | 61.58 ± 2.97 | 36.67 ± 2.36 | 0.00 ± 0.00 | 1.30 ± 0.52 |
| Periosteum | 67.21 ± 4.41 | 32.02 ± 4.40 | 0.00 ± 0.00 | 0.77 ± 0.39 |
| Buccal Periosteum | 63.72 ± 4.44 | 36.28 ± 4.44 | 0.00 ± 0.00 | 0.00 ± 0.00 |
| Lingual Periosteum | 70.69 ± 4.52 | 27.76 ± 4.64 | 0.00 ± 0.00 | 1.55 ± 0.78 |
Figure 3.
Group B, typical histologic images (H&E) of the regions of the regenerate (200×). A, Superior Region - minimal fibrous tissue (F) and abundant mature bone (B).B, Middle Region - small islands of fibrous stroma (F) in a background of dense bone (B). C, Inferior Region - bony trabeculae (T) spread throughout several ossification centers (OC).
Regenerate Histomorphometry
Group A: 1.5mm/day Rate
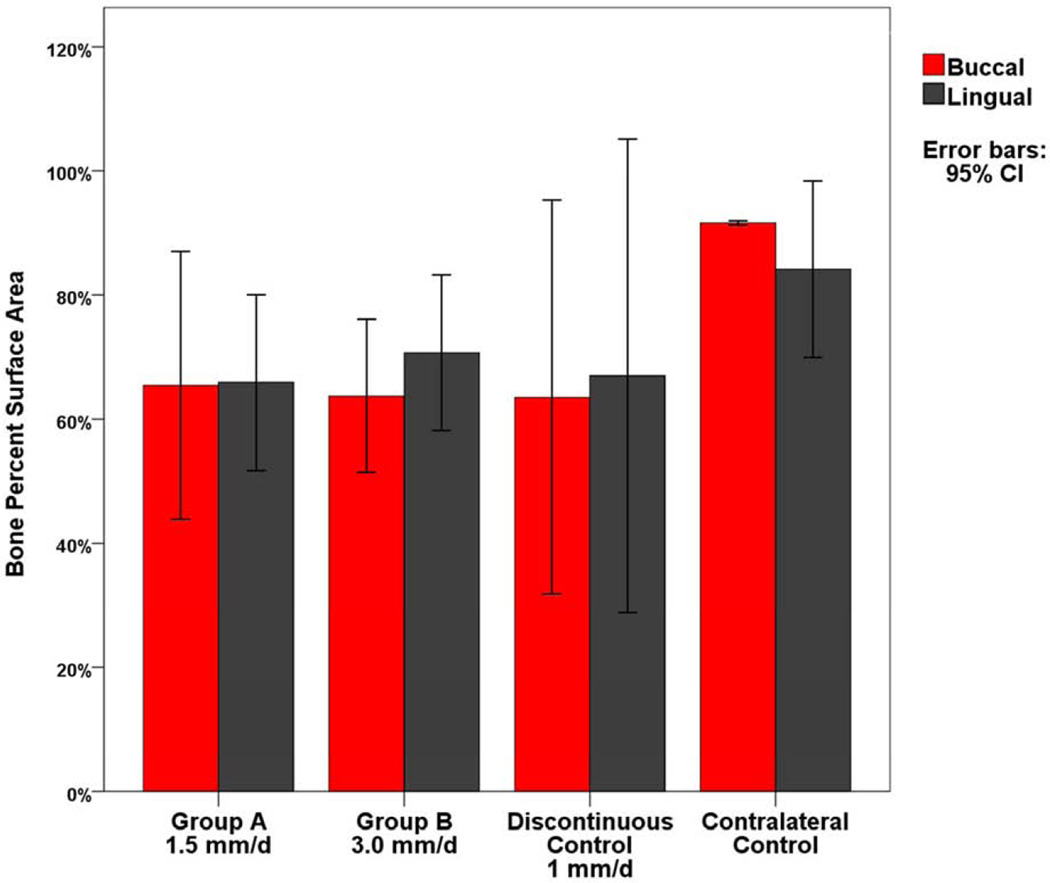
Group A had 64.36±5.87 bone PSA with the highest value at the superior border (69.55±2.28 PSA) and lowest at the inferior border (55.25±11.21 PSA). There was similar ossification (P = 0.800) adjacent to periosteum (65.67±5.90 PSA) when compared to the endosteum (63.49 ±5.91 PSA). No difference (P = 0.958) was observed between the buccal (65.42±7.79 PSA) and lingual (65.93±5.10 PSA) regions.
Group B: 3.0mm/day Rate
The superior third had the highest PSA (64.99±5.80) and inferior third the lowest (62.60±2.99). Regions adjacent to the periosteum (67.21±4.41PSA) had more bone formation (P = 0.325) compared with the endosteal region (61.58±2.97 PSA). Bone formation on the lingual (70.69±4.52 PSA) was greater than the buccal surface (63.72±4.44 PSA, P = 0.303).
Comparisons between Groups A, B, and control groups
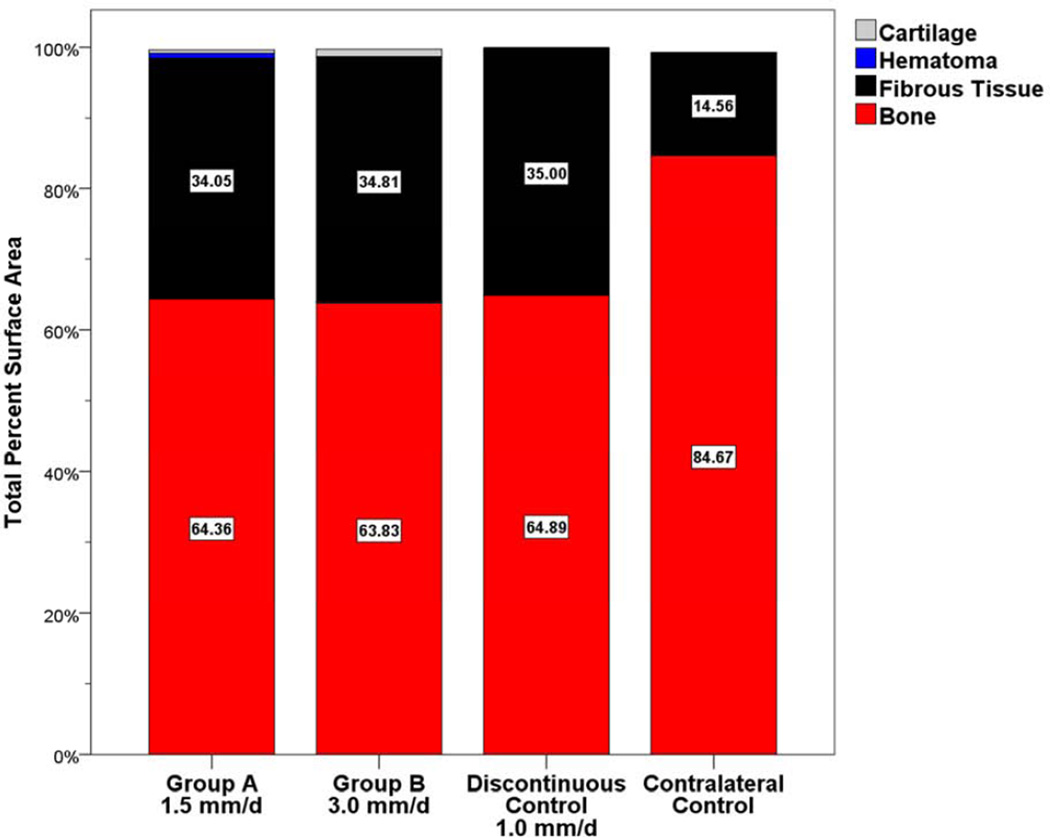
Histomorphometric analysis (Tables 2, 3) revealed no statistical difference between Group A and B for the average PSA occupied by bone (Group A PSA = 64.36±5.87, Group B PSA = 63.83±3.37; P = 0.939) and fibrous tissue (Group A PSA = 34.05±4.88, Group B PSA = 34.81±3.06; P = 0.898) within the regenerate (Figure 5). Both Group A and B were found to have significantly lower total bone PSA than the contralateral nonoperated side (contralateral PSA = 84.67±0.86; P = 0.025, P = 0.003, respectively) as expected. No differences were found when comparing the superior, middle and inferior thirds between groups (Figure 6). As expected for curvilinear DO, bone PSA values were highest in the superior third and lowest in the inferior third for each group. Total PSA values for cartilage and hematoma within the regenerate were minimal (< 1.1 PSA) for both Group A and B. There was no statistical difference between Groups A and B when comparing the buccal and lingual bone adjacent to the periosteum (P = 0.958; P = 0.303 respectively) (Figure 7) or the endosteum (P = 0.800; 0.325) (Figure 8).
Figure 5.
Total PSA occupied by bone, fibrous tissue, hematoma, or cartilage. Similar PSA occupied by bone was observed between Group A (64.36%), Group B (63.83%), and the Discontinuous Control (64.89%). No statistical difference was found between Group A, Group B, or the Discontinuous Control.
Figure 6.
PSA occupied by bone for the superior, middle, and inferior regions. 95% confidence interval error bars. No statistical difference was found between Group A, Group B, or the Discontinuous Control between each region.
Figure 7.
PSA occupied by bone for the buccal and lingual regions. 95% confidence interval error bars. No statistical difference was found between Group A, Group B, or the Discontinuous Control between each region.
Figure 8.
PSA occupied by bone for the endosteum and periosteum. 95% confidence interval error bars. No statistical difference was found between Group A, Group B, or the Discontinuous Control between each region.
Automated, continuous DO in Groups A and B showed similar total PSA bone to discontinuous DO at 1.0 mm/day (total PSA = 64.89±0.56; P = 0.933, P = 0.770, respectively) (Table 4) (Figure 5). Additionally, comparing the superior, middle and inferior thirds of the regenerate in Groups A and B to the discontinuous 1 mm/day control group revealed similar PSA for bone: superior (1.0 mm/day PSA = 65.50±1.50; P = 0.202, P = 0.936, respectively), middle (1.0 mm/day PSA = 63.50±2.50; P = 0.534, P = 0.934, respectively) and inferior (1.0 mm/d PSA = 65.00±2.00; P = 0.438, P = 0.537, respectively) (Figure 6).
Table 4.
Digastric muscle semiquantitative analysis
| Group | Pathologist Score |
Percent Abnormal |
Inflammation | Fibrosis | Size Variability |
Moth- Eaten Fibers |
Necrosis | Edema | Atrophy | Group AVG |
|---|---|---|---|---|---|---|---|---|---|---|
| Group A | 0 | Normal | 20/20 | 20/20 | 19/20 | 18/20 | 20/20 | 0/20 | 14/20 | 0.31 |
| 1.5mm/day | 1 | <5 | 0/20 | 0/20 | 0/20 | 2/20 | 0/20 | 9/20 | 5/20 | |
| 2 | 5–50 | 0/20 | 0/20 | 1/20 | 0/20 | 0/20 | 9/20 | 1/20 | ||
| 3 | >50 | 0/20 | 0/20 | 0/20 | 0/20 | 0/20 | 2/20 | 0/20 | ||
| Group B | 0 | Normal | 17/20 | 18/20 | 20/20 | 19/20 | 20/20 | 0/20 | 15/20 | 0.27 |
| 3.0mm/day | 1 | <5 | 3/20 | 2/20 | 0/20 | 1/20 | 0/20 | 13/20 | 5/20 | |
| 2 | 5–50 | 0/20 | 0/20 | 0/20 | 0/20 | 0/20 | 7/20 | 0/20 | ||
| 3 | >50 | 0/20 | 0/20 | 0/20 | 0/20 | 0/20 | 0/20 | 0/20 | ||
| Contralateral | 0 | Normal | 8/8 | 8/8 | 8/8 | 7/8 | 8/8 | 0/8 | 7/8 | 0.27 |
| 1 | <5 | 0/8 | 0/8 | 0/8 | 1/8 | 0/8 | 4/8 | 1/8 | ||
| 2 | 5–50 | 0/8 | 0/8 | 0/8 | 0/8 | 0/8 | 3/8 | 0/8 | ||
| 3 | >50 | 0/8 | 0/8 | 0/8 | 0/8 | 0/8 | 1/8 | 0/8 |
Digastric Muscle Histological Analysis
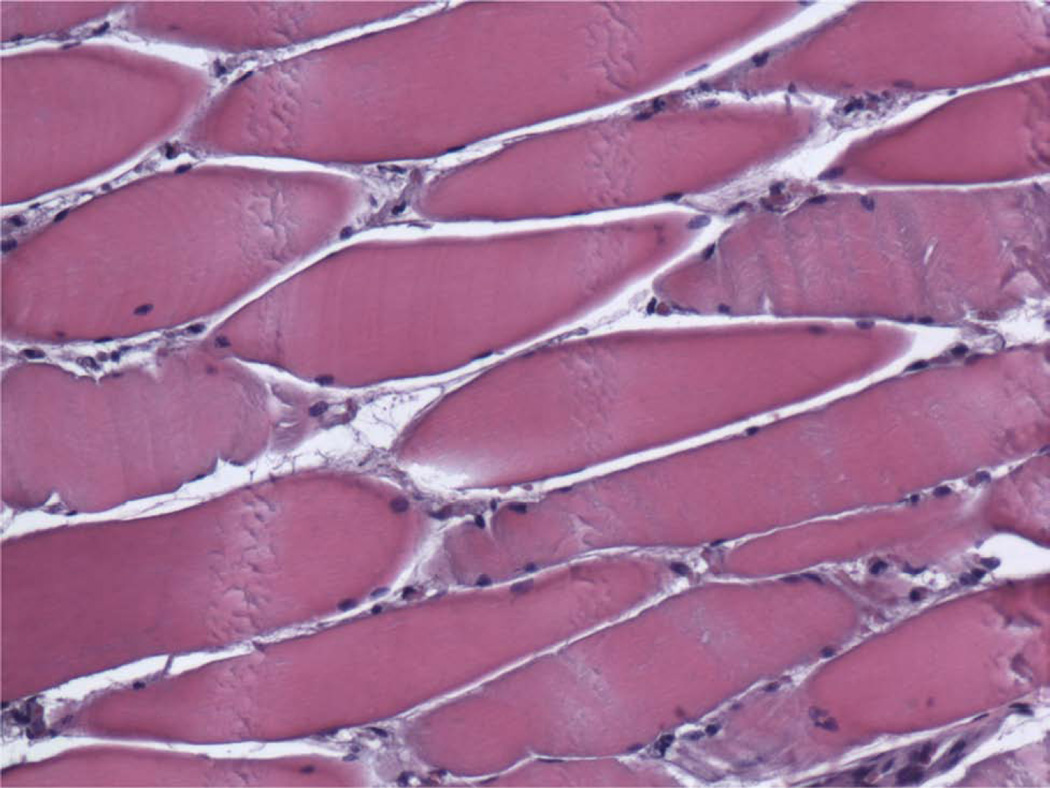
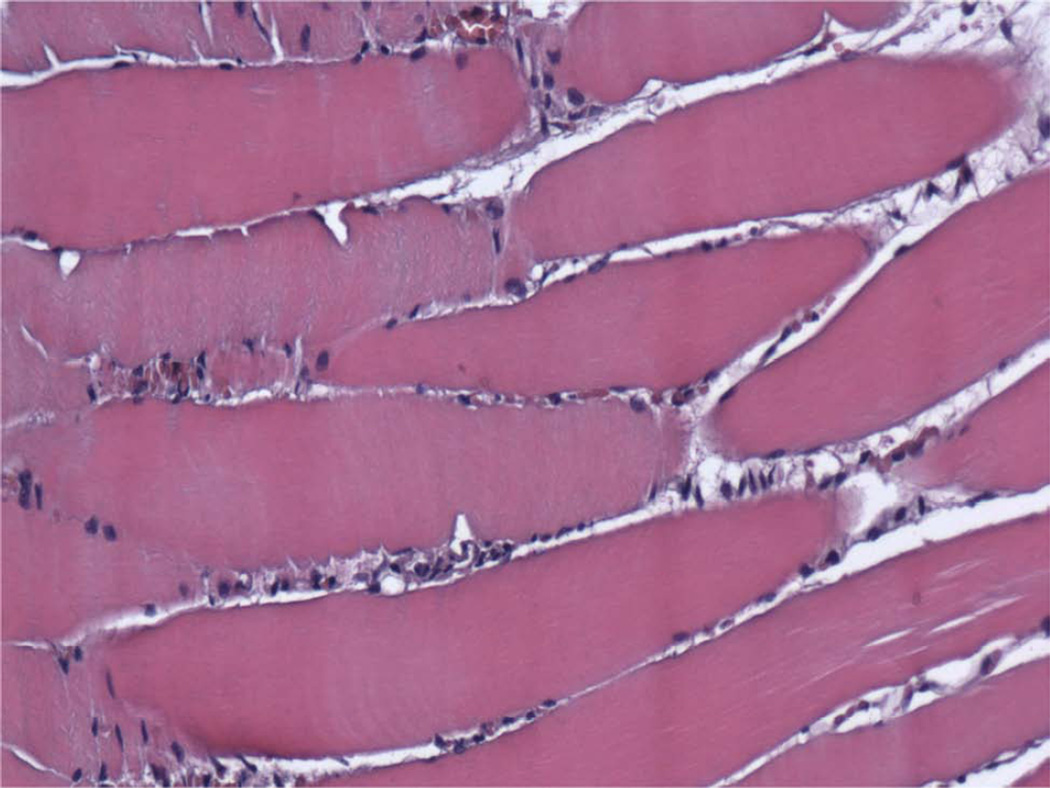
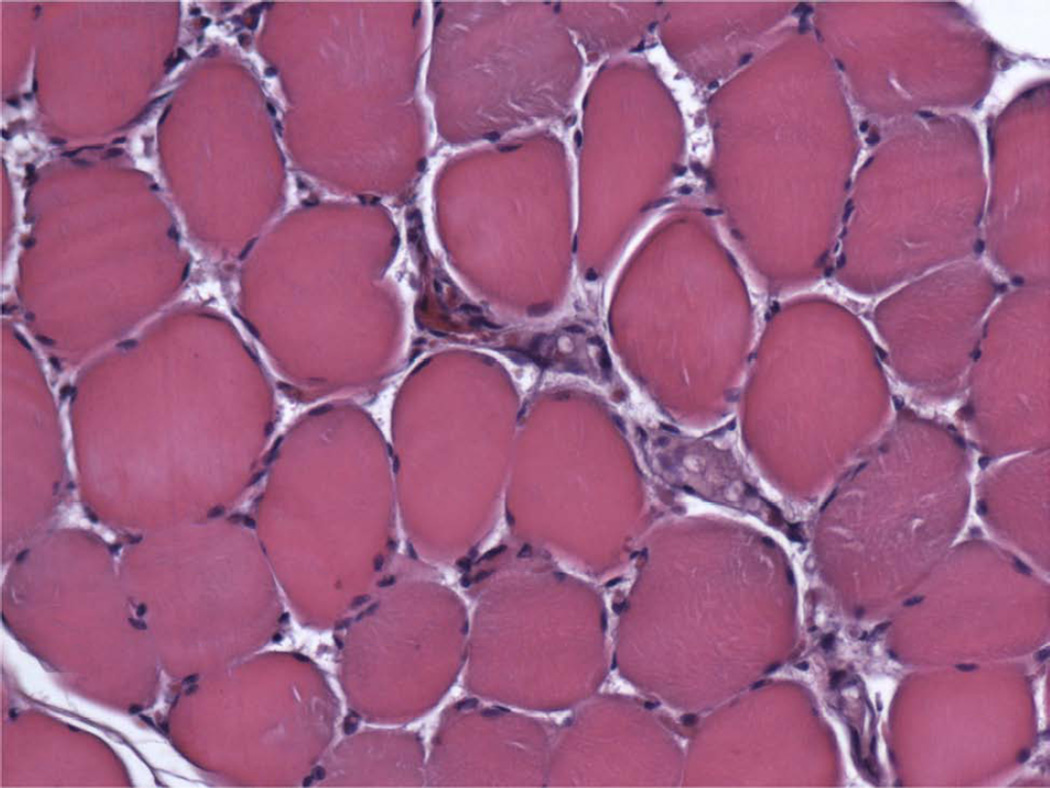
All digastric muscles exhibited minimal amounts of abnormal tissue (Table 4). The averaged total score was 0.31 for Group A (Figure 9A, 9C) and 0.27 for Group B (Figure 9B, 9D) (P = 0.427) and was similar to the contralateral control group (0.27). Both groups showed no signs of inflammation, fibrosis, or necrosis with minimal traces of size variability, moth-eaten fibers, and atrophy (<5%) comparable to the contralateral side indicating a return to baseline appearance after undergoing lengthening during the distraction period (Figure 9A–9D). The contralateral controls had minimal to no abnormal histology. All digastric muscles including the contralateral control demonstrated varying amounts of edema, which is likely to be an artifact from fixative processing.
Figure 9.
Photomicrographs (H&E) of ipsilateral digastric muscles following automated, continuous DO with no abnormal tissue present (200×). A, Group A, longitudinal section, B, Group B, longitudinal specimen, C, Group A, cross-sectional specimen, D, Group B, cross-sectional specimen.
Digastric Muscle Immunohistochemistry
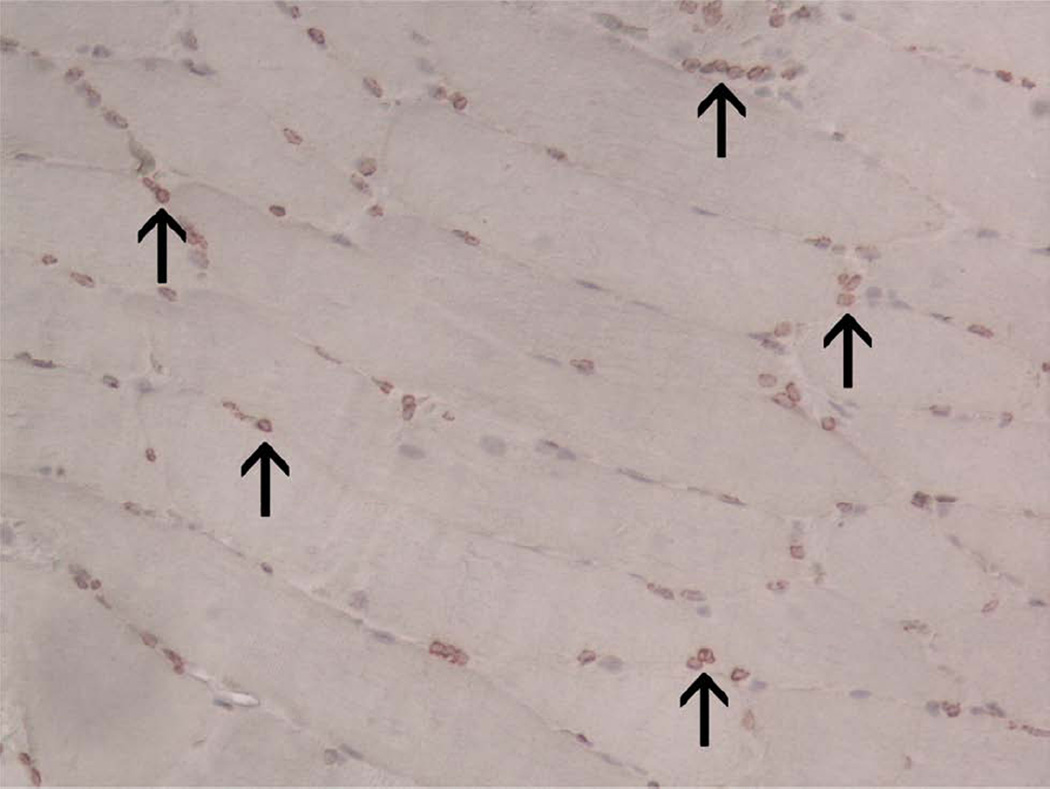
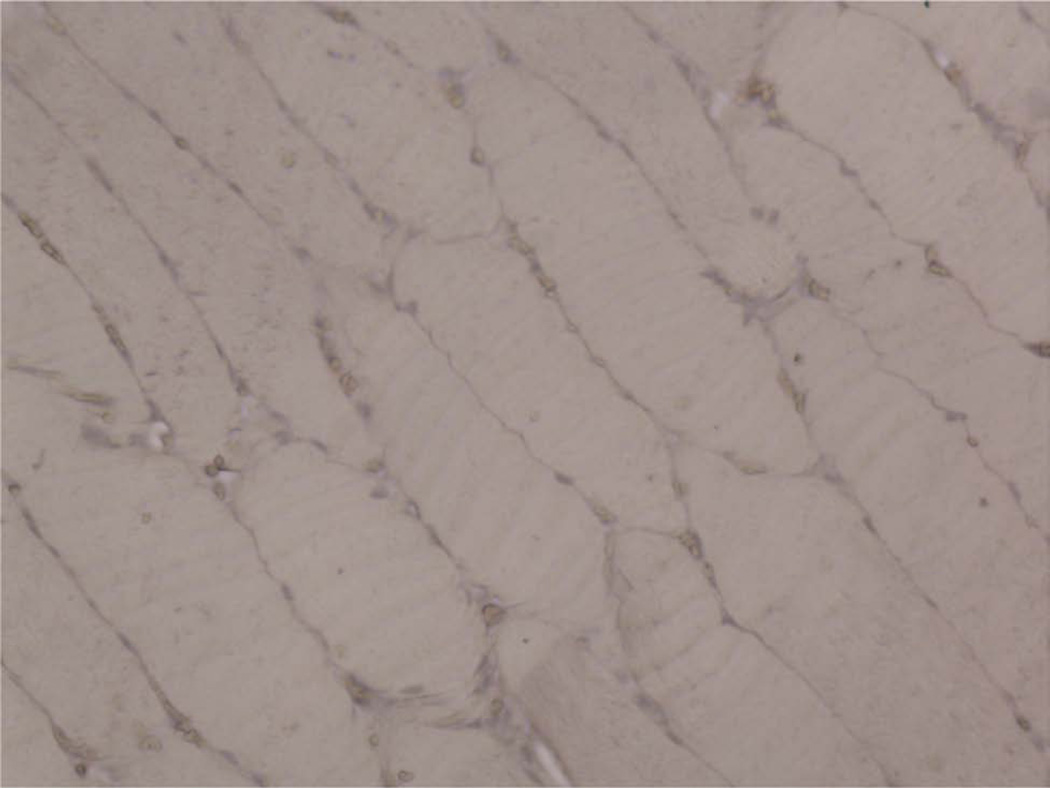
The digastric muscles harvested at end-fixation in both continuous DO groups had uniformly positive intranuclear PAX7 staining (Figure 10A) with low MyoD (Figure 10B) and PCNA (Figure 10C) staining. Positive skin controls demonstrated strong expression for PCNA. Each negative control showed no increased staining.
Discussion
The purpose of the current study was to evaluate bone healing following automated, continuous, curvilinear distraction osteogenesis in a minipig mandibular model. Our hypothesis was that continuous DO at rates greater than 1mm /day would produce adequate bone fill within the distraction gap and clinical union of the segments and that the surrounding soft tissue would exhibit no adverse effects. The specific aims were to assess the percent surface area (PSA) occupied by bone of continuous DO wound at 1.5 mm/day and 3.0 mm/day compared to discontinuous DO at 1 mm/day and to assess the effect of continuous DO on digastric muscle wound healing.
The results of the current study confirm the hypothesis that continuous DO at rates faster than 1 mm/day results in nearly complete bone fill without negative effects on the surrounding soft tissue. The total PSA occupied by bone was remarkably similar in Group A (PSA=64.36±5.87), Group B (PSA=63.83±3.37; P=0.939) and control animals distracted discontinuously at 1 mm/day (PSA=64.89±0.56; P=0.933, 0.770 respectively). The amount of fibrous tissue was similar in all groups and represented only a small portion of the total PSA. Only minimal amounts of cartilage and hematoma were present within either experimental group (Group A PSA = 0.74±0.67; 0.46±0.28 respectively and Group B PSA = 0.00±0.00; 1.09±0.37, respectively). These results suggest that continuous DO produces equivalent bone formation at rates of 1.5 and 3.0 mm/day when compared to the standard discontinuous distraction at 1.0 mm/day. Rates faster than 1.0 mm/day with discontinuous distraction have been shown to result in inadequate bone fill and/or fibrous union.[5, 6, 10–12]
The curvilinear vector of distraction creates a gradient of distraction rates from the superior to the inferior border of the mandible. The inferior third of the mandible is distracted at a faster rate than the superior and middle thirds creating a trapezoidal shaped distraction wound.[15, 43, 44] The rates can be calculated using the height of the mandible and the radius of curvature of the device (5cm). The mandible was distracted at 0.75 mm/day at the superior border and 2.25 mm/day at the inferior border for Group A and 1.5 mm/day and 4.5 mm/day respectively for Group B.[18] To our knowledge, this is the first study documenting histologic bone formation with distraction rates up to 4.5 mm/day. Increased discontinuous distraction rates above the standard have previously only yielded poor ossification or non-union.[5, 6, 10–13]
Consistent with the concept of a gradient of rates in curvilinear DO, the PSA occupied by bone was lowest in the inferior region for both groups and the highest for the superior region. In previous studies of unidirectional DO in the minipig model, there was also higher bone formation in the superior and middle thirds.[11, 19] This was thought to be due to osteogenic factors related to tooth buds (bone morphogenic protein) in the superior third. and within the inferior alveolar canal (nerve growth factor) in the middle thirddd of the wound. [45–49] Increased presence of these growth factors has been associated with more exuberant osteogenesis within these regions.[45–48, 50–53] Even without these factors, continuous DO allowed for robust bone formation at the inferior border at rates up to 4.5 mm/day.
The Yucatan minipig model also allows for comparison of the buccal, lingual and central aspects of the DO wound. At end-fixation, both periosteal bone and endosteal bone were similar for both groups. In previous studies by our group, endosteal bone formation lagged behind periosteal bone during the early phases of DO and then normalized by end-fixation.[19] In a previously reported sheep model of mandibular DO, the lingual side of the mandible was shown to have more bone formation when compared to the buccal side. It was concluded that the presence of the distraction device had a negative impact on buccal bone formation.[54] This was not seen in the present study, nor in previous studies by our group.[19] It is hypothesized that that maintenance and reapproximation of the pterygomasseteric sling may facilitate more robust bone healing.
The digastric muscle lies within the vector of distraction and is elongated with the expanding mandible. Van der Meulen et al[39] showed that discontinuous distraction rates of 3mm/day in sheep lead to a maladaptive response in digastric muscle fibers. Acute lengthening of the rabbit mandible to 10 mm led to rupturing of the anterior digastric muscle fibers with only minimal recovery after 35 days.[31]. In the current study, digastric muscle histologic analysis showed minimal abnormal or inflamed tissue (<5 of total tissue) in both study groups, at end fixation, suggesting distracting continuously may minimize the deleterious effect of increased distraction rates on the surrounding soft tissue.
Digastric muscle immunohistochemistry revealed basal levels of expression for each protein analyzed. MyoD and PCNA, indicators of muscle proliferation, showed low signaling for both groups.[32, 37, 38] PAX7, a marker of the quiescent myocyte state, was uniformly expressed throughout.[33–35] This is as expected since this investigation was specifically limited to end-fixation healing in order to demonstrate the feasibility of continous DO at rates greater than 1mm/day. Within previous studies of discontinuous DO at 1 mm/day, we demonstrated a return to a quiescent state of muscle at end-fixation.[32]. This indicates termination of myocyte proliferation in response to DO within the surrounding digastric muscles. These findings, coupled with the H&E analysis, suggest that the digastric muscle has effectively completed muscular expansion and returned to baseline.
The current clinical protocols for craniofacial DO are based on the work of Ilizarov in long bones using a canine model and clinical case series.[4–7] Ilizarov demonstrated that discontinuous DO at rates faster than 1 mm/day resulted in nonunion and slower rates resulted in premature consolidation. He hypothesized that a more frequent rhythm of distraction up to continuous distraction would allow faster rates, but technological limitations prevented further study at that time.[4–7] It does appear that continuous DO at rates of up to 4.5 mm/day at the inferior border of the minipig mandible results in bone formation across the gap. Clinical, radiographic, and now histologic bone fill has been shown using this device and technique.[18] Other teams have shown similar results.[20, 55–64]
This study has several limitations. The expense of the large animal model limited the sample size. Comparisons were made to unidirectional discontinuous distraction using the same minipig model but with different devices. The effects of the device shape and the different position of the exit ports on bone formation are not known. Although the 12 mm distraction gap has been shown to be a critical size defect in this minipig model, it does not represent a common clinical scenario and additional studies are underway to show larger distraction gaps using continuous DO. This pilot study only assessed bone at end-fixation. No conclusions on the sequence of healing of the continuous DO wound can be made and studies assessing bone formation at mid-DO, end-DO, and mid-fixation may allow further modification of DO protocols. The sequence of healing in a larger group of animals will be the next phase of this project.
In conclusion, automated, continuous, curvilinear DO of the minipig mandible at rates up to 4.5 mm/day at the inferior border resulted in clinical union, confirmatory histologic evidence of adequate bone formation and no detrimental effects on the surrounding soft tissue. This device and technique have the potential to improve treatment of craniofacial deformities by producing adequate bone at faster distraction rates thereby reducing treatment times. In addition, the automated, buried device requires no patient or family activation and the sensor monitoring jaw position eliminates the need for multiple imaging studies to document the correct vector of movement and distractor function.
Figure 10.
Immunohistochemical staining of ipsilateral digastric muscle for PAX7 (A), MyoD (B), and PCNA (C). Strong, red intranuclear staining was expectedly only observed for PAX7 (arrow) (200×).
Acknowledgments
Funding
This work was funded by NIH/NIDCR SBIR grant (5R44DE014803-03), the MGH Department of Oral and Maxillofacial Surgery Education and Research Fund, and the Hanson Foundation (Boston, MA, USA).
Footnotes
Publisher's Disclaimer: This is a PDF file of an unedited manuscript that has been accepted for publication. As a service to our customers we are providing this early version of the manuscript. The manuscript will undergo copyediting, typesetting, and review of the resulting proof before it is published in its final citable form. Please note that during the production process errors may be discovered which could affect the content, and all legal disclaimers that apply to the journal pertain.
This paper was presented as an abstract at the International Association of Dental Research Annual Meeting, Seattle, Washington, March 2013.
References
- 1.McCarthy JG, Schreiber J, Karp N, Thorne CH, Grayson BH. Lengthening the human mandible by gradual distraction. Plast Reconstr Surg. 1992;89:1. [PubMed] [Google Scholar]
- 2.Swennen G, Schliephake H, Dempf R, Schierle H, Malevez C. Craniofacial distraction osteogenesis: a review of the literature: Part 1: clinical studies. Int J Oral Maxillofac Surg. 2001;30:89. doi: 10.1054/ijom.2000.0033. [DOI] [PubMed] [Google Scholar]
- 3.Goldwaser BR, Magill J, Papadaki ME, Byl M, Kromann R, Yates B, Morency J, Kaban LB, Troulis MJ. Continuous mandibular distraction osteogenesis: novel device and preliminary results in minipigs. J Oral Maxillofac Surg. 2013;71:e168. doi: 10.1016/j.joms.2012.09.012. [DOI] [PubMed] [Google Scholar]
- 4.Ilizarov GA. The principles of the Ilizarov method. Bull Hosp Jt Dis Orthop Inst. 1988;48:1. [PubMed] [Google Scholar]
- 5.Ilizarov GA. The tension-stress effect on the genesis and growth of tissues: Part II. The influence of the rate and frequency of distraction. Clin Orthop Relat Res. 1989:263. [PubMed] [Google Scholar]
- 6.Ilizarov GA. The tension-stress effect on the genesis and growth of tissues. Part I. The influence of stability of fixation and soft-tissue preservation. Clin Orthop Relat Res. 1989:249. [PubMed] [Google Scholar]
- 7.Ilizarov GA. Clinical application of the tension-stress effect for limb lengthening. Clin Orthop Relat Res. 1990:8. [PubMed] [Google Scholar]
- 8.Perrott DH, Berger R, Vargervik K, Kaban LB. Use of a skeletal distraction device to widen the mandible: a case report. J Oral Maxillofac Surg. 1993;51:435. doi: 10.1016/s0278-2391(10)80364-7. [DOI] [PubMed] [Google Scholar]
- 9.Troulis MJ, Padwa B, Kaban LB. Distraction osteogenesis: past, present, and future. Facial Plast Surg. 1998;14:205. doi: 10.1055/s-2008-1064346. [DOI] [PubMed] [Google Scholar]
- 10.Troulis MJ, Glowacki J, Perrott DH, Kaban LB. Effects of latency and rate on bone formation in a porcine mandibular distraction model. J Oral Maxillofac Surg. 2000;58:507. doi: 10.1016/s0278-2391(00)90012-0. [DOI] [PubMed] [Google Scholar]
- 11.Zimmermann CE, Thurmuller P, Troulis MJ, Perrott DH, Rahn B, Kaban LB. Histology of the porcine mandibular distraction wound. Int J Oral Maxillofac Surg. 2005;34:411. doi: 10.1016/j.ijom.2004.09.002. [DOI] [PubMed] [Google Scholar]
- 12.Zimmermann CE, Harris G, Thurmuller P, Troulis MJ, Perrott DH, Rahn B, Kaban LB. Assessment of bone formation in a porcine mandibular distraction wound by computed tomography. Int J Oral Maxillofac Surg. 2004;33:569. doi: 10.1016/j.ijom.2004.01.022. [DOI] [PubMed] [Google Scholar]
- 13.Glowacki J, Shusterman EM, Troulis M, Holmes R, Perrott D, Kaban LB. Distraction osteogenesis of the porcine mandible: histomorphometric evaluation of bone. Plast Reconstr Surg. 2004;113:566. doi: 10.1097/01.PRS.0000101061.99577.09. [DOI] [PubMed] [Google Scholar]
- 14.Steinbacher DM, Kaban LB, Troulis MJ. Mandibular advancement by distraction osteogenesis for tracheostomy-dependent children with severe micrognathia. J Oral Maxillofac Surg. 2005;63:1072. doi: 10.1016/j.joms.2005.04.013. [DOI] [PubMed] [Google Scholar]
- 15.Kaban LB, Seldin EB, Kikinis R, Yeshwant K, Padwa BL, Troulis MJ. Clinical application of curvilinear distraction osteogenesis for correction of mandibular deformities. J Oral Maxillofac Surg. 2009;67:996. doi: 10.1016/j.joms.2009.01.010. [DOI] [PMC free article] [PubMed] [Google Scholar]
- 16.Goldwaser BR, Papadaki ME, Kaban LB, Troulis MJ. Automated continuous mandibular distraction osteogenesis: review of the literature. J Oral Maxillofac Surg. 2012;70:407. doi: 10.1016/j.joms.2011.01.042. [DOI] [PubMed] [Google Scholar]
- 17.Magill JC, Byl MF, Goldwaser B, Papadaki M, Kromann R, Yates B, Morency JR, Kaban LB, Troulis MJ. Automating skeletal expansion: An implant for distraction osteogenesis of the mandible. J Med Device. 2009;3:14502. doi: 10.1115/1.3071969. [DOI] [PMC free article] [PubMed] [Google Scholar]
- 18.Peacock ZS, Tricomi BJ, Murphy BA, Magill JC, Kaban LB, Troulis MJ. Automated Continuous Distraction Osteogenesis May Allow Faster Distraction Rates: A Preliminary Study. Journal of oral and maxillofacial surgery : official journal of the American Association of Oral and Maxillofacial Surgeons. 2013;71:1073. doi: 10.1016/j.joms.2012.11.015. [DOI] [PMC free article] [PubMed] [Google Scholar]
- 19.Lawler ME, Tayebaty FT, Williams WB, Troulis MJ, Kaban LB. Histomorphometric analysis of the porcine mandibular distraction wound. J Oral Maxillofac Surg. 2010;68:1543. doi: 10.1016/j.joms.2010.02.048. [DOI] [PubMed] [Google Scholar]
- 20.Kessler P, Wiltfang J, Neukam FW. A new distraction device to compare continuous and discontinuous bone distraction in mini-pigs: a preliminary report. J Craniomaxillofac Surg. 2000;28:5. doi: 10.1054/jcms.2000.0101. [DOI] [PubMed] [Google Scholar]
- 21.Komuro Y, Akizuki T, Kurakata M, Ohmori K. Histological examination of regenerated bone through craniofacial bone distraction in clinical studies. J Craniofac Surg. 1999;10:308. doi: 10.1097/00001665-199907000-00004. [DOI] [PubMed] [Google Scholar]
- 22.Isefuku S, Joyner CJ, Simpson AH. A murine model of distraction osteogenesis. Bone. 2000;27:661. doi: 10.1016/s8756-3282(00)00385-9. [DOI] [PubMed] [Google Scholar]
- 23.Delloye C, Delefortrie G, Coutelier L, Vincent A. Bone regenerate formation in cortical bone during distraction lengthening. An experimental study. Clin Orthop Relat Res. 1990:34. [PubMed] [Google Scholar]
- 24.Aronson J, Shen XC, Gao GG, Miller F, Quattlebaum T, Skinner RA, Badger TM, Lumpkin CK., Jr Sustained proliferation accompanies distraction osteogenesis in the rat. J Orthop Res. 1997;15:563. doi: 10.1002/jor.1100150412. [DOI] [PubMed] [Google Scholar]
- 25.Komuro Y, Takato T, Harii K, Yonemara Y. The histologic analysis of distraction osteogenesis of the mandible in rabbits. Plast Reconstr Surg. 1994;94:152. doi: 10.1097/00006534-199407000-00017. [DOI] [PubMed] [Google Scholar]
- 26.Stewart KJ, Lvoff GO, White SA, Bonar SF, Walsh WR, Smart RC, Poole MD. Mandibular distraction osteogenesis: a comparison of distraction rates in the rabbit model. J Craniomaxillofac Surg. 1998;26:43. doi: 10.1016/s1010-5182(98)80034-6. [DOI] [PubMed] [Google Scholar]
- 27.Tavakoli K, Walsh WR, Bonar F, Smart R, Wulf S, Poole MD. The role of latency in mandibular osteodistraction. J Craniomaxillofac Surg. 1998;26:209. doi: 10.1016/s1010-5182(98)80016-4. [DOI] [PubMed] [Google Scholar]
- 28.Caiozzo VJ, Utkan A, Chou R, Khalafi A, Chandra H, Baker M, Rourke B, Adams G, Baldwin K, Green S. Effects of distraction on muscle length: mechanisms involved in sarcomerogenesis. Clin Orthop Relat Res. 2002:S133. doi: 10.1097/00003086-200210001-00016. [DOI] [PubMed] [Google Scholar]
- 29.Castano FJ, Troulis MJ, Glowacki J, Kaban LB, Yates KE. Proliferation of masseter myocytes after distraction osteogenesis of the porcine mandible. J Oral Maxillofac Surg. 2001;59:302. doi: 10.1053/joms.2001.21000. [DOI] [PubMed] [Google Scholar]
- 30.Mackool RJ, Hopper RA, Grayson BH, Holliday R, McCarthy JG. Volumetric change of the medial pterygoid following distraction osteogenesis of the mandible: an example of the associated soft-tissue changes. Plast Reconstr Surg. 2003;111:1804. doi: 10.1097/01.PRS.0000055431.19215.0A. [DOI] [PubMed] [Google Scholar]
- 31.Sato M, Maruoka Y, Kunimori K, Imai H, Kabasawa Y, Ichinose S, Harada K, Omura K. Morphological and immunohistochemical changes in muscle tissue in association with mandibular distraction osteogenesis. J Oral Maxillofac Surg. 2007;65:1517. doi: 10.1016/j.joms.2006.10.041. [DOI] [PubMed] [Google Scholar]
- 32.Lawler ME, Hansen GM, Williams WB, Susarla SM, Faquin WC, Troulis MJ, Kaban LB. Serial histologic and immunohistochemical changes in anterior digastric myocytes in response to distraction osteogenesis. J Oral Maxillofac Surg. 2012;70:168. doi: 10.1016/j.joms.2011.01.016. [DOI] [PubMed] [Google Scholar]
- 33.Kuang S, Charge SB, Seale P, Huh M, Rudnicki MA. Distinct roles for Pax7 and Pax3 in adult regenerative myogenesis. J Cell Biol. 2006;172:103. doi: 10.1083/jcb.200508001. [DOI] [PMC free article] [PubMed] [Google Scholar]
- 34.Rudnicki MA, Le Grand F, McKinnell I, Kuang S. The molecular regulation of muscle stem cell function. Cold Spring Harb Symp Quant Biol. 2008;73:323. doi: 10.1101/sqb.2008.73.064. [DOI] [PubMed] [Google Scholar]
- 35.Yablonka-Reuveni Z, Day K, Vine A, Shefer G. Defining the transcriptional signature of skeletal muscle stem cells. J Anim Sci. 2008;86:E207. doi: 10.2527/jas.2007-0473. [DOI] [PMC free article] [PubMed] [Google Scholar]
- 36.Lewis MP, Machell JR, Hunt NP, Sinanan AC, Tippett HL. The extracellular matrix of muscle--implications for manipulation of the craniofacial musculature. Eur J Oral Sci. 2001;109:209. doi: 10.1034/j.1600-0722.2001.00021.x. [DOI] [PubMed] [Google Scholar]
- 37.Megeney LA, Rudnicki MA. Determination versus differentiation and the MyoD family of transcription factors. Biochem Cell Biol. 1995;73:723. doi: 10.1139/o95-080. [DOI] [PubMed] [Google Scholar]
- 38.Moldovan GL, Pfander B, Jentsch S. PCNA, the maestro of the replication fork. Cell. 2007;129:665. doi: 10.1016/j.cell.2007.05.003. [DOI] [PubMed] [Google Scholar]
- 39.van der Meulen JH, Borschel GH, Lynch JB, Nicklin S, Ho KC, Gianoutsos MP, Walsh WR, Kuzon WM., Jr The effect of rate of distraction osteogenesis on structure and function of anterior digastric muscle fibers. Plast Reconstr Surg. 2005;115:831. doi: 10.1097/01.prs.0000153033.64186.58. [DOI] [PubMed] [Google Scholar]
- 40.Ciochon RL, Nisbett RA, Corruccini RS. Dietary consistency and craniofacial development related to masticatory function in minipigs. J Craniofac Genet Dev Biol. 1997;17:96. [PubMed] [Google Scholar]
- 41.de Vernejoul MC, Pointillart A, Golenzer CC, Morieux C, Bielakoff J, Modrowski D, Miravet L. Effects of iron overload on bone remodeling in pigs. Am J Pathol. 1984;116:377. [PMC free article] [PubMed] [Google Scholar]
- 42.Papadaki ME, Kaban LB, Troulis MJ. Minipig model of maxillary distraction osteogenesis: immunohistochemical and histomorphometric analysis of the sequence of osteogenesis. J Oral Maxillofac Surg. 2012;70:2629. doi: 10.1016/j.joms.2012.01.030. [DOI] [PubMed] [Google Scholar]
- 43.Ritter L, Yeshwant K, Seldin EB, Kaban LB, Gateno J, Keeve E, Kikinis R, Troulis MJ. Range of curvilinear distraction devices required for treatment of mandibular deformities. J Oral Maxillofac Surg. 2006;64:259. doi: 10.1016/j.joms.2005.10.015. [DOI] [PubMed] [Google Scholar]
- 44.Seldin EB, Troulis MJ, Kaban LB. Evaluation of a semiburied, fixed-trajectory, curvilinear, distraction device in an animal model. J Oral Maxillofac Surg. 1999;57:1442. doi: 10.1016/s0278-2391(99)90729-2. [DOI] [PubMed] [Google Scholar]
- 45.Wang L, Zhou S, Liu B, Lei D, Zhao Y, Lu C, Tan A. Locally applied nerve growth factor enhances bone consolidation in a rabbit model of mandibular distraction osteogenesis. J Orthop Res. 2006;24:2238. doi: 10.1002/jor.20269. [DOI] [PubMed] [Google Scholar]
- 46.Wang L, Zhao Y, Cheng X, Yang Y, Liu G, Ma Q, Shang H, Tian L, Lei D. Effects of locally applied nerve growth factor to the inferior alveolar nerve histology in a rabbit model of mandibular distraction osteogenesis. Int J Oral Maxillofac Surg. 2009;38:64. doi: 10.1016/j.ijom.2008.11.010. [DOI] [PubMed] [Google Scholar]
- 47.Yates KE, Troulis MJ, Kaban LB, Glowacki J. IGF-I, TGF-beta, and BMP-4 are expressed during distraction osteogenesis of the pig mandible. Int J Oral Maxillofac Surg. 2002;31:173. doi: 10.1054/ijom.2001.0204. [DOI] [PubMed] [Google Scholar]
- 48.Park BW, Kim JR, Lee JH, Byun JH. Expression of nerve growth factor and vascular endothelial growth factor in the inferior alveolar nerve after distraction osteogenesis. Int J Oral Maxillofac Surg. 2006;35:624. doi: 10.1016/j.ijom.2006.02.019. [DOI] [PubMed] [Google Scholar]
- 49.Hansen GM, Lawler ME, Williams WB, Troulis MJ, Kaban LB. BMP4 localization and PCNA expression during distraction osteogenesis of the porcine mandible. Int J Oral Maxillofac Surg. 2012;41:867. doi: 10.1016/j.ijom.2011.12.032. [DOI] [PubMed] [Google Scholar]
- 50.Bouletreau PJ, Warren SM, Longaker MT. The molecular biology of distraction osteogenesis. J Craniomaxillofac Surg. 2002;30:1. doi: 10.1054/jcms.2001.0263. [DOI] [PubMed] [Google Scholar]
- 51.Farhadieh RD, Dickinson R, Yu Y, Gianoutsos MP, Walsh WR. The role of transforming growth factor-beta, insulin-like growth factor I, and basic fibroblast growth factor in distraction osteogenesis of the mandible. J Craniofac Surg. 1999;10:80. doi: 10.1097/00001665-199901000-00016. [DOI] [PubMed] [Google Scholar]
- 52.Hasse A, Porksen M, Schultze S, Engel A, Feyerabend T. Effect of bFGF on regeneration of distracted mandibles after radiation. Mund Kiefer Gesichtschir. 2000;4(Suppl 2):S423. doi: 10.1007/PL00014566. [DOI] [PubMed] [Google Scholar]
- 53.Mehrara BJ, Rowe NM, Steinbrech DS, Dudziak ME, Saadeh PB, McCarthy JG, Gittes GK, Longaker MT. Rat mandibular distraction osteogenesis: II. Molecular analysis of transforming growth factor beta-1 and osteocalcin gene expression. Plast Reconstr Surg. 1999;103:536. doi: 10.1097/00006534-199902000-00026. [DOI] [PubMed] [Google Scholar]
- 54.Ploder O, Kanz F, Randl U, Mayr W, Voracek M, Plenk H., Jr Three-dimensional histomorphometric analysis of distraction osteogenesis using an implanted device for mandibular lengthening in sheep. Plast Reconstr Surg. 2002;110:130. doi: 10.1097/00006534-200207000-00023. [DOI] [PubMed] [Google Scholar]
- 55.Ayoub AF, Richardson W. A new device for microincremental automatic distraction osteogenesis. Br J Oral Maxillofac Surg. 2001;39:353. doi: 10.1054/bjom.2000.0659. [DOI] [PubMed] [Google Scholar]
- 56.Ayoub AF, Richardson W, Barbenel JC. Mandibular elongation by automatic distraction osteogenesis: the first application in humans. Br J Oral Maxillofac Surg. 2005;43:324. doi: 10.1016/j.bjoms.2005.02.008. [DOI] [PubMed] [Google Scholar]
- 57.Ayoub AF, Richardson W, Koppel D, Thompson H, Lucas M, Schwarz T, Smith L, Boyd J. Segmental mandibular reconstruction by microincremental automatic distraction osteogenesis: an animal study. Br J Oral Maxillofac Surg. 2001;39:356. doi: 10.1054/bjom.2001.0658. [DOI] [PubMed] [Google Scholar]
- 58.Kessler P, Neukam FW, Wiltfang J. Effects of distraction forces and frequency of distraction on bony regeneration. Br J Oral Maxillofac Surg. 2005;43:392. doi: 10.1016/j.bjoms.2004.10.015. [DOI] [PubMed] [Google Scholar]
- 59.Kessler PA, Merten HA, Neukam FW, Wiltfang J. The effects of magnitude and frequency of distraction forces on tissue regeneration in distraction osteogenesis of the mandible. Plast Reconstr Surg. 2002;109:171. doi: 10.1097/00006534-200201000-00027. [DOI] [PubMed] [Google Scholar]
- 60.Ploder O, Mayr W, Schnetz G, Unger E, Ewers R, Plenk H. Mandibular lengthening with an implanted motor-driven device: preliminary study in sheep. Br J Oral Maxillofac Surg. 1999;37:273. doi: 10.1054/bjom.1999.0115. [DOI] [PubMed] [Google Scholar]
- 61.Schmelzeisen R, Neumann G, von der Fecht R. Distraction osteogenesis in the mandible with a motor-driven plate: a preliminary animal study. Br J Oral Maxillofac Surg. 1996;34:375. doi: 10.1016/s0266-4356(96)90090-x. [DOI] [PubMed] [Google Scholar]
- 62.Djasim UM, Mathot BJ, Wolvius EB, van Neck JW, van der Wal KGH. Histomorphometric comparison between continuous and discontinuous distraction osteogenesis. J Craniomaxillofac Surg. 2009;37:398. doi: 10.1016/j.jcms.2009.03.006. [DOI] [PubMed] [Google Scholar]
- 63.Djasim UM, Wolvius EB, Bos JA, van Neck HW, van der Wal KG. Continuous versus discontinuous distraction: evaluation of bone regenerate following various rhythms of distraction. J Oral Maxillofac Surg. 2009;67:818. doi: 10.1016/j.joms.2008.08.016. [DOI] [PubMed] [Google Scholar]
- 64.Shetsov VI, Popkov AV. Limb lengthening in automatic mode. Ortop Traumatol Rehabil. 2002;4:403. [PubMed] [Google Scholar]


