Abstract
Background
To determine if metal artefact reduction (MAR) combined with a priori knowledge of prosthesis material composition can be applied to obtain CT-based attenuation maps with sufficient accuracy for quantitative assessment of 18F-fluorodeoxyglucose uptake in lesions near metallic prostheses.
Methods
A custom hip prosthesis phantom with a lesion-sized cavity filled with 0.2 ml 18F-FDG solution having an activity of 3.367 MBq adjacent to a prosthesis bore was imaged twice with a chrome-cobalt steel hip prosthesis and a plastic replica, respectively. Scanning was performed on a clinical hybrid PET/CT system equipped with an additional external 137Cs transmission source. PET emission images were reconstructed from both phantom configurations with CT-based attenuation correction (CTAC) and with CT-based attenuation correction using MAR (MARCTAC). To compare results with the attenuation-correction method extant prior to the advent of PET/CT, we also carried out attenuation correction with 137Cs transmission-based attenuation correction (TXAC). CTAC and MARCTAC images were scaled to attenuation coefficients at 511 keV using a tri-linear function that mapped the highest CT values to the prosthesis alloy attenuation coefficient. Accuracy and spatial distribution of the lesion activity was compared between the three reconstruction schemes.
Results
Compared to the reference activity of 3.37 MBq, the estimated activity quantified from the PET image corrected by TXAC was 3.41 MBq. The activity estimated from PET images corrected by MARCTAC was similar in accuracy at 3.32 MBq. CTAC corrected PET images resulted in nearly 40% overestimation of lesion activity at 4.70 MBq. Comparison of PET images obtained with the plastic and metal prostheses in place showed that CTAC resulted in a marked distortion of the 18F-FDG distribution within the lesion, whereas application of MARCTAC and TXAC resulted in lesion distributions similar to those observed with the plastic replica.
Conclusions
MAR combined with a tri-linear CT number mapping for PET attenuation correction resulted in estimates of lesion activity comparable in accuracy to that obtained with 137Cs transmission-based attenuation correction, and far superior to estimates made without attenuation correction or with a standard CT attenuation map. The ability to use CT images for attenuation correction is a potentially important development because it obviates the need for a 137Cs transmission source, which entails extra scan time, logistical complexity and expense.
Keywords: PET/CT, attenuation correction, metal artefacts, metal artefact reduction, phantoms
INTRODUCTION
Periprosthetic infection following total hip replacement entails substantial morbidity and costs [1]. The infection rate following primary implantation is between approximately 0.2% and 2.2% following revision surgery [2–4]. The ability to distinguish periprosthetic infection from aseptic loosening is critical because the two conditions entail fundamentally different management approaches, with infections requiring systemic antibiotic treatment followed by two-stage revision surgery, and aseptic loosening typically requiring a single revision surgery. 18F-fluoro-2-deoxyglucose positron emission tomography (FDG-PET) is a potentially important tool for visualizing sites of periprostheic infection [5]. Enhanced uptake of FDG reflects the metabolic activity of hyperglycolytic inflammatory cells (leukocytes, macrophages, and other immunologically active cells) during infection and the lesion contrast of FDG-PET is relatively unaffected by antibiotic treatment because FDG does not rely on leukocyte migration. Moreover, FDG-PET is widely available and can be carried out with a single injection [6].
The quantitative assessment of PET tracer uptake in deep internal structures such as the proximal femur requires photon attenuation correction (AC) to prevent the false decrease of estimated tracer activity due to the absorption of photons by surrounding tissues. Non-uniform attenuation maps derived with external transmission scans have been available since the beginning of PET, but the low photon statistics in these maps increases the noise of the corresponding PET images, and the long scanning times add to the patient burden [7]. In contrast, the spatially-matched CT image provided by PET/CT scanners provides the distribution of linear attenuation coefficients within the cross-section being imaged by PET. The linear attenuation coefficients are obtained at the effective energy of the CT system, but can be straightforwardly converted to the equivalent values at 511 keV.
Deriving the attenuation maps from the matched CT image has the advantage of low noise and rapid acquisition time, which improves patient comfort and clinical throughput [8]. However, the accuracy of CT-derived attenuation maps for quantitative analysis of PET images can be impaired when metallic objects, such as hip or knee prostheses, cardiac pacemakers or spinal cages, are contained in the field-of-view [9]. Due to their high average atomic number, these objects sharply attenuate x-ray photons, resulting in gaps in the projection data that lead to streak artefacts in the reconstructed CT images, diminishing their quality as well as compromising their utility for attenuation correction [10, 11]. Vanquickenborne et al. demonstrated that conventional FDG-PET (where transmission sources were available for attenuation correction but not CT) could be used to diagnose infection in this scenario, with or without an additional 99mTc-MDP SPECT scan [12]. The authors claimed that attenuation correction unavoidably introduced artifacts near a metal prosthesis since the cause of the problem was fundamental and could not be avoided. As such, they specifically recommended the use of non-attenuation corrected PET (NAC), which they asserted to be both sensitive and specific in clinical conditions.
Because the matched CT image available in PET/CT scanners provides the possibility of an aligned attenuation map, metal artifact reduction (MAR) strategies have been considered essential to reduce the impact of prostheses and other structures in quantitative PET imaging [13]. MAR strategies have employed a range of approaches to improve the quality and quantitative accuracy of CT reconstructions. Projection-based approaches modify the metal-containing data bins in the raw sinogram data. These approaches typically operate by segmenting the metal implant in the reconstructed CT image and forward projecting the “metal image” into the sinogram [14]. The metal-affected sinogram data elements may then be deleted and interpolation techniques used to replace these deleted elements by estimates based on the surrounding non-affected tissue elements [15–17]. Image-based methods operate directly on the reconstructed image, including adaptive filtering [18], iterative deblurring [19], and wavelet-based techniques [20] to delineate the boundaries of the implant and estimate the CT numbers of the tissue elements impacted by the artefacts. Algebraic and statistical iterative correction techniques operate on the projection data, iteratively recalculating and then forward-projecting the image to minimize the difference between the forward-projected image and the measured projection data [21, 22]. While projection data–based approaches offer computational simplicity and reasonable accuracy, iterative methods offer the advantages of improving reconstruction accuracy by incorporating models of scanner physics into the reconstructions as well as being able to exclude metal-affected ray-paths from the reconstruction. Both of these general methods for metal artefact reduction have now been incorporated into commercial CT scanners, with notable examples being the Metal Artifact Reduction algorithm employed in GE systems, which employs a projection-based method (Smart Metal Artifact Reduction, GE Medical Systems, Milwaukee, WI USA), and the Orthopaedic Metal Artifact Reduction (O-MAR) incorporated in Phillips Medical Systems CT scanners, which uses a proprietary iterative algorithm [23].
As a result, the application of MAR techniques to support the use of CT-based attenuation correction in PET imaging of patients with metallic structures in the field-of-view has been of great interest [9]. A variety of MAR approaches, based on both projection- and image-based methods, have been employed to improve image quality in various clinical applications, including cardiac PET imaging [24] as well as imaging around orthopaedic implants [13, 25–27] Recent studies examined various MAR approaches to reduce metallic attenuation artifacts in PET images in hip prostheses, where the ability to depict small lesions of increased uptake on the prosthesis boundary is critical [26, 27]. These studies determined that implementation of a projection image-based approach resulted in reasonable estimates of tracer activity distribution in both clinical and phantom studies. Moreover, PET/MR phantom studies using MR imaging with metal-suppressing sequences to depict the tissue around the prosthesis have demonstrated that it is possible to quantify PET uptake in lesions surrounding hip prostheses [28, 29]. Thus, although metal artefact reduction improves the quality of PET radiotracer distributions around prostheses, and PET/MR imaging has shown improved quantitation of lesion uptake, there have been no studies documenting that PET/CT with metal artefact reduction results in improved quantitative accuracy of lesion uptake estimation at the prosthetic boundary. Therefore, the goal of our study was to establish the quantitative accuracy of MAR-corrected CT attenuation maps for quantitative accuracy of lesion uptake measured by PET in a hip phantom containing a metallic prosthesis bordered by cortical bone regions containing simulated lesions.
MATERIALS METHODS
Phantom Description
A custom-manufactured (CIRS Inc., Norfolk VA.) hip prosthesis phantom that had been designed for a previous CT-MAR study was utilized. A more detailed description of the phantom and its use in the CT-MAR study can be found in [14], but briefly the phantom consisted of a 10 cm diameter cylinder of Plastic Water® LR (PW-LR) surrounding a simulated proximal femur with resected neck. The simulated femur was composed of polymethyl methacrylate with an admixture of 600 mg/cm3 calcium hydroxyapatite. The average voxel value of the PW-LR cylinder was measured to be 2 [HU], and the average value of simulated bone was 850 [HU]. A removable conical insert (of the same material as the femur) with a press-fit bore at the centre allowed gapless insertion of a metallic hip prosthesis stem into the simulated femur (Figure 1). To allow placement of activity adjacent to the prosthetic stem, we modified the phantom by drilling a small sealable cylindrical cavity (diameter = 5 mm, volume = 0.2 mL) into the top of the conical insert in the axial direction 5 mm from the edge of the prosthetic stem bore. To provide a reference phantom for artefact-free CT images, a replica of the hip prosthesis was made using a tin-cure silicon rubber mold, and a urethane resin (Smooth-Cast® 305, Smooth-On Inc., Easton, PA), which had an average CT image value of 94 [HU]. We developed this plastic replica in order to provide a more continuous attenuation profile and thus prevent possible beam hardening artifacts that would result from ray-paths intersecting the bone/air boundary.
Figure 1.
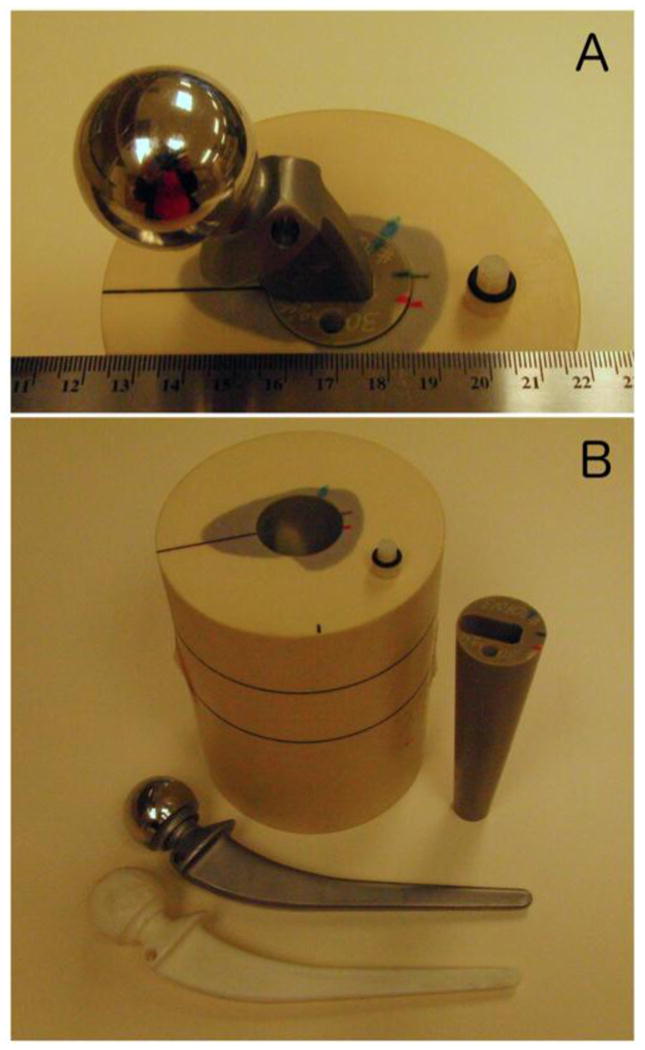
Photographs of the hip phantom. In (A) the metal prosthesis is inserted into the bone mimicking cone, which is inserted into the simulated proximal femur embedded in the Plastic Water cylindrical body of the phantom. The 5 mm diameter cavity where activity was injected is visible toward the bottom of (A). In (B) the phantom has been disassembled into its constituent components; Plastic Water cylinder with simulated proximal femur inlay, conical bone mimicking insert with cylindrical cavity and pressfit-prosthesis bore, metal prosthesis, and plastic prosthesis replica.
PET, CT, and 137Cs-TX Data Acquisition
Data acquisition was performed at the Children’s Hospital of the University of Pennsylvania (Philadelphia, PA). In the phantom, the cavity abutting the prosthetic stem was filled with aqueous 3.37 MBq 18F-FDG solution and sealed. PET emission, CT, and 137Cs transmission data were acquired on a Philips Gemini TF whole-body PET/CT hybrid scanner (Philips Healthcare, Cleveland, OH) equipped with a 16-slice CT unit and a rotating 137Cs transmission source. Two scan sets were acquired; one with the metal prosthesis in place, and one with the plastic replica in place. The PET emission acquisition time was 180 sec. during the scan with the metal prosthesis in place, and began 62 min. after the injection of 18F-FDG. The PET image of the plastic replica was acquired 127 min. after the injection of 18F-FDG with a 600 sec. acquisition time to account for decay. CT data were acquired with 120kVp, 325 mAs, 0.5 sec. rotation time, detector array slice configuration of 16 × 0.75 mm, and pitch of 0.813. 137Cs transmission-based attenuation correction (TXAC) data were acquired with the scanner operating in singles acquisition mode for 136 sec. We acquired TXAC images because they allowed us to compare the CT attenuation maps to a method extant prior to the advent of PET/CT and which produced images that were acquired at a resolution similar to the native PET resolution, and that provided an attenuation map at 662 keV, which is close to the 511-keV energies of the annihilation quanta. Finally, model-based scatter correction using the single-scatter simulation technique was applied using the transmission image and the corrected CT data for both reconstructions, respectively[30]. All image data were subsequently transferred to the University of California, San Francisco for CT and PET reconstruction and data analysis.
CT Reconstruction and Metal Artefact Reduction
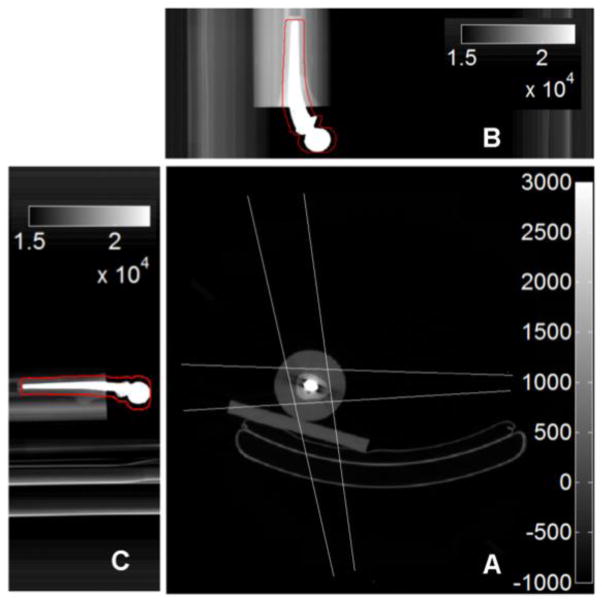
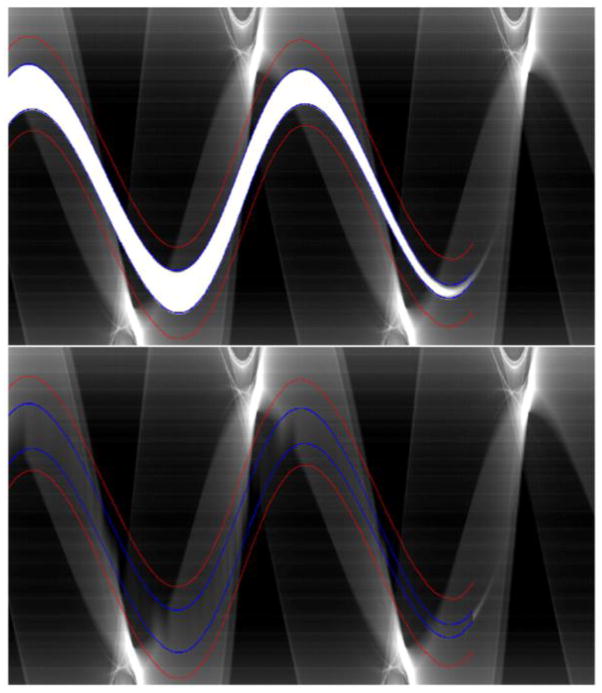
CT projection data were transferred to a PC workstation for MAR and image reconstruction. Native image slices were reconstructed on a 512 × 512 × 79 matrix with an axial field-of-view (FOV) of 60 cm to a resolution of 1.17 × 1.17 × 2.5 mm3 using the Philips ADI_RECON package, which allows the clinical scanner’s reconstruction algorithms to be run on a standard PC equipped with MATLAB (v7.0; The Mathworks, Natick, Mass). For metal artefact reduction, we modified software that had been previously developed by our group and employed to reconstruct CT images of the phantom described above. The method was similar to the early method proposed by Kalender et al. [10], where, briefly, detector elements falling in the shadow of metallic objects are identified in the raw projection data, and their values replaced via linear interpolation between more reliable data, for each affected view and detector row. Although many previous studies have initially identified the metallic regions on the reconstructed cross-sections and subsequently reprojected those regions into sinograms [31, 32], this approach was not feasible for our application due to the high CT numbers of bone and the metal artefacts themselves. Therefore, we employed a novel approach to avoid initial segmentation in the cross-sectional images. Our approach first segments the prosthesis in the anteroposterior and lateral scout views (Figure 2-B, C). Backprojection of the two segmented regions into the native reconstructed image space yields a series of trapezoidal regions (Figure 2-A). The vertices of these regions are then reprojected into CT sinogram space to define regions in which to search for affected detector elements at each axial z position of the sinogram (SRz) for each combination of view and detector row (Figure 3). The potential advantage of this method over direct segmentation in sinogram space is the wider axial base of the scout views, which allows for simple threshold-based segmentation. For the final segmentation of the metal shadow in sinogram space, transaxial profiles of detector row readout values were extracted at each projection z position bounded by the respective search region (SRz) (Figure 4). The first and second derivative of the profile were computed, and if the magnitude of the first derivative exceeded a heuristically determined threshold, then the location of the largest positive value of the profile’s second derivative (the point with the greatest upward curvature) on each side of the center of the profile was considered to be an edge of the metal affected region. If no large first derivative was found, then the center and 8 adjacent elements were considered to be within the metal affected region. A corrected sinogram was synthesized by replacing projection data corresponding to each metal affected region by linearly interpolating between data located just outside the region. The corrected sinogram was then reconstructed in the same way as the native images were reconstructed to yield a corrected image. Finally, a mask of the prosthesis was made in the native image by thresholding, and the mask was used to set the prosthesis voxels of the corrected image (whose intensities were in scaled Hounsfield units of [HU + 1000]) to the nominal value of 4000, which was chosen since it was larger than the intensities of simulated bone or PW-LR, but still small enough to be represented as a 12-bit unsigned integer on the shifted Hounsfield scale [HU + 1000] used in the reconstruction pipeline in place on the scanner (Figure 5-C).
Figure 2.
Anteroposterior (B) and Lateral (C) scoutviews of the prosthesis phantom with dilated segmentations of the metal prosthesis in red outline. In (A), backprojections of the regions in (B) and (C) intersect to form trapezoidal regions that define the search regions SRz for the metal prosthesis.
Figure 3.
Sinogram before (top) and after (bottom) interpolation. The search region SRz is marked in red, and edges in blue.
Figure 4.
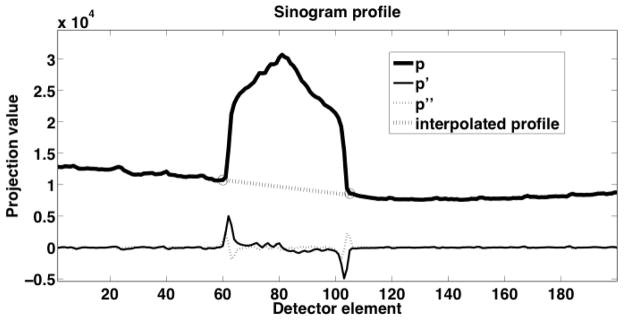
Profile (p) of attenuation within the search region on one detector row. The first two derivatives (p′ and p″) of the profile were used to determine the edges (marked with circles) of the metal trace in the sinogram. The dashed line indicates the linearly interpolated values that replace metal affected detector elements.
Figure 5.
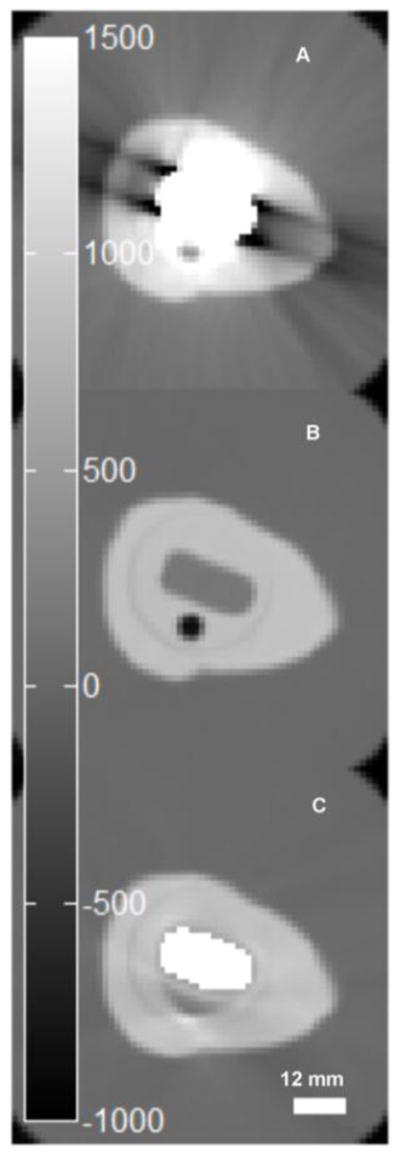
Original reconstruction of CT image with metal prosthesis in place (A), plastic replica (B), and MAR CT with mask of metal set to 3000 [HU] (C).
CT and 137Cs-TX Attenuation Correction and PET Image Reconstruction
PET emission and transmission data were transferred to a PC workstation for reconstruction. Using software modules provided by Philips, the reconstruction pipeline that was in place on the Gemini TF acquisition scanner was duplicated. The Philips Gemini reconstruction workflow is described in greater detail in [33], but a brief explanation is given below. We deviated from the scanner’s default method where MAR was applied in the CT image reconstruction process, in the mapping of CT image values to AC image values, and in electing not to apply further segmentation to the AC images, as is evaluated in [34]
Both CT and 137Cs transmission images were used for attenuation correction of PET emission data. In cases where CT images were used, attenuation correction sinograms were produced via the following sequence of operations: CT images were resampled to the PET image matrix, which was 144 × 144 × 45, with a resolution of 4 × 4 × 4 mm3. The resampled CT image was aligned to the PET image, and it’s resolution matched to that of the PET image by applying Gaussian filters in both axial and transaxial directions. CT numbers from the resultant image were mapped to linear attenuation coefficients (LACs) at 511 keV using the method detailed later. Finally, the resultant image was projected into the space of the PET emission data to produce a sinogram of attenuation correction factors. When transmission images were used for AC, the alignment, resampling, and blurring (that was performed in the cases where CT images were used) was not needed/performed since the transmission data was acquired with the same detector array as the PET data, and the transmission images were reconstructed directly into the PET image matrix. Linear mapping of transmission image attenuation coefficients from 662 to 511 keV was carried out as described in [35]
A 3D (row-action maximum-likelihood algorithm) RAMLA algorithm [36, 37] with spherically-symmetric basis functions (blobs) was used to reconstruct PET images using the emission and attenuation correction sinograms. The RAMLA algorithm was run for 1 iteration. The relaxation parameter was [λ = 0.045], and the blobs were Bessel functions of order 2, radius [a = 2.5 mm], and shape parameter [α = 8.63]. Also, Scatter correction was applied using the transmission image and the corrected CT data for both reconstructions, respectively.
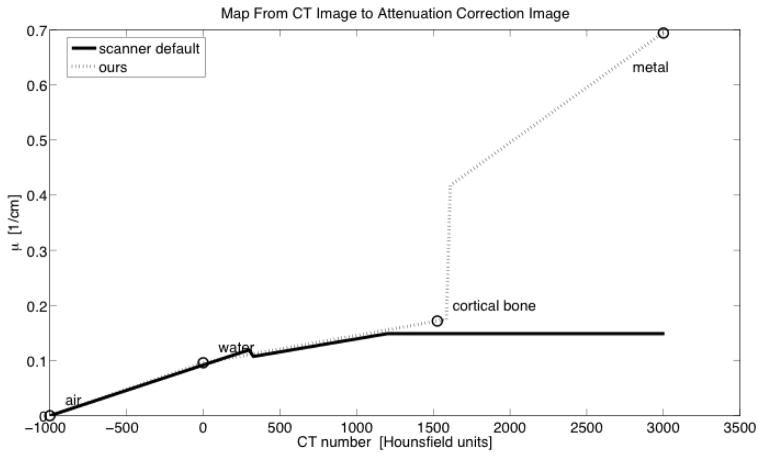
Different approaches to mapping attenuation coefficients from the raw attenuation images to equivalent values for 511 keV were employed for transmission and CT-based attenuation maps. In cases where transmission images were used for AC, we employed the duplicated clinical reconstruction pipeline without alteration. In cases where CT images were used for AC, we modified the mapping from CT number to LAC. We constructed a piecewise linear map from CT number to μ511 (Figure 6) using the water-A assumption described in [38], where all image voxels were considered to be composed of some mixture of water and air or water and cortical bone, but extended the method to accommodate the presence of metal in the FOV by adding the possibility that voxels could be composed of a mixture of water and the prosthesis material. This trilinear map was described by the following equations:
where
Figure 6.
Comparison of functions used to map CT number to μ511 in production of attenuation correction images.
CTair = −1000
CTwater = 0
CTmetal = 3000
In constructing the attenuation map, we assumed an effective energy of 74 keV for the CT’s x-ray source (operated at 120 kVp for all scans). We interpolated values from the NIST x-ray mass attenuation coefficient tables [39] to get the LACs of air, water, bone, and the prosthesis material at 74 keV and 511 keV, where the alloy composition of the prosthesis (Cr 0.28, Mo 0.06, Co 0.66) was obtained from the prosthesis manufacturer (Smith and Nephews, London, UK).
Figure 7 shows versions of the attenuation correction images produced by applying the trilinear attenuation map to CT images along with the AC images reconstructed from the 137Cs transmission data.
Figure 7.

A region containing the phantom in attenuation correction images in units of cm−1 originating from (A) the metal prosthesis transmission scan (TXAC), (B) the original metal prosthesis CT image (CTAC), (C) the MARCTAC image, (D) the plastic prosthesis transmission scan, and (E) the plastic prosthesis CT image.
In lieu of using a scanner calibration factor, in order to determine scanner efficiency, and to place images reconstructed with TXAC vs. CTAC on the same scale, we used the known activity injected into the lesion with the plastic prosthesis in place. Reconstructing this image using TXAC, we calculated a scaling factor that related the total activity in the image of the simulated lesion to the known activity (after decay correction) injected into the lesion. We applied the determined factor to all PET images reconstructed using TXAC. We scaled the images reconstructed with CTAC in the same way, but determined the scaling factor starting with the plastic prosthesis image reconstructed with CTAC.
Quantitative Analysis
To characterize the effect of MAR and PET AC on quantification of uptake, we computed the total lesion activity in the image. This measure was obtained by summing voxel values within a region in the image determined by region growing on the PET image, starting from seed voxels whose values were at least 90% that of the maximum value in the image and growing the region with a stopping criterion established as a threshold just above background noise levels. We employed this method because it allowed the extent of the region of interest to vary spatially, which is desirable because the AC method influences the spatial distribution of activity as it is reflected in reconstructed images. For each correction approach, we report the total activity in the lesion, and, as a measure of accuracy, the ratio of total activity measured in the image with the metal prosthesis in place to the total injected activity, with all measurements corrected for radioactive decay. In the case of the metal prosthesis image reconstructed without attenuation correction, we present the ratio of the total activity to that of the reconstructed plastic prosthesis image without AC.
RESULTS
Figure 5 shows the metallic artefact and the effect of MAR on the CT image. The severe artefact observed in Figure 5-A is removed by MAR as shown in Figure 5-C. Although the effect of the prosthesis is clearly reduced, there is some distortion of the geometry of the small lesion shown in Figure 5-B, which was obtained on the plastic reference prosthesis. The spatial extent of the in-painted metal prosthesis in Figure 5-C also deviates slightly from that of the plastic prosthesis in Figure 5-B. In the slice shown, the area of the plastic prosthesis is 155 mm2, and the in-painted metal is slightly oversized at 174 mm2. As a result, there are a few trajectories from the cavity to the detector array that pass through up to 2 extra CT voxels (~2.34 mm) that are mapped as metal when they might otherwise be mapped as bone.
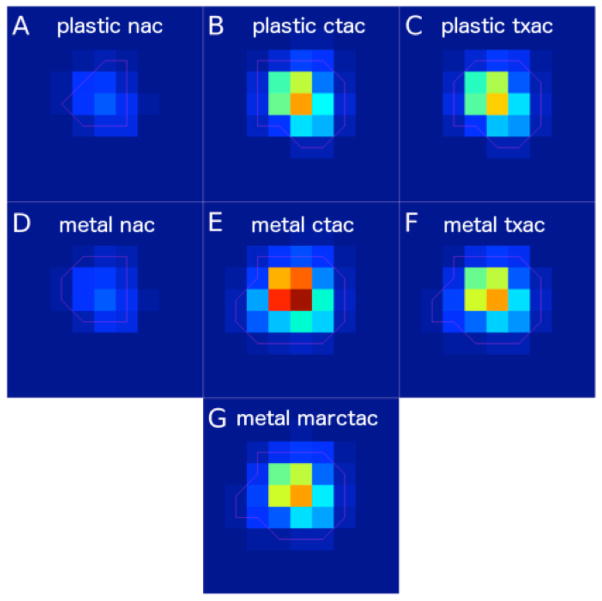
Figure 8 shows PET images reconstructed without and with attenuation correction using different attenuation maps. The left hand column shows emission maps obtained with a plastic prosthesis (8-A) and a metal prosthesis (8-D), both without attenuation correction. Though there is little visually apparent difference in the distribution of activity between the two non attenuation corrected images, the total measured activity in the image with the metal prosthesis in place was 78% that of the image with the plastic prosthesis inserted into the phantom.. The center column shows CT attenuation correction with the plastic prosthesis in place (8-B), CT attenuation with the metal prosthesis in place without MAR (8-E) and with MAR (8-G). The distribution of activity in the MAR-based emission map is clearly similar to that observed with the plastic prosthesis in place, and it is clear that the use of the uncorrected map results in distortion of the PET image, with highly overestimated activity in the centre of the lesion. Finally, the right hand column shows images obtained with transmission-based attenuation correction. The emission images obtained with the plastic (8-C) and metal (8-F) exhibit a similarity to each other as well as to the images obtained with CT/MAR. Figure 9 shows CT images obtained with CT and MARCTAC with the PET image of the lesion superimposed in color.
Figure 8.
A region of the reconstructed PET images centered on the cavity where FDG was injected. In the first row are images reconstructed from scans where the plastic prosthesis was in place with no-attenuation-correction (NAC) in (A), CTAC in (B), and TXAC in (C). The second and third rows contain images reconstructed from data where the metal prosthesis was in place, with NAC in (D), CTAC in (E), TXAC in (F), and MARCTAC in (G).
Figure 9.
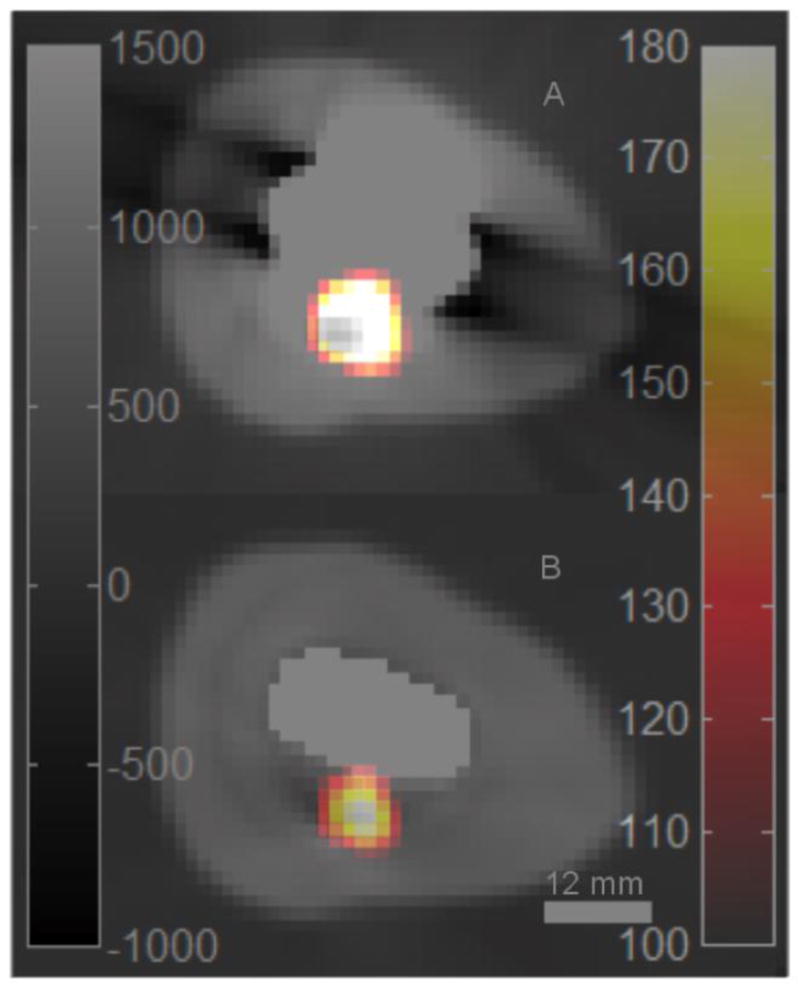
PET images of simulated lesion overlaid on CT images of the prosthesis phantom. (a) No attenuation correction. (b) with MARCTAC.
Table 1 shows the estimated lesion activities obtained with different attenuation correction strategies. Compared to the reference activity of 3.37 MBq, the estimated activity quantified from the PET image corrected by TXAC was 3.41 MBq. The activity estimated from PET images corrected by MAR CT AC was similar in accuracy at 3.32 MBq. CTAC corrected PET images resulted in nearly 40% overestimation of lesion activity at 4.70 MBq.
Table 1.
Measurements of total activity in lesion with metal prosthesis in place from PET images using different types of attenuation correction.
| TXAC | CT AC | MAR CT AC | |
|---|---|---|---|
| Decay corrected total activity in imaged lesion [MBq] | 3.41 | 4.70 | 3.32 |
| Reference Activity [MBq] | 3.37 | 3.37 | 3.37 |
| Ratio to reference activity | 1.01 | 1.40 | 0.99 |
TXAC: transmission line source correction, CT AC: CT based attenuation correction MAR CT AC: CT based attenuation correction using MAR. The last row gives the ratio of imaged activity to reference activity.
DISCUSSION
This study aimed to evaluate combined PET/CT imaging in conjunction with a CT reconstruction method that reduces metal artifacts. Our approach involves the use of a projection-based MAR algorithm to reduce attenuation artefacts in CT images of a phantom containing a hip prosthesis contained in a simulated human proximal femur in which lesions of known location and volume were placed in the surrounding cortical shaft. We demonstrated that application of the MAR approach described in the study sharply improved the quality of the CT image and the resulting attenuation map, permitting accurate estimation of the known activity concentration in the simulated lesion. Compared to the large errors and significant uptake artefacts observed found in the PET images obtained with standard CT AC, the error of the lesion activity estimate using the CT-MAR attenuation map was comparable to that of PET images obtained using standard CT AC with the metallic prosthesis replaced by a plastic model. It was also comparable to that obtained with 137Cs-based transmission attenuation correction. We also observed that application of CT-MAR resulted in a distribution of activity within the lesion comparable to that obtained with the plastic prosthesis and with the transmission-based attenuation correction.
While the described MAR approach was sufficient to result in accurate lesion activity estimates, the corrected CT images showed slight geometric distortions. Although the overall bone shape and the shape of the prosthesis were accurately depicted, subtle features such as the shape of the lesion itself were distorted. It is possible that this slight distortion was due to errors in the relatively simple schemes used to identify the prosthesis boundary and interpolate across metal affected data in the CT sinogram. Other studies have described more sophisticated approaches to CT MAR [9, 31, 32, 40]. One of these approaches involves the generation of a virtual sinogram from a thresholded image of the prosthesis in the reconstructed CT cross-section, followed by cubic Clough-Tocher interpolation on an irregular grid, as proposed by Abdoli et al. [32]. Such approaches, when applied to our phantom images, may eventually serve to remove the remaining distortions in the CT. While this may be an issue for the use of attenuation correction to produce PET images of optimal quality for visual assessment of relatively subtle image features in PET, it does not appear to have substantially impacted our task of estimating total concentration of tracer in the simulated osteolytic lesion. Ultimately, the accuracy of the CT-derived PET attenuation factors are based on line integrals, in the PET geometry, across the attenuation map, which tends to average out small inaccuracies in the CT image. Mehranian et al. [40] performed a comprehensive comparison of various MAR techniques concluding that their recently introduced MAR technique outperforms those reported in the literature. Such a comparative study is outside the scope of this work.
While this study had important strengths, such as the application of the projection-based MAR approach, the use of a plastic prosthesis to provide a gold standard reference image, and the use of simulated osteolytic lesions to simulate a clinical scenario, it also had limitations. The primary limitation of this study is that it was based on use of a single PET/CT system to acquire images of a single phantom incorporating a small lesion on the periphery of the prosthesis. The small lesion size in our experiment introduces partial volume averaging errors, which could limit the relevance of our findings to other lesion sizes and shapes, and which may also limit their extension to other PET/CT systems. Along the same vein, the solid material of our phantom did not allow for a background concentration of tracer to be present in the vicinity of the simulated lesion, so partial volume errors due to background spill-in could not be assessed either. Additionally, the Co-Cr-Mo implant in our study has higher attenuation than the stainless steel and titanium implants that are also employed, which may result in differences in the performance of the metal artefact correction algorithm as well as in attenuation of the emitted radiation. Our study did not take into account the full variability of proximal femoral geometry across patients. Proximal femora of clinical subjects may have different geometries compared to our phantom, and the bone density may be lower or more variable, or have degenerative conditions, which may impact the segmentation program. The CT image is obtained with the entire pelvis in the field of view, which may also complicate the attenuation correction process compared to our unilateral phantom. Applying this approach, or more complicated approaches to future clinical scans will clarify the extent to which these problems will affect the performance of our approach, and will suggest further changes to the technique.
CONCLUSIONS
In this phantom study, we have provided data to support the feasibility of using MAR to improve the quantitative accuracy of PET images obtained with CT images of objects containing artefact-causing metallic implants. While this study involved a single phantom, and did not simulate the full range of body sizes and geometries, and MAR approach still leaves some residual distortions in the corrected CT image, we observed that the image is of sufficient quality for accurate attenuation correction. Translation of this approach to generate CT-based attenuation maps may permit quantitative FDG-PET imaging of prosthetic infection without need for the extra expense, time and logistical complications associated with external transmission sources.
Acknowledgments
This study was supported by grants R21-AR055253 and R01-AR048241, National Institute of Arthritis, Musculoskeletal and Skin Diseases.
Footnotes
CONFLICT OF INTEREST
None to declare
Contributor Information
Roy Harnish, Email: Roy.Harnish@ucsf.edu.
Sven Prevrhal, Email: Sven.Prevrhal@philips.com.
Abass Alavi, Email: Abass.Alavi@uphs.upenn.edu.
Habib Zaidi, Email: Habib.Zaidi@hcuge.ch.
Thomas Lang, Email: Thomas.Lang@ucsf.edu.
References
- 1.Namba RS, Inacio MC, Paxton EW. Risk factors associated with surgical site infection in 30,491 primary total hip replacements. J Bone Joint Surg Br. 2012;94:1330–8. doi: 10.1302/0301-620X.94B10.29184. 94-B/10/1330 [pii] [DOI] [PubMed] [Google Scholar]
- 2.Leekha S, Sampathkumar P, Berry DJ, Thompson RL. Should national standards for reporting surgical site infections distinguish between primary and revision orthopedic surgeries? Infection control and hospital epidemiology: the official journal of the Society of Hospital Epidemiologists of America. 2010;31:503–8. doi: 10.1086/652156. [DOI] [PubMed] [Google Scholar]
- 3.Mahomed NN, Barrett JA, Katz JN, Phillips CB, Losina E, Lew RA, et al. Rates and outcomes of primary and revision total hip replacement in the United States medicare population. The Journal of bone and joint surgery. 2003;85-A:27–32. doi: 10.2106/00004623-200301000-00005. American volume. [DOI] [PubMed] [Google Scholar]
- 4.Ridgeway S, Wilson J, Charlet A, Kafatos G, Pearson A, Coello R. Infection of the surgical site after arthroplasty of the hip. The Journal of bone and joint surgery British volume. 2005;87:844–50. doi: 10.1302/0301-620X.87B6.15121. [DOI] [PubMed] [Google Scholar]
- 5.Kwee TC, Kwee RM, Alavi A. FDG-PET for diagnosing prosthetic joint infection: systematic review and metaanalysis. European journal of nuclear medicine and molecular imaging. 2008;35:2122–32. doi: 10.1007/s00259-008-0887-x. [DOI] [PubMed] [Google Scholar]
- 6.Chryssikos T, Parvizi J, Ghanem E, Newberg A, Zhuang H, Alavi A. FDG-PET imaging can diagnose periprosthetic infection of the hip. Clinical orthopaedics and related research. 2008;466:1338–42. doi: 10.1007/s11999-008-0237-0. [DOI] [PMC free article] [PubMed] [Google Scholar]
- 7.Zaidi H, Hasegawa BH. Determination of the attenuation map in emission tomography. J Nucl Med. 2003;44:291–315. [PubMed] [Google Scholar]
- 8.Kinahan PE, Hasegawa BH, Beyer T. X-ray-based attenuation correction for positron emission tomography/computed tomography scanners. Semin Nucl Med. 2003;33:166–79. doi: 10.1053/snuc.2003.127307. [DOI] [PubMed] [Google Scholar]
- 9.Abdoli M, Dierckx RAJO, Zaidi H. Metal artifact reduction strategies for improved attenuation correction in hybrid PET/CT imaging. Med Phys. 2012;39:3343–60. doi: 10.1118/1.4709599. [DOI] [PubMed] [Google Scholar]
- 10.Kalender WA, Hebel R, Ebersberger J. Reduction of CT artifacts caused by metallic implants. Radiology. 1987;164:576–7. doi: 10.1148/radiology.164.2.3602406. [DOI] [PubMed] [Google Scholar]
- 11.Goerres GW, Ziegler SI, Burger C, Berthold T, Von Schulthess GK, Buck A. Artifacts at PET and PET/CT caused by metallic hip prosthetic material. Radiology. 2003;226:577–84. doi: 10.1148/radiol.2262012141. [DOI] [PubMed] [Google Scholar]
- 12.Vanquickenborne B, Maes A, Nuyts J, Van Acker F, Stuyck J, Mulier M, et al. The value of (18)FDG-PET for the detection of infected hip prosthesis. European journal of nuclear medicine and molecular imaging. 2003;30:705–15. doi: 10.1007/s00259-002-1109-6. [DOI] [PubMed] [Google Scholar]
- 13.Kennedy JA, Israel O, Frenkel A, Bar-Shalom R, Azhari H. The reduction of artifacts due to metal hip implants in CT-attenuation corrected PET images from hybrid PET/CT scanners. Medical & biological engineering & computing. 2007;45:553–62. doi: 10.1007/s11517-007-0188-8. [DOI] [PubMed] [Google Scholar]
- 14.Rinkel J, Dillon WP, Funk T, Gould R, Prevrhal S. Computed tomographic metal artifact reduction for the detection and quantitation of small features near large metallic implants: a comparison of published methods. Journal of computer assisted tomography. 2008;32:621–9. doi: 10.1097/RCT.0b013e318149e215. [DOI] [PubMed] [Google Scholar]
- 15.Kalender WA, Hebel R, Ebersberger J. Reduction of CT artifacts caused by metallic implants. Radiology. 1987;164:576–7. doi: 10.1148/radiology.164.2.3602406. [DOI] [PubMed] [Google Scholar]
- 16.Watzke O, Kalender WA. A pragmatic approach to metal artifact reduction in CT: merging of metal artifact reduced images. European radiology. 2004;14:849–56. doi: 10.1007/s00330-004-2263-y. [DOI] [PubMed] [Google Scholar]
- 17.Mahnken AH, Raupach R, Wildberger JE, Jung B, Heussen N, Flohr TG, et al. A new algorithm for metal artifact reduction in computed tomography: in vitro and in vivo evaluation after total hip replacement. Investigative radiology. 2003;38:769–75. doi: 10.1097/01.rli.0000086495.96457.54. [DOI] [PubMed] [Google Scholar]
- 18.Bal M, Spies L. Metal artifact reduction in CT using tissue-class modeling and adaptive prefiltering. Medical physics. 2006;33:2852–9. doi: 10.1118/1.2218062. [DOI] [PubMed] [Google Scholar]
- 19.Wang G, Snyder DL, O’Sullivan JA, Vannier MW. Iterative deblurring for CT metal artifact reduction. IEEE transactions on medical imaging. 1996;15:657–64. doi: 10.1109/42.538943. [DOI] [PubMed] [Google Scholar]
- 20.Zhao S, Robertson DD, Wang G, Whiting B, Bae KT. X-ray CT metal artifact reduction using wavelets: an application for imaging total hip prostheses. IEEE transactions on medical imaging. 2000;19:1238–47. doi: 10.1109/42.897816. [DOI] [PubMed] [Google Scholar]
- 21.Morsbach F, Bickelhaupt S, Wanner GA, Krauss A, Schmidt B, Alkadhi H. Reduction of metal artifacts from hip prostheses on CT images of the pelvis: value of iterative reconstructions. Radiology. 2013;268:237–44. doi: 10.1148/radiol.13122089. [DOI] [PubMed] [Google Scholar]
- 22.Verburg JM, Seco J. CT metal artifact reduction method correcting for beam hardening and missing projections. Physics in medicine and biology. 2012;57:2803–18. doi: 10.1088/0031-9155/57/9/2803. [DOI] [PubMed] [Google Scholar]
- 23.Hilgers G, Nuver T, Minken A. The CT number accuracy of a novel commercial metal artifact reduction algorithm for large orthopedic implants. Journal of applied clinical medical physics/American College of Medical Physics. 2014;15:4597. doi: 10.1120/jacmp.v15i1.4597. [DOI] [PMC free article] [PubMed] [Google Scholar]
- 24.Ghafarian P, Aghamiri SM, Ay MR, Rahmim A, Schindler TH, Ratib O, et al. Is metal artefact reduction mandatory in cardiac PET/CT imaging in the presence of pacemaker and implantable cardioverter defibrillator leads? European journal of nuclear medicine and molecular imaging. 2011;38:252–62. doi: 10.1007/s00259-010-1635-6. [DOI] [PubMed] [Google Scholar]
- 25.Abdoli M, Ay MR, Ahmadian A, Zaidi H. A virtual sinogram method to reduce dental metallic implant artefacts in computed tomography-based attenuation correction for PET. Nuclear medicine communications. 2010;31:22–31. doi: 10.1097/MNM.0b013e32832fa241. [DOI] [PubMed] [Google Scholar]
- 26.Abdoli M, de Jong JR, Pruim J, Dierckx RA, Zaidi H. Reduction of artefacts caused by hip implants in CT-based attenuation-corrected PET images using 2-D interpolation of a virtual sinogram on an irregular grid. European journal of nuclear medicine and molecular imaging. 2011;38:2257–68. doi: 10.1007/s00259-011-1900-3. [DOI] [PMC free article] [PubMed] [Google Scholar]
- 27.Abdoli M, Dierckx RA, Zaidi H. Metal artifact reduction strategies for improved attenuation correction in hybrid PET/CT imaging. Medical physics. 2012;39:3343–60. doi: 10.1118/1.4709599. [DOI] [PubMed] [Google Scholar]
- 28.Delso G, Wollenweber S, Lonn A, Wiesinger F, Veit-Haibach P. MR-driven metal artifact reduction in PET/CT. Physics in medicine and biology. 2013;58:2267–80. doi: 10.1088/0031-9155/58/7/2267. [DOI] [PubMed] [Google Scholar]
- 29.Ladefoged CN, Andersen FL, Keller SH, Lofgren J, Hansen AE, Holm S, et al. PET/MR imaging of the pelvis in the presence of endoprostheses: reducing image artifacts and increasing accuracy through inpainting. European journal of nuclear medicine and molecular imaging. 2013;40:594–601. doi: 10.1007/s00259-012-2316-4. [DOI] [PubMed] [Google Scholar]
- 30.Accorsi R, Adam LE, Werner ME, Karp JS. Optimization of a fully 3D single scatter simulation algorithm for 3D PET. Physics in medicine and biology. 2004;49:2577–98. doi: 10.1088/0031-9155/49/12/008. [DOI] [PubMed] [Google Scholar]
- 31.Abdoli M, Ay M, Ahmadian A, Dierckx R, Zaidi H. Reduction of dental filling metallic artefacts in CT-based attenuation correction of PET data using weighted virtual sinograms optimized by a genetic algorithm. Med Phys. 2010;37:6166–77. doi: 10.1118/1.3511507. [DOI] [PubMed] [Google Scholar]
- 32.Abdoli M, de Jong JR, Pruim J, Dierckx RA, Zaidi H. Reduction of artefacts caused by hip implants in CT-based attenuation-corrected PET images using 2-D interpolation of a virtual sinogram on an irregular grid. Eur J Nucl Med Mol Imaging. 2011;38:2257–68. doi: 10.1007/s00259-011-1900-3. [DOI] [PMC free article] [PubMed] [Google Scholar]
- 33.Bai C, Tung C-H, Kolthammer J, Shao L, Brown KM, Zhao Z, et al. CT-based attenuation correction in PET image reconstruction for the Gemini system. Nuclear Science Symposium Conference Record, 2003 IEEE. 2003;5:3082–6. doi: 10.1109/NSSMIC.2003.1352549. [DOI] [Google Scholar]
- 34.Mirzaei S, Guerchaft M, Bonnier C, Knoll P, Doat M, Braeutigam P. Use of segmented CT transmission map to avoid metal artifacts in PET images by a PET-CT device. BMC nuclear medicine. 2005;5:3. doi: 10.1186/1471-2385-5-3. [DOI] [PMC free article] [PubMed] [Google Scholar]
- 35.Talguen V, Turzo A, Bizais Y, Visvikis D. Evaluation of attenuation correction methodology in the Allegro™ PET system. Nuclear Science Symposium Conference Record; 2003; IEEE; 2003. pp. 3078–81. [Google Scholar]
- 36.Browne J, de Pierro AR. A Row-Action Alternative to the EM Algorithm for Maximizing Likelihoods in Emission Tomography. IEEE transactions on medical imaging. 1996;15:687–99. doi: 10.1109/42.538946. [DOI] [PubMed] [Google Scholar]
- 37.Daube-Witherspoon ME, Matej S, Karp JS, Lewitt RM. Application of the row action maximum likelihood algorithm with spherical basis functions to clinical PET imaging. Nuclear Science, IEEE Transactions on. 2001;48:24–30. doi: 10.1109/23.910827. [DOI] [Google Scholar]
- 38.Bai C, Shao L, Da Silva AJ, Zhao Z. A generalized model for the conversion from CT numbers to linear attenuation coefficients. IEEE Trans Nucl Sci. 2003;50:1510–5. [Google Scholar]
- 39.Berger MJ, Hubbell JH, Seltzer SM, Chang J, Coursey JS, Sukumar R, et al. XCOM: photon cross sections database. NBSIR 87–3597. Ionizing Radiation Division, Physics Laboratory, National Institute of Standards and Technology; Gaithersburg, MD 20899: NIST, Physics Laboratory, Office of Electronic Commerce in Scientific and Engineering Data; 1998. [Google Scholar]
- 40.Mehranian A, Ay M, Rahmim A, Zaidi H. X-ray CT metal artifact reduction using wavelet domain sparse regularization. IEEE Trans Med Imaging. 2013 doi: 10.1109/TMI.2013.2265136. in press. [DOI] [PubMed] [Google Scholar]


