Abstract
Evidence from confocal microscopic reconstruction of maize anther development in fertile, mac1 (excess germ cells), and msca1 (no germ cells) flowers indicates that the male germ line is multiclonal and uses the MAC1 protein to organize the somatic niche. Furthermore, we identified redox status as a determinant of germ cell fate, defining a mechanism distinct from the animal germ cell lineage. Decreasing oxygen or H2O2 increases germ cell numbers, stimulates superficial germ cell formation, and rescues germinal differentiation in msca1 flowers. Conversely, oxidizing environments inhibit germ cell specification and cause ectopic differentiation in deeper tissues. We propose that hypoxia, arising naturally within growing anther tissue, acts as a positional cue to set germ cell fate.
Most animals sequester germline stem cells during embryogenesis (1, 2), whereas plants are strictly vegetative until intrinsic and environmental cues trigger reproduction (3, 4). The morphogenetic mechanism underlying the somatic-to-germinal switch is a botanical mystery, which if understood would permit tailored manipulations in crop breeding and yield enhancement.
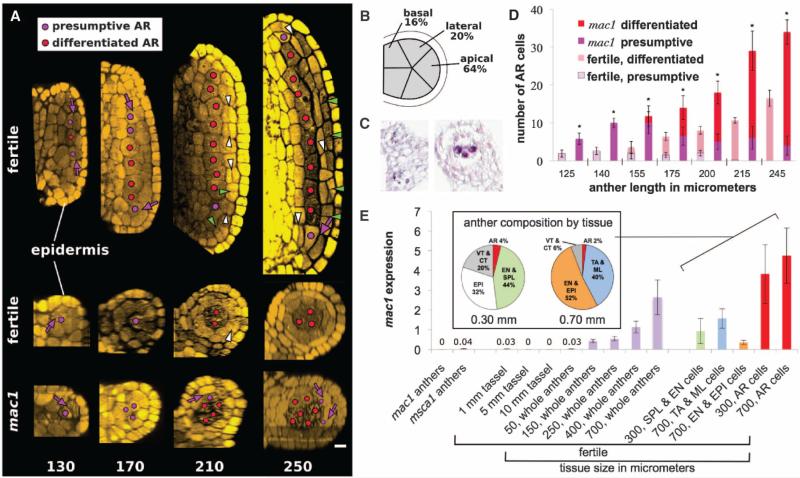
The angiosperm male germ line develops in immature anthers, within each of four lobes surrounding a central vasculature (5), viewed transversely as a butterfly shape (fig. S1). We tracked cellular ontogeny in three-dimensional reconstructions of ~1000 fertile anthers by confocal microscopy, finding that anther length is a precise and reliable proxy for developmental stage. In 70- to 120-μm-long anthers, each lobe consisted of 15 to 20 isodiametric L2-d (layer 2–derived, tracing back to the second meristem layer) cells, haphazardly arranged with 3 to 5 cells in transverse view (fig. S2). Starting at 120 mm and continuing for 30 hours to ~220 mm, successive, symmetric divisions in different L2-d progenitors yielded a column of 8 to 12 presumptive germinal cells, initiating centrally where lobes are widest and completing at the tapered tip and base (Fig. 1A and figs. S3 and S4). The majority of these presumptive archesporial cells derived from apical progenitors [63%, 67 out of 106 (67/106)], but 21% were lateral (22/106), and 16% were basal (17/106) (Fig. 1B). Therefore, in a fertile lobe, all L2-d cells can generate presumptive archesporial cells, which are central in transverse view, surrounded by four or five L2-d neighbors. Initially these presumptive germ cells lacked the well-established (6) morphological traits of premeiotic cells, but ~12 hours after birth, archesporial cells were distinguished from neighboring L2-d cells by their enlarged and nonrectilinear shape, dimly mottled cytoplasmic stain, and 2-μm-wide unstained boundary. Differentiated archesporial cells contained elevated amounts of MAC1 protein, a molecular marker for fate acquisition (Fig. 1C) (7).
Fig. 1.
Anther development in fertile and mac1 anthers. (A) Longitudinal confocal images (top) and transverse Z-stack reconstructions (bottom) of fertile and mac1 male sterile anther development. Numbers indicate anther length in micrometers. (B) Lines indicate lobe positions, and percentages represent the frequency of archesporial cell births. (C) MAC1 immunohistolocalization shows diffuse protein distribution in L2-d cells of early lobes (left) and enrichment in differentiated archesporial cells (right). (D) Presumptive and differentiated archesporial cell counts in mac1 and fertile anthers (asterisks indicate P < 0.05). (E) Quantification of mac1 transcript by qRT-PCR. (Inset) Cellular composition of laser-microdissected anthers. Differentiated archesporial cells are highly enriched in Mac1 transcripts 1 day (300 μm) and 3 days (700 μm) after specification. AR, archesporial; VT, vasculature; CT, connective tissue; EPI, epidermis; EN, endothecium; TA, tapetum; ML, middle layer; purple arrows, AR-generative divisions; white arrowheads, periclinal divisions generating SPL and EN; green arrowheads, anticlinal divisions. Scale bar, 15 μm.
Shortly after archesporial cell enlargement in the transverse view, encircling L2-d cells began dividing periclinally, founding the secondary parietal layer and endothecium. This process begins centrally at ~180 μm, and a full somatic bilayer is constituted by ~280 μm. In multiple archesporial cells 1 (mac1) male sterile anthers, the bilayer is replaced by a single faulty layer and excess archesporial cells (8). In primordia (<120-μm anther length) and later developmental stages, mac1 lobes had extra L2-d cells, including supernumerary central cells, all of which differentiated as archesporial (Fig. 1A and fig. S5). The encircling ring of L2-d cells generated additional archesporial cells for 24 hours after normal cessation (Fig. 1, A and D), never forming the somatic bilayer. Once specified, mac1 archesporial cells proliferated excessively: 30% were EdU+ (5’-ethynyl-2’-deoxyuridine) versus 12% in fertile anthers (fig. S6). When analyzed by quantitative real-time polymerase chain reaction (qRT-PCR), mac1 transcripts were low in anther primordia; expression increased 20-fold during germinal specification (anther length, 150 μm) and was highly specific to laser-microdissected archesporial cells both 1 and 3 days after specification (Fig. 1E). MAC1 is a secreted ligand (7); homologs in rice and Arabidopsis bind leucine-rich repeat receptor-like kinases (9–11), defining a signaling module. We conclude that MAC1 has two roles: (i) autonomously limiting the proliferation of multipotent L2-d cells and their archesporial derivatives, and then (ii) directing the L2-d ring to exit multipotency, differentiate as somatic, and make the signature periclinal division to form the somatic bilayer. Distinctive receptors or intracellular events in archesporial and L2-d cells may facilitate differential interpretation of the MAC1 signal from the archesporial source.
Despite excess proliferation and the absence of normal soma, mac1 archesporial cells followed normal gene expression patterns in preparation for meiosis: of the 297 genes identified by transcriptome profiling as archesporial cell–enriched in fertile anthers (12), 96.7% had parallel expression in microdissected mac1 archesporial cells (table S1). mac1 archesporial cells started meiosis, but arrested in prophase I (8). The normal maturation of mac1 archesporial cells indicates independence from somatic tissues for specification, multiple mitoses, and meiotic entry (13). Germinal independence contrasts with animal spermatogenesis, where meiotic entry depends on a functional somatic niche (14).
Having shown that archesporial cells use MAC1 to organize the somatic niche, we considered the preceding step: how multipotent L2-d cells acquire an archesporial fate. In male sterile converted anther 1 (msca1) anthers, centrally positioned presumptive archesporial cells failed to progress and instead made longitudinal divisions and differentiated as vasculature (fig. S7). We conclude that msca1 is epistatic to mac1, because vascular bundles were observed in mac1 msca1 anthers (fig. S8). Furthermore Mac1 transcripts were low in msca1 anthers, confirming that increased expression is an archesporial cell attribute (Fig. 1E). MSCA1, a glutaredoxin, is a redox regulator that uses glutathione to reduce disulfide bridges in target proteins; it is in a plant-specific clade that regulates transcription factor activity (15).
Redox status affects many plant developmental processes, including the placement of root transition zones (16). During archesporial cell specification, the tassel is tightly encased within a whorl of not–yet-photosynthetic leaves, rapidly growing organs with high metabolic demand. Using a needle-borne O2 probe inserted into the airspace (~1 cm3) between the tassel and the innermost leaf (fig. S9), we found 1.2 to 1.4% O2 hypoxic atmosphere (n = 5 plants) during archesporial cell specification; this condition was transient, because 5 days later O2 was >5%.
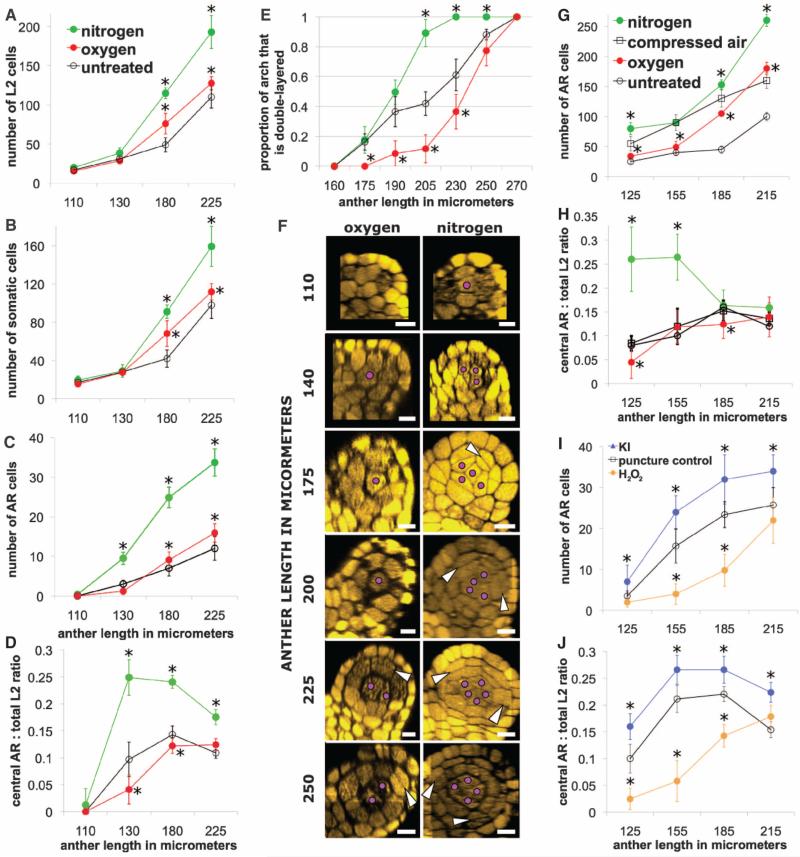
Administering gases through hoses threaded into the leaf whorl modulated O2 concentration (fig. S9); the probe registered 0% with N2 and exceeded 30% (maximal capacity) with O2. After 48 hours, both manipulations resulted in excess cell proliferation (Fig. 2, A and B), but only N2 increased the representation of central cells (Fig. 2C), all of which differentiated as archesporial, phenocopying early mac1 (Fig. 2, C and F). The ratio of archesporial to total L2-d cells is informative (Fig. 2D): In N2, ratios were significantly elevated during late archesporial cell specification (Student's t test, P < 0.01) but decreased later, reflecting precocious somatic bilayer formation (Fig. 2E); whereas O2 depressed ratios and delayed bilayer formation. Results were confirmed by gas administration directly via needles (Fig. 2, G and H, and fig. S10) and by injection of hydrogen peroxide (H2O2) and the peroxide scavenger potassium iodide (KI) (Fig. 2, I and J, and fig. S12). Compressed air and needle puncture were used as controls, because wounding alone slightly increased total L2-d and archesporial cell counts.
Fig. 2.
(A to F) Internal composition after 48-hour N2 and O2 application via hoses. (A) Both gases increased total cell counts, and (B) most cells were somatic. (C) N2 gas resulted in about a threefold increase in presumptive and differentiated archesporial cells, as compared to O2 gas and no treatment. (D) The ratio of central archesporial cells to total L2-d cells was lower in O2-treated anthers than in untreated anthers, whereas N2-treated anthers had much higher ratios that dropped later during somatic bilayer formation. (E) Bilayer formation was measured as a proportion of L2-d somatic ring cells on the lobe arch that had divided periclinally. (F) Transverse reconstructions of single lobes in gas treatments. White arrowheads, periclinal divisions; purple dots, archesporial cells. Scale bar, 20 μm. (G and H) Cellular composition after 48-hour gas application via needle. All needle treatments resulted in excess pro liferation and excess archesporial cells; thus, compressed air was used as a control. (G) Central presumptive + differentiated archesporial counts were significantly higher in N2 and slightly lower in O2 as compared to compressed air. (H) The ratio of central archesporial cells to total L2-d cells is high in N2 early, dropping later from precocious somatic development. (I and J) In the chemical injections, needle puncture alone caused proliferation and excess archesporial cells versus untreated anthers, and served as a control. (I) KI promoted and H2O2 inhibited central archesporial cell counts at all stages versus control. (J) This led to increased ratios in KI and depressed ratios in H2O2, with precocious bilayer formation lowering the ratio in KI in the final size class. Error bars are ± SD (n > 10 plants). Asterisks represent significance compared to control by Student's t test (P < 0.01). See figs. S10 to S13 for additional data.
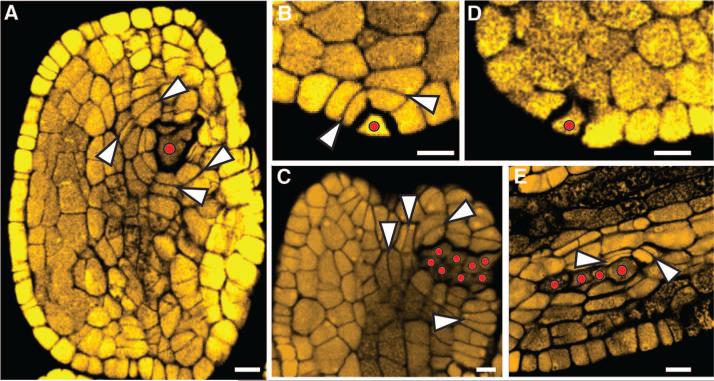
The manipulation of redox status could trigger archesporial cell fate outside of anther lobes, a feature never seen in ~1000 untreated anthers. 4.4% of 1490 treated anthers had ectopic archesporial cells, 3.0% in oxidizing and 6.3% in reducing treatments. Archesporial cell location was significantly biased in oxidizing treatments for the connective and vascular tissues (χ2 = 9.82, P < 0.005) (Fig. 3A and table S3). This preference for internal locations may reflect an intrinsic capacity for deeper tissues to achieve hypoxia during oxidizing treatments. Reducing treatments showed a significant but opposite bias: 17% of ectopic archesporial cells were internal, whereas 83% were epidermal or subepidermal (χ2 = 7.62, P < 0.01) (Fig. 3, B and C, and table S2).
Fig. 3.
Ectopic archesporial cell and bilayer formation. (A) O2 needle treatment with archesporial cells near vasculature. (B) to (D) N2 needle treatment with (B) a single epidermal archesporial cell, (C) an ectopic archesporial cell cluster, and (D) a single ectopic archesporial cell in mac1, missing the somatic layer–adding divisions. (E) 20 μM SNP injected into msca1 caused ectopic archesporial cell formation in the lobe vascular bundle. In (A) to (C) and (E), white arrowheads indicate somatic divisions, with new cell walls built to add layers surrounding the archesporial cell(s). In all panels, red dots indicate archesporial cells. Scale bar, 10 μm.
Although single ectopic archesporial cells occurred, more commonly an archesporial cell cluster wove randomly through the anther. Oriented divisions in surrounding cells were reminiscent of somatic bilayer formation. Ectopic archesporial cells were observed in treated mac1 anthers, but surrounding cells did not organize into bi-layers (Fig. 3D), indicating that ectopic archesporial cells require MAC1 to generate a niche. Reductive but not oxidizing treatments rescued archesporial cell specification in msca1 anthers (Fig. 3E and fig. S14): 9.5% of KI-treated and 37% of sodium nitroprusside (SNP)–treated msca1 anthers had archesporial cells. Like KI, SNP lowers H2O2 levels (17), indicating that a reductive environment suffices to modify the unidentified target(s) of MSCA1, causing archesporial cell formation.
Genetic evidence supports a key role for reactive oxygen species (ROS) management to sustain fertility. Loss-of-function mutants of anther-expressed glutaredoxins, including maize msca1 and rice microsporeless1, are male sterile (18–21), indicating that excessive ROS cause sterility. Transcriptome profiling of microdissected archesporial cells demonstrated preferential expression of genes that lower ROS, support reducing capacity, and contribute to alternative metabolism (table S4). The last set indicates that archesporial cells might bypass the mitochondrial electron transport chain, minimizing damaging ROS (22) and reducing mutational load and cellular disruption in the germinal population (23).
Collectively, microscopic reconstructions and experimental manipulations of redox refute the prevailing lineage model of anther development that asserts that a monoclonal germinal lineage is founded by a singular asymmetric cell division in each lobe (3, 4). We propose that early anther lobes in maize are composed of equivalent, multipotent L2-d cells expressing MAC1, MSCA1, and its archesporial fate–determining target(s). In this model, MSCA1-mediated events are triggered in central lobe cells by hypoxic conditions, which arise naturally during plant growth. These archesporial cells would then increase MAC1 expression to repress their own proliferation and instruct L2-d neighbors to adopt somatic fates. These events proceed from the center, where lobes are widest, toward the anther base and tip, resulting in a multiclonal archesporial cell column encircled by two somatic rings just 40 hours after the first presumptive archesporial cell birth. Concomitantly, anthers have more than doubled in length from both continual anticlinal division in somatic cells and substantial archesporial cell expansion.
In contrast, vertebrates and ecdysozoa establish germline stem cells before gastrulation through either lineage or inductive mechanisms. Even in basal animals, multipotent cells competent to form both germ-line and somatic niches are sequestered embryonically (2). Rarely, an adult germ line can be generated from somatic neoblasts, as in regenerating planaria (24). Any of the early anther somatic cells can acquire a premeiotic fate after redox manipulation, illustrating the plasticity of plant development and the capacity to reprogram cell fate based on environmental conditions. As an example, reducing treatments increased proliferation in the L2-d cell pool, placing more cells in the center of lobes, where archesporial cell fate specification normally starts. An emerging theme in studies of mammalian stem cells is that maintenance of a hypoxic niche is critical for stem cell proliferation and function (25–27), a striking parallel to the specification of anther germinal cells. Multicellularity evolved in a hypoxic aqueous environment, and we speculate that animal and plant stem cells retain a dependence on this physiological status.
Supplementary Material
Acknowledgments
Supplementary figures, tables, and experimental procedures are available on Science Online. We thank R. Wang for MAC1 immunohistolocalization, B. Marchant for tassel treatments, D. Tollenor for oxygen measurements, and R. Egger and W. James Nelson for discussions. Transcriptome data were deposited in the Gene Expression Omnibus (accession no. GSE39101). T.K. and V.W. are inventors on a patent application (61/598.544) filed by Stanford University entitled “Method for Modulating the Number of Archesporial Cells in a Developing Anther.” Supported by NSF grant PGRP07-01880. T.K. was supported by an NIH Biotechnology Training Grant (5-T32-GM008412-17).
References and Notes
- 1.Extavour CG, Akam M. Development. 2003;130:5869. doi: 10.1242/dev.00804. [DOI] [PubMed] [Google Scholar]
- 2.Juliano C, Wessel G. Science. 2010;329:640. doi: 10.1126/science.1194037. [DOI] [PMC free article] [PubMed] [Google Scholar]
- 3.Hord CL, Ma H. Plant Cell Monogr. 2008;9:361. [Google Scholar]
- 4.Bedinger PA, Fowler JE. In: Handbook of Maize: Its Biology. Bennetzen JL, Hake SC, editors. Springer; New York: 2009. pp. 57–77. [Google Scholar]
- 5.Goldberg RB, Beals TP, Sanders PM. Plant Cell. 1993;5:1217. doi: 10.1105/tpc.5.10.1217. [DOI] [PMC free article] [PubMed] [Google Scholar]
- 6.Boavida LC, Becker JD, Feijó JA. Int. J. Dev. Biol. 2005;49:595. doi: 10.1387/ijdb.052019lb. [DOI] [PubMed] [Google Scholar]
- 7.Wang RC-J, et al. Development. 2012;139:2594. doi: 10.1242/dev.077891. [DOI] [PMC free article] [PubMed] [Google Scholar]
- 8.Sheridan WF, Golubeva EA, Abrhamova LI, Golubovskaya IN. Genetics. 1999;153:933. doi: 10.1093/genetics/153.2.933. [DOI] [PMC free article] [PubMed] [Google Scholar]
- 9.Feng X, Dickinson HG. Dev. 2010;137:2409. doi: 10.1242/dev.049320. [DOI] [PubMed] [Google Scholar]
- 10.Albrecht C, Russinova E, Hecht V, Baaijens E, de Vries S. Plant Cell. 2005;17:3337. doi: 10.1105/tpc.105.036814. [DOI] [PMC free article] [PubMed] [Google Scholar]
- 11.Feng X, Dickinson HG. Trends Genet. 2007;23:503. doi: 10.1016/j.tig.2007.08.005. [DOI] [PubMed] [Google Scholar]
- 12.Nan G-L, et al. BMC Plant Biol. 2011;11:120. doi: 10.1186/1471-2229-11-120. [DOI] [PMC free article] [PubMed] [Google Scholar]
- 13.Kelliher T, Walbot V. Dev. Biol. 2011;350:32. doi: 10.1016/j.ydbio.2010.11.005. [DOI] [PMC free article] [PubMed] [Google Scholar]
- 14.Leatherman JL, Dinardo S. Nat. Cell Biol. 2010;12:806. doi: 10.1038/ncb2086. [DOI] [PMC free article] [PubMed] [Google Scholar]
- 15.Albertson MC, et al. U.S. patent 7915478. 2011 [Google Scholar]
- 16.Tsukagoshi H, Busch W, Benfey PN. Cell. 2010;143:606. doi: 10.1016/j.cell.2010.10.020. [DOI] [PubMed] [Google Scholar]
- 17.Wang JW, Wu JY. Plant Cell Physiol. 2005;46:923. doi: 10.1093/pcp/pci098. [DOI] [PubMed] [Google Scholar]
- 18.Bertoni G. Plant Cell. 2011;23:3562. doi: 10.1105/tpc.111.231011. [DOI] [PMC free article] [PubMed] [Google Scholar]
- 19.Li S, et al. Plant Cell. 2009;21:429. doi: 10.1105/tpc.108.064477. [DOI] [PMC free article] [PubMed] [Google Scholar]
- 20.Murmu J, et al. Plant Physiol. 2010;154:1492. doi: 10.1104/pp.110.159111. [DOI] [PMC free article] [PubMed] [Google Scholar]
- 21.Hong L, et al. Plant Cell. 2012;24:577. doi: 10.1105/tpc.111.093740. [DOI] [PMC free article] [PubMed] [Google Scholar]
- 22.Chen Q, Vazquez EJ, Moghaddas S, Hoppel CL, Lesnefsky EJ. J. Biol. Chem. 2003;278:36027. doi: 10.1074/jbc.M304854200. [DOI] [PubMed] [Google Scholar]
- 23.Miller G, Shulaev V, Mittler R. Physiol. Plant. 2008;133:481. doi: 10.1111/j.1399-3054.2008.01090.x. [DOI] [PubMed] [Google Scholar]
- 24.Baguñá J, Saló E, Auladell C. Development. 1989;107:77. [Google Scholar]
- 25.Gustafsson MV, et al. Dev. Cell. 2005;9:617. doi: 10.1016/j.devcel.2005.09.010. [DOI] [PubMed] [Google Scholar]
- 26.Keith B, Simon MC. Cell. 2007;129:465. doi: 10.1016/j.cell.2007.04.019. [DOI] [PMC free article] [PubMed] [Google Scholar]
- 27.Morrison SJ, et al. J. Neurosci. 2000;20:7370. doi: 10.1523/JNEUROSCI.20-19-07370.2000. [DOI] [PMC free article] [PubMed] [Google Scholar]
Associated Data
This section collects any data citations, data availability statements, or supplementary materials included in this article.


