

Abstract
Estradiol (E2) is a well-known modulator of fetal neuroendocrine activity and has been proposed as a critical endocrine signal readying the fetus for birth and postnatal life. To investigate the modulatory role of E2 on fetal stress responsiveness and the response of the fetal brain to asphyxic stress, we subjected chronically catheterized fetal sheep to a transient (10 min) brachiocephalic artery occlusion (BCO) or sham occlusion. Half of the fetuses received subcutaneous pellets that increased plasma E2 concentrations within the physiological range. Hypothalamic mRNA was analyzed using the Agilent 8x15k ovine array (019921), processed and annotated as previously reported by our laboratory. Analysis of the data by ANOVA revealed that E2 differentially regulated (DR) 561 genes, and BCO DR 894 genes compared with control and E2+BCO DR 1,153 genes compared with BCO alone (all P < 0.05). E2 upregulated epigenetic pathways and downregulated local steroid biosynthesis but did not significantly involve genes known to directly respond to the estrogen receptor. Brachiocephalic occlusion upregulated kinase pathways as well as genes associated with lymphocyte infiltration into the brain and downregulated neuropeptide synthesis. E2 upregulated immune- and apoptosis-related pathways after BCO and reduced kinase and epigenetic pathway responses to the BCO. Responses to BCO are different from responses to hypoxic hypoxia suggesting that mechanisms of responses to these two forms of brain hypoxia are distinct. We conclude that cerebral ischemia caused by BCO might stimulate lymphocyte infiltration into the brain and that this response appears to be modified by estradiol.
Keywords: cortisol, fetal heart, mitochondria, metabolism, late gestation
during the transition from intra- to extrauterine life, birth asphyxia is a common cause of cerebral ischemia (29), commonly resulting in the need for resuscitation of the neonate. Disturbances in cerebral blood flow can result from various manipulations in the neonatal intensive care unit, including hypocarbia secondary to mechanical ventilation (18), continuous positive airway pressure (16, 42), and extracorporeal membrane oxygenation (7). Reduction of cerebral blood flow in the neonate compromises oxygen delivery or, if severe, produces ischemia/reperfusion injury (10) and results in morbidity, including intraventricular hemorrhage (6) and long-term cognitive deficit (14).
We have investigated the cardiovascular and endocrine responses to cerebral hypoperfusion in late-gestation chronically catheterized fetal sheep (31, 38, 39), in this animal model of late fetal development. This model allows us to investigate responses to stress in utero and better understand the native homeostatic mechanisms that promote survival after stress. We investigated the responses to severe brain asphyxia, produced by a transient occlusion of the brachiocephalic artery, the vessel that in sheep supplies blood flow to both carotid arteries. This manipulation produces a form of brain asphyxia and reperfusion that might be similar to transient umbilical cord occlusion or transient interruption of cerebral blood flow during surgery. Brachiocephalic occlusion stimulates cardiovascular and endocrine responses as direct responses to ischemia/reperfusion and as reflex responses to carotid chemoreceptor activity (21, 39). Glutamate neurotransmission appears to play an important role in mediating the fetal ACTH response to brachiocephalic artery occlusion (BCO) (19). Related to, and perhaps downstream from, N-methyl-D-aspartate (NMDA) neurotransmission is the influence of brain-derived prostaglandins, mediated by cyclooxygenase-2 [prostaglandin-endoperoxide synthase 2 (PTGS2)], which is upregulated in various brain regions after BCO (12).
The availability of ovine gene array technology has provided investigators with the ability to broadly model the response of the fetal hypothalamus to BCO. We have recently annotated the Agilent 15k ovine array, and we have used it to measure gene expression in fetal hypothalamus in response to ventilatory hypoxia in late gestation (41). In the present experiment, we used this array to investigate the genomics of the ovine fetal hypothalamic responses to BCO and to estradiol, both alone and in combination. We hypothesized that the genomic response to estradiol is highly represented by genes known to be directly stimulated by the estrogen receptor (ER) and that the response to BCO is modulated by estradiol.
MATERIALS AND METHODS
All of these experiments were approved by the University of Florida Institutional Animal Care and Use Committee and were performed in accordance with the Guiding Principles for Research Involving Animals and Human Beings published by the American Physiological Society. The studies reported in this paper were performed on mRNA samples extracted from hypothalami of chronically catheterized fetal sheep subjected to brachiocephalic occlusion with or without chronic treatment with 17β-estradiol (E2). The in vivo experimental data have been previously reported (39). In brief, we chronically instrumented fetal sheep with vascular and amniotic fluid catheters and each with an extravascular occluder around the brachiocephalic artery. All animals were allowed 5 days postoperative recovery before experimentation and were 124–128 days gestation (term 147 days) at the time of study. Half of the fetuses were treated at surgery with a subcutaneous pellet that released E2 at a rate of ∼250 μg/day. Four groups of fetuses were studied (n = 4/group): 1) control (no E2 and no BCO), 2) BCO (10 min period of BCO), 3) E2 (chronic E2 but no BCO), and 4) BCO+E2. The BCO manipulation results in a complete occlusion of the brachiocephalic artery but not a complete cessation of blood flow to the fetal brain (34, 39), because the BCO does not impede collateral flow to the brain through the vertebral or spinal arteries. Arterial blood samples (5 ml) were drawn immediately before and 5, 10, 20, and 30 min after the onset of the 10 min period of BCO (or sham-BCO).
Messenger RNA was extracted from tissue and purified as previously described (41). RNA integrity numbers for the 16 mRNA samples ranged from 7.9 to 8.8. DNase treatment, labeling with Cy5, and array hybridization were also performed as previously described (41). The array platform that we used was the Agilent-019921 Sheep Gene Expression Microarray 8x15k, G4813A (GPL14112). Annotation of this array platform was previously described (23). Data have been deposited in the Gene Expression Omnibus database (accession number GSE52888).
Analysis of variance was performed using JMP Genomics 5.0 (SAS Institute, Cary, NC). Prior to analysis, transcript levels were normalized to the median expression value on each array. The criterion value for statistical significance chosen was P < 0.05. Network inference of the differentially regulated (DR) genes was performed with GeneMania (36), a plugin of CytoScape (5). Networks were constructed with the following grouping criteria: physical interactions, predicted, pathway, genetic interactions, physical interactions, coexpression, colocalization. BinGO (15), also a plugin of Cytoscape, was used for gene ontology analysis, using P < 0.05 as the criterion for statistical significance after Benjamini-Hochberg false discovery rate correction (1). Overlap of gene lists was visualized by a Venn analysis or the Advanced Network Merge function of Cytoscape. Analysis of predicted transcription factor (TF) binding sites was performed with WebGestalt (35, 43), using P < 0.05 as the criterion for statistical significance using a hypergeometric test.
We confirmed array expression data for selected genes by real-time quantitative PCR (qPCR) with primers and, in some assays, probes, as reported in Table 1. Aliquots of mRNA were converted to cDNA with a High Capacity cDNA Archive kit by the methodology recommended by the kit manufacturer (Applied Biosystems, Foster City, CA). The newly synthesized cDNA was stored at −20°C until qRT-PCR was performed. Seven genes (Table 1) were selected because of their inclusion in or relevance to the significant clusters of DR genes. Probes and primers were designed with Primer Express software (Applied Biosystems). Amplification reactions for all primer or probe and primer pairs had efficiencies >95%. The abundance of ACTB (β-actin) mRNA was determined in each sample with primers and VIC TaqMan probe designed from the ovine ACTB sequence and TaqMan RT-PCR master mix (Applied Biosystems). All samples were run in triplicate for each gene and for ACTB. Relative mRNA expression of each gene was calculated by determining change in threshold cycle (ΔCt) between the mean Ct for each gene and the mean Ct for ACTB mRNA from the same sample.
Table 1.
Primers and probes used for real-time PCR confirmation of gene expression
| Gene | Forward Primer | Reverse Primer | Probe |
|---|---|---|---|
| POMC | CCGGCAACTGCGATGAG | GGAAATGGCCCATGACGTACT | AGCCGCTGACTGAGAACCCCCG |
| IL1B | CGTGGCCATGGAGAAGCT | GGTCATCATCACGGAAGACATGT | Sybr Green |
| CRHBP | TGGTCTGAGCAGAAGGAGCAT | GCTCATGGACCCGGAAGAA | Sybr Green |
| AGRP | GAGGTGCTAGATCCGGAAGG | TGGTGTCCCAGACAGGATTCA | Sybr Green |
| TNF | CCCTTCCACCCCCTTGTT | ATGTTGACCTTGGTCTGGTAGGA | Sybr Green |
| NPY | CGGAGGACTTGGCCAGATAC | TGCCTGGTGATGAGATTGATG | ACTCAGCGCTGCGAC (MGB) |
| PRL | TGAGCTTGATTCTTGGGTTGCT | CCCCGCACCTCTGTGACTA | CTCCTGGAATGACCCTCTGTATCAC |
| ACTB | TTCCTTCCTGGGCATGGA | GACGTCACACTTCATGATGGAATT | TCCTGCGGCATTCACGAAACTACCTT |
Shown in Fig. 1 are qPCR data and array data for AGRP (Fig. 1A), plotted together to show that there is excellent correspondence of results from both methods. Shown in Fig. 1B is the correlation of expression values measured by both methods for six genes.
Fig. 1.
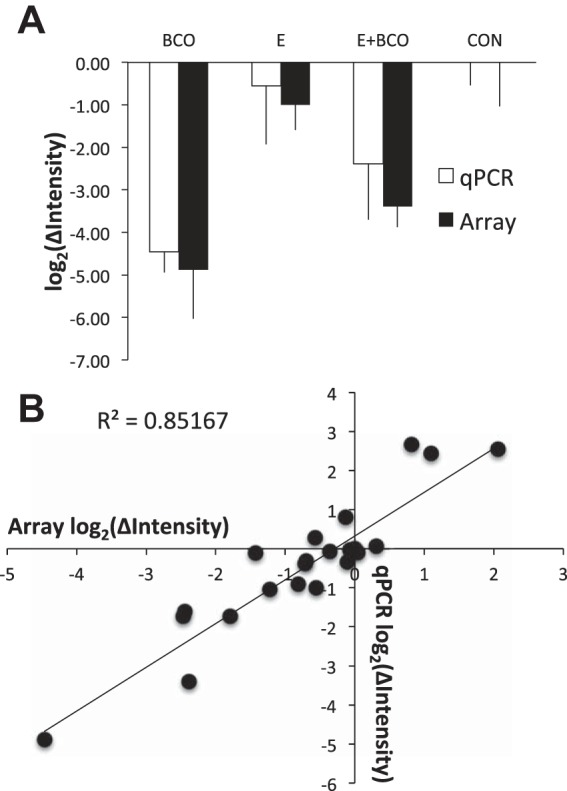
A: expression [plotted as log2(ΔIntensity)] of AGRP as measured in the 4 groups using qPCR (open bars) and microarray (filled bars). Data are represented as means ± SE. BCO, brachiocephalic artery occlusion; E, 17β-estradiol; CON, control; qPCR, quantitative PCR. B: correlation of expression of AGRP, CRHBP, IL1B, POMC, TNF, and NPY as measured by qPCR and microarray methodology.
RESULTS
Response to brachiocephalic occlusion.
Brachiocephalic occlusion increased expression of 378 known genes and decreased expression of 516 known genes (Fig. 2 and Supplementary Data).1 Network inference revealed that 364 of the upregulated genes and 321 of the downregulated genes could be organized into networks of up- and downregulated genes (Fig. 2). Gene ontology analysis of the entire set of upregulated genes revealed a network of related molecular function (MF) terms, with highest-order ontology terms including “protein serine-threonine kinase activity” and “protein transporter activity” (Table 2). Biological process (BP) terms include “regulation of transcription from RNA polymerase II promoter,” “enzyme-linked receptor protein signaling pathway,” and “negative regulation of cell cycle” (Table 3). Highly upregulated genes (>2-fold change) include several genes that are consistent with infiltration of lymphocytes into the fetal hypothalamus after BCO (RORA, GATA3), activity of antigen-presenting cells (NOD2), and activation or infiltration of hematopoietic stem cells within the hypothalamus (KITL, CD1B). Gene ontology analysis of the genes downregulated by BCO revealed significant association with MF term “hormone binding” and with the BP terms “response to prostaglandin E stimulus,” “regulation of nitric oxide biosynthetic process,” and “post-Golgi vesicle-mediated transport.” Highly downregulated genes (>2-fold change) included several peptides and receptors (GHRH, AGRP, NPY, PRL, NVPF, GALP, OXT, POMC, CRHBP, PRLR, BRS3). The coordinated downregulation of mRNA encoding neuropeptides is illustrated in Fig. 3.
Fig. 2.

Volcano plot (bottom) representing the relationship between calculated P value [shown as −log10(P)] and difference between control and BCO groups for each gene [represented as log2(BCO − Control)]. Statistically significant increases in gene expression are shown in red, and statistically significant decreases in gene expression are shown in green. Above the volcano plot are inferred networks of the upregulated (red) and downregulated (green) genes, plotted as force-directed layouts of the networks. These networks are accompanied by gene ontology terms significantly associated with the up- and downregulated genes. Note that the network of downregulated genes is less compact, indicating fewer known associations among these genes.
Table 2.
Statistically significant molecular functions
| Molecular Function | Adj. P | |
|---|---|---|
| BCO upregulated | protein serine-threonine kinase activity | 0.0096 |
| protein transporter activity | 0.011 | |
| follistatin binding | 0.033 | |
| actin filament binding | 0.034 | |
| cyclin-dependent protein kinase regulator activity | 0.034 | |
| identical protein binding | 0.0375 | |
| activin binding | 0.041 | |
| BCO downregulated | hormone binding | 0.018 |
| E2 upregulated | histone deacetylase activity | 0.039 |
| histone methyltransferase activity (H3-K27 specific | 0.026 | |
| RNA binding | 0.039 | |
| nucleotide binding | 0.026 | |
| E2 downregulated | orexin receptor activity | 0.046 |
| steroid 21-monooxygenase activity | 0.046 | |
| glycine-tRNA ligase activity | 0.046 | |
| dsDNA-specific exodeoxyribonuclease activity | 0.046 | |
| E2 upregulated during BCO | RNA binding | 1×10⁻⁷ |
| receptor binding | 0.015 | |
| acetyltransferase activity | 0.044 | |
| transcription elongation regulator activity | 0.045 | |
| E2 downregulated during BCO | group III metabotropic glutamate receptor activity | 0.030 |
| protein kinase activity | 0.027 | |
| Ran GTPase binding | 0.017 | |
| platelet-derived growth factor binding | 0.015 | |
| translation initiation factor activity | 0.030 | |
| HSP90 protein binding | 0.038 | |
| growth factor receptor binding | 0.032 | |
| patched binding | 0.030 | |
| histone methyltransferase activity (H3-K27) | 0.038 |
BCO, brachiocephalic artery occlusion; E2, 17β-estradiol.
Table 3.
Statistically significant biological processes
| Biological Process | Adj. P | |
|---|---|---|
| BCO upregulated | cellular copper ion homeostasis | 0.004 |
| enzyme-linked receptor protein signaling pathway | 0.005 | |
| negative regulation of cell cycle | 0.003 | |
| cell cycle phase | 5.0×10⁻⁴ | |
| establishment of organelle localization | 0.003 | |
| organelle organization | 0.003 | |
| regulation of transcription from RNA polymerase II promoter | 0.004 | |
| peptidyl-lysine dimethylation | 3.0×10⁻⁴ | |
| BCO downregulated | post-Golgi vesicle-mediated transport | 0.025 |
| response to prostaglandin E stimulus | 0.025 | |
| regulation of nitric oxide biosynthetic process | 0.040 | |
| E2 upregulated | cell cycle process | 0.017 |
| cellular response to stress | 0.017 | |
| nuclear-transcribed mRNA poly(A) tail shortening | 0.017 | |
| regulation of cellular macromolecule biosynthetic process | 0.025 | |
| E2 downregulated | regulation of killing of cells of other organism | 0.032 |
| production of molecular mediator of immune response | 0.032 | |
| SMAD protein complex assembly | 0.032 | |
| E2 upregulated during BCO | protein polyubiquitination | 0.003 |
| RNA splicing | 0.002 | |
| mRNA metabolic process | 0.005 | |
| regulation of apoptotic process | 0.005 | |
| cellular response to cytokine stimulus | 0.003 | |
| response to glucocorticoid stimulus | 0.003 | |
| antigen processing and presentation of peptide antigen via MHC class I | 2×10⁻⁴ | |
| antigen processing and presentation of peptide antigen via MHC class I, TAP-dependent | 2×10⁻⁴ | |
| virus-host interaction | 0.006 | |
| E2 downregulated during BCO | positive regulation of protein phosphorylation | 2×10⁻⁶ |
| regulation of protein kinase activity | 1×10⁻⁴ | |
| enzyme linked receptor protein signaling pathway | 2×10⁻⁴ | |
| cellular response to organic substance | 1×10⁻⁴ | |
| organelle organization | 3×10⁻⁵ | |
| blood vessel development | 9×10⁻⁵ |
Fig. 3.
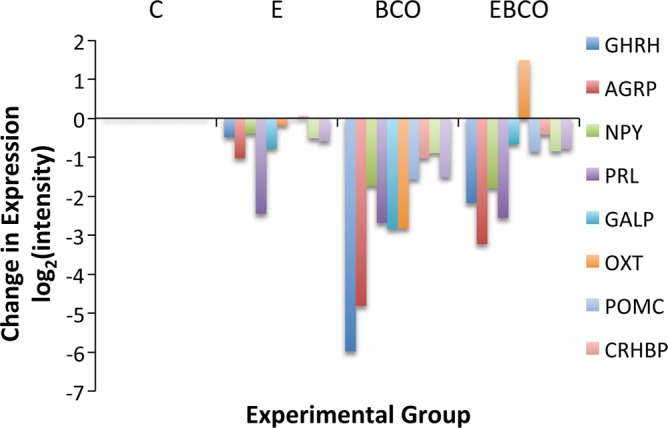
Changes in mRNA abundance, as measured by microarray, for 8 neuropeptides (GHRH, AGRP, NPY, PRL, GALP, OXT, POMC, and CRHBP) in fetuses treated with E2 (represented as group E), BCO (represented as group BCO), and E2 plus BCO (represented as group EBCO). Changes were calculated as differences from expression values in control fetuses (represented as group C). Data are represented as group mean values.
Considering all genes that are up- or downregulated by BCO, KEGG analysis revealed that 49 genes are associated with metabolic pathways, with consensus downregulation in nucleotide metabolic pathways, downregulation of glucose-6-phosphate and fructose-6-phosphate metabolism entry of phosphoenolpyruvate into the Krebs cycle, and downregulation within the oxidative phosphorylation complex. Fatty acid metabolism, especially EETs, was upregulated, along with NADH dehydrogenase (NUDUFU2) in complex I of the oxidative phosphorylation chain. PI3-Akt pathways were associated with 27 genes, including upregulation of SGK1, PKN1, MAPKAPK3, MAP3K1, MAPK1, MAP4, MAP1B, PP2A, CDKN1A (p21), and FOXO3, with downregulation of NFKB1 and NR4A1. The glutamatergic synapse features nine differentially regulated genes, with upregulated components of the NMDA and mGluR1/5 receptor complexes. Similarly, the calcium metabolic pathways include 14 DR genes, including SERCA, calmodulin, and CAM kinase.
TF target analysis with Webgestalt revealed significant association of the upregulated genes with 407 TF binding sites, corresponding to 75 identifiable TFs (an abbreviated list is reported in Table 4). Downregulated genes were significantly associated with 333 TF binding sites corresponded to 143 identifiable TFs. Of these TFs, 29 were significantly associated with both up- and downregulated genes. Interestingly, HIF1A and ARNT binding sites are significantly associated with only the downregulated genes.
Table 4.
Statistically significant association with transcription factor binding sites
| Transcription Factor | n | Adj. P | |
|---|---|---|---|
| BCO upregulated | hsa_GGGCGGR_V$SP1_Q6 | 97 | 1.8×10⁻²⁹ |
| hsa_GGGAGGRR_V$MAZ_Q6 | 83 | 1.×10−27 | |
| hsa_TGGAAA_V$NFAT_Q4_01 | 66 | 1.7×10⁻²⁰ | |
| hsa_CTTTGT_V$LEF1_Q2 | 66 | 8.5×10⁻²⁰ | |
| hsa_TTGTTT_V$FOXO4_01 | 67 | 2.0×10⁻¹⁹ | |
| hsa_AACTTT_UNKNOWN | 63 | 7.1×10⁻¹⁹ | |
| hsa_RYTTCCTG_V$ETS2_B | 41 | 1.4×10⁻¹³ | |
| hsa_CAGGTG_V$E12_Q6 | 61 | 3.9×10⁻¹² | |
| hsa_GGGTGGRR_V$PAX4_03 | 42 | 7.2×10⁻¹² | |
| hsa_MGGAAGTG_V$GABP_B | 30 | 1.8×10⁻¹⁰ | |
| BCO downregulated | hsa_GGGCGGR_V$SP1_Q6 | 97 | 2.4×10⁻¹⁸ |
| hsa_CAGGTG_V$E12_Q6 | 87 | 5.4×10⁻¹⁸ | |
| hsa_GGGAGGRR_V$MAZ_Q6 | 81 | 4.1×10⁻¹⁷ | |
| hsa_TTGTTT_V$FOXO4_01 | 67 | 4.4×10⁻¹² | |
| hsa_TATAAA_V$TATA_01 | 48 | 2.0×10⁻¹⁰ | |
| hsa_GGGTGGRR_V$PAX4_03 | 47 | 5.6×10⁻¹⁰ | |
| hsa_TGGAAA_V$NFAT_Q4_01 | 59 | 5.6×10⁻¹⁰ | |
| hsa_RYTTCCTG_V$ETS2_B | 42 | 1.2×10⁻⁹ | |
| hsa_TCANNTGAY_V$SREBP1_01 | 26 | 1.5×10⁻⁷ | |
| hsa_SCGGAAGY_V$ELK1_02 | 40 | 1.8×10⁻¹⁰ | |
| E2 upregulated | hsa_GGGAGGRR_V$MAZ_Q6 | 41 | 1.1×10⁻¹⁰ |
| hsa_GGGCGGR_V$SP1_Q6 | 47 | 1.1×10⁻¹⁰ | |
| hsa_CTTTAAR_UNKNOWN | 24 | 1.8×10⁻⁸ | |
| hsa_MGGAAGTG_V$GABP_B | 21 | 2.4×10⁻⁸ | |
| hsa_TTGTTT_V$FOXO4_01 | 34 | 5.7×10⁻⁸ | |
| hsa_RGAANNTTC_V$HSF1_01 | 16 | 7.2×10⁻⁸ | |
| hsa_SCGGAAGY_V$ELK1_02 | 22 | 7.3×10⁻⁶ | |
| hsa_RYTTCCTG_V$ETS2_B | 21 | 7.3×10⁻⁶ | |
| hsa_GATTGGY_V$NFY_Q6_01 | 21 | 1.5×10⁻⁵ | |
| hsa_CTGCAGY_UNKNOWN | 17 | 1.5×10⁻⁵ | |
| E2 downregulated | hsa_GGGCGGR_V$SP1_Q6 | 74 | 1.2×10⁻¹⁷ |
| hsa_CAGGTG_V$E12_Q6 | 63 | 5.6×10⁻¹⁵ | |
| hsa_AACTTT_UNKNOWN | 49 | 8.9×10⁻¹² | |
| hsa_GGGAGGRR_V$MAZ_Q6 | 52 | 1.6×10⁻¹⁰ | |
| hsa_CTTTGT_V$LEF1_Q2 | 46 | 1.3×10⁻⁹ | |
| hsa_CTTTGA_V$LEF1_Q2 | 33 | 3.4×10⁻⁸ | |
| hsa_TGGAAA_V$NFAT_Q4_01 | 41 | 1.4×10⁻⁷ | |
| hsa_V$MYCMAX_B | 15 | 1.4×10⁻⁷ | |
| hsa_V$MAZ_Q6 | 13 | 1.8×10⁻⁷ | |
| hsa_TATAAA_V$TATA_01 | 32 | 3.0×10⁻⁷ | |
| E2 upregulated during BCO | hsa_GGGCGGR_V$SP1_Q6 | 130 | 1.6×10⁻³⁰ |
| hsa_SCGGAAGY_V$ELK1_02 | 67 | 5.3×10⁻²⁰ | |
| hsa_GGGAGGRR_V$MAZ_Q6 | 88 | 3.8×10⁻¹⁶ | |
| hsa_CACGTG_V$MYC_Q2 | 52 | 1.4×10⁻¹³ | |
| hsa_TGGAAA_V$NFAT_Q4_01 | 69 | 2.6×10⁻¹¹ | |
| hsa_RCGCANGCGY_V$NRF1_Q6 | 44 | 6.6×10⁻¹¹ | |
| hsa_GGGTGGRR_V$PAX4_03 | 53 | 1.8×10⁻¹⁰ | |
| hsa_MGGAAGTG_V$GABP_B | 38 | 5.7×10⁻¹⁰ | |
| hsa_CAGGTG_V$E12_Q6 | 78 | 5.7×10⁻¹⁰ | |
| hsa_RYTTCCTG_V$ETS2_B | 46 | 1.3×10⁻⁹ | |
| E2 downregulated during BCO | hsa_GGGCGGR_V$SP1_Q6 | 1.8×10⁻¹⁰ | |
| hsa_GGGAGGRR_V$MAZ_Q6 | 111 | 6.5×10⁻³³ | |
| hsa_TGGAAA_V$NFAT_Q4_01 | 97 | 3.5×10⁻³⁰ | |
| hsa_AACTTT_UNKNOWN | 91 | 2.4×10⁻²⁶ | |
| hsa_CTTTGT_V$LEF1_Q2 | 84 | 8.2×10⁻²¹ | |
| hsa_TTGTTT_V$FOXO4_01 | 85 | 4.1×10⁻²⁰ | |
| hsa_CAGGTG_V$E12_Q6 | 93 | 2.0×10⁻²⁰ | |
| hsa_GGGTGGRR_V$PAX4_03 | 62 | 1.7×10⁻¹⁷ | |
| hsa_SCGGAAGY_V$ELK1_02 | 58 | 1.1×10⁻¹⁶ | |
| hsa_CACGTG_V$MYC_Q2 | 53 | 2.9×10⁻¹⁶ |
The top 10 transcription factor binding sites are reported with adjusted P values.
Response to estradiol.
Estradiol treatment upregulated 221 and downregulated 340 genes (Fig. 4). These genes could be organized into networks of 203 upregulated and 197 downregulated genes (Fig. 4). MFs associated with the upregulated genes include “histone deacetylase activity,” “histone methyltransferase activity (H3-K27 specific),” and “RNA binding” (Fig. 4 and Supplemental Table S1). BPs associated with the genes upregulated by E2 include “cellular response to stress” and “regulation of cellular macromolecule biosynthetic process” (Fig. 4 and Table 3). Included among the downregulated MFs are “steroid 21-mono-oxygenase activity” and “dsDNA-specific exodeoxyribonuclease activity”; among downregulated BPs are “production of molecular mediator of immune response” and “regulation of killing of cells of other organism” (Table 2). Analysis of significant association with known TFs revealed a list of 111 for the upregulated genes and 145 for the downregulated genes. Interestingly, there was significant association with the estrogen receptor response element (ERE) in both the up- and downregulated gene sets. However, the majority of the transcriptomic response to E2 was in genes (545 of 558 genes) not known to contain EREs (13) as illustrated in Fig. 5. Venn analysis of up- and downregulated genes shows minimal overlap of these genes with a list of genes thought to be controlled by ER-ERE interactions (Fig. 5, left), represented as gene networks.
Fig. 4.

Volcano plot (bottom) representing the relationship between calculated P value [shown as −log10(P)] and difference between control and estradiol (E2) groups for each gene [represented as log2(E2 − Control)]. Statistically significant increases in gene expression are shown in red, and statistically significant decreases in gene expression are shown in green. Above the volcano plot are inferred networks of the upregulated (red) and downregulated (green) genes, plotted as force-directed layouts of the networks. These networks are accompanied by gene ontology terms significantly associated with the up- and downregulated genes.
Fig. 5.

Venn diagram (left) and network overlap representation (right) of genes up- and downregulated by estradiol with genes known to be directly responsive to estradiol via binding of the estrogen response (ER)α with the estrogen response element (ERE) (13).
KEGG analysis of the E2 DR genes indicates that E2 has an opposite effect on oxidative phosphorylation compared with the effect of BCO (downregulation in mitochondrial complexes I and II and upregulation in complex V) but leads to similar downregulation of nucleotide metabolic pathways. Upregulation of several components of the PI3-Akt pathways by E2, similar to BCO, included upregulation of SGK1 and PKN. Changes in neuroactive transmitter signaling by E2 included downregulation of prolactin (PRL), orexin (HCTR1, HCTR2), somatostatin (SSTR2), PGF2alpha (PTGFR), nucleotide signaling (P2RX7), and galanin (GALR3) genes, and upregulation of POMC peptide signaling (MC1R). Leptin (LEP) was downregulated, but its receptor was upregulated.
Combination of estradiol and brachiocephalic occlusion.
We analyzed the combination of E2 treatment and BCO by comparing significant differences between the fetuses both treated with E2 and subjected to BCO compared with the fetuses subjected to BCO alone. This analysis reveals the genes that are increased or decreased by E2 during the response to BCO, E2 increased expression of 606 genes during BCO and decreased expression of 547 genes (Fig. 6). These genes could be organized into networks of 573 upregulated and 535 downregulated genes (Fig. 6). Significant BP terms for the genes upregulated by E2 include terms related to immune function, glucocorticoid action, and apoptosis, while BP terms associated with genes downregulated by E2 include protein kinase activity and response to organic stimulus (Fig. 6 and Table 3). MF terms for the upregulated genes include receptor binding, acetyltransferase activity, and RNA elongation, while MF terms for the downregulated genes include protein kinase activity and histone methyltransferase activity (Table 2). TF target analysis reveals 139 TFs significantly associated with upregulated genes and 190 significantly associated with downregulated genes. KEGG analysis revealed that E2 DR 37 genes in the PI3/Akt pathways and 26 genes in the MAPK pathways.
Fig. 6.

Volcano plot (bottom) representing the relationship between calculated P value [shown as −log10(P)] and difference between BCO and combined estradiol and brachiocephalic occlusion (EBCO) groups for each gene [represented as log2(BCO − Control)]. Statistically significant increases in gene expression are shown in red, and statistically significant decreases in gene expression are shown in green. Above the volcano plot are inferred networks of the upregulated (red) and downregulated (green) genes, plotted as force-directed layouts of the networks. These networks are accompanied by gene ontology terms significantly associated with the up- and downregulated genes. Note that the network of downregulated genes is less compact, indicating fewer known associations among these genes.
DISCUSSION
Systems modeling of the transcriptomics response of the fetal sheep to brachiocephalic occlusion reflects increases in kinase activity and decreases in hormone binding. We have also found transcriptomic responses consistent with changes in both prostaglandin and nitric oxide signaling. Brachiocephalic occlusion is a model of ischemia-reperfusion that we have used in the fetal sheep model to mimic the changes in blood flow to the brain during severe hypotension (21, 34, 39). The present results suggest strongly that at least the initial response to BCO is mediated by changes in protein phosphorylation. The apparent changes in prostaglandin signaling agree with and correspond to our previous report (from these experiments) that BCO increases PTGS2-dependent signaling in the fetal brain (9, 40).
E2 circulates in fetal blood at plasma concentrations that are regulated with regard to fetal gestational age and increase near term (4, 17, 37). Increases in fetal plasma E2 concentration stimulate fetal ACTH secretion (24, 26). The present experiments are the first to identify the transcriptomic response of the fetal hypothalamus to increases in plasma E2 concentration. Modeling of the transcriptomic response suggests that major actions of estradiol are to increase gene transcription and modification of histones, while decreasing orexogenic signaling and decreasing local steroidogenesis. E2 also tended to reduce immune activity in the hypothalamus, consistent with its known anti-inflammatory effects (3). Most interestingly, the response to E2 did not substantially overlap with genes known to be directly controlled by ESR1 (estrogen receptor alpha), and prediction of putative TF binding by WebGestalt did not predict a major role for E2 through the ESR1. We have reported that the fetal hypothalamus expresses ERα and that the abundance of the receptor is ontogenetically regulated (25). We have also reported that, in these experiments, the E2 treatment reduced ESR1 protein (but not mRNA) in the fetal hypothalamus (38). We do not know the degree of binding of E2 to the ER at prevailing plasma concentrations of E2. The fetal hypothalamus contains aromatase (CYP19) and various isoforms of 17β-hydroxysteroid dehydrogenase and can therefore locally synthesize E2 from testosterone and estrone (E1). The fetal hypothalamus also contains steroid sulfatase, which can deconjugate E2 from estradiol-3-sulfate and E1 (which can hence be converted to E2 by HSD17B) from estrone-3-sulfate (20, 37). Considering this evidence, we do not know whether the ER in fetal hypothalamus is fully occupied by ligand during fetal life; the present results are surprisingly consistent with this possibility. If this were true, changes in ESR1 abundance would be expected to have an effect on downstream gene expression, but changes in circulating E2 would affect cellular actions through a different mechanism. Downregulation of hypothalamic ESR1 protein in response to chronic E2 administration could at least partially explain the small number of DR genes that are directly E2 sensitive (38). What that mechanism might be is unknown, and it is not possible to discern specific mechanisms from the present study. Possibilities include binding to G protein estrogen receptor 1 (GPER1), which is highly expressed in fetal brain (2), or binding to ESR2, which is also abundant in fetal brain (25) but whose action could be more related to alterations in mitochondrial function (27).
The pattern of gene expression responses is consistent with E2 action via the GPR30. KEGG analysis, both of the response to E2 alone or of E2 modulation of the response to BCO, suggests that several components of the PI3-Akt pathway and that the MAPK pathway are altered by E2. This is consistent with the known actions of GPER1-mediated E2 action in cancer (8) and in brain (28). E2 binding to GPER1 results in Gαs-dependent increase in cAMP concentrations and a Gβγ-dependent calcium release from intracellular stores (28). Signaling downstream from cAMP results in CREB phosphorylation, and downstream signaling from calcium release results in transactivation of the epidermal growth factor receptor (EGFR) secondary to proteolytic release of heparin binding EGF-like growth factor, which in turn binds to and stimulates the EGFR and downstream PI3/Akt kinase activity (8, 22). Many of the components of this pathway are differentially regulated by E2 (compared to control) and by E2 and BCO (compared to BCO alone).
In a recent study (41), we modeled the transcriptomic response of the fetal hypothalamus to transient hypoxia in the fetus (decreasing fetal PaO2 approximately by half for 30 min). In that study, we collected fetal hypothalami in the same time course as in the present study (60 min after onset of the stressor). The similar experimental design allows a comparison of the responses to the two stimuli. One might assume that much of the response to both BCO and hypoxia is caused by tissue hypoxia, perhaps even secondary to increased abundance of HIF1A. Shown in Fig. 7 is the calculated overlap between differentially regulated gene sets after BCO (in purple) and hypoxia (in red). The genes that are shared between the two stimuli are shown in yellow. The combined network is represented by a force-directed layout model, in which highly connected nodes (genes) are grouped close to each other. The result of this model illustrates that, in general, BCO and hypoxia stimulate separate gene networks that have a minor degree of overlap. Recognizing that there are many (both direct and indirect) influences on gene expression in the entire hypothalamus, we interpret this comparison to indicate that the majority of mechanisms underlying the cellular response to the two stimuli are different. Some of these differences will include differences in neurotransmission (although both BCO and hypoxia are likely to stimulate pathways related to carotid chemoreceptors), differences in tissue CO2 levels (BCO is an asphyxic stimulus, while hypoxia caused relative hypocarbia), and possible differences in humoral stimulation of the brain during hypoxia (caused by release of endocrine mediators from placenta or somatic tissues that are made hypoxic by the ventilatory hypoxia but not by BCO).
Fig. 7.

Networks of genes differentially regulated by hypoxia (red) or by BCO (purple). Genes differentially regulated by both stimuli are shown in yellow. Genes responsive to hypoxia are as previously reported (41).
The analysis of transcriptomics reported here agrees with and supports our original report of the responses to BCO and E2 from these experiments. For example, the transcriptomics analysis reflects a decrease in prostaglandin responsiveness (downregulation of PTGER1 and downstream signaling pathways). Our previous studies have strongly indicated that prostaglandin signaling is a central feature of the physiological and endocrine response to BCO (11, 32, 40). In response to BCO, we have found an increase in PGE2 tissue concentration in the fetal brain (33), as well as an increased abundance of PTGS2, which is critical for synthesis of PGE2 (30, 33). Furthermore, blockade of PTGS2 with nimesulide partially blocks the neuroendocrine response to BCO (40). We recognize that the identification of pathways by modeling techniques produces a general model of pathways requiring more specific experimentation to obtain a detailed understanding of the cellular responses. Nevertheless, the correspondence of the model to pathways known to participate at the physiological and biochemical levels is reassuring. Furthermore, the ability to explore potential mechanisms with modeling (e.g., comparison of hypoxia and BCO, and testing whether the transcriptomic response to E2 overlaps with known E2-responsive genes) has the potential to yield surprising results that question dominant paradigms, including the concept that fetal brain responses to hypoxia are not directly mediated by cellular lack of oxygen, and the concept that E2 responses may not be mediated by the ERα.
We conclude that using systems biology techniques to understand mechanism of the fetal response to brain ischemia and reperfusion (as produced by BCO) and modulation of that response with E2 yields insight into mechanisms that both reinforce our previous work (prostaglandin signaling) and challenge our current understanding of fetal physiology and endocrinology (mismatch between BCO and hypoxia responses and lack of E2 responses with genes known to contain the ERE).
GRANTS
This work was supported by National Institutes of Health Grants HD-033053, HD-057561, and DK-076541 and an American Recovery and Reinvestment Act supplement to HD-057561. This work was also supported by a Grant-in-Aid from the American Heart Association.
DISCLOSURES
No conflicts of interest, financial or otherwise, are declared by the author(s).
AUTHOR CONTRIBUTIONS
Author contributions: C.E.W. and M.K.-W. conception and design of research; C.E.W., E.M.R., N.D., M.A.Z., and E.I.C. performed experiments; C.E.W., M.B.R., E.M.R., M.A.Z., and E.I.C. analyzed data; C.E.W., M.B.R., E.M.R., N.D., M.A.Z., E.I.C., and M.K.-W. interpreted results of experiments; C.E.W. and E.I.C. prepared figures; C.E.W. and M.K.-W. drafted manuscript; C.E.W., M.B.R., E.M.R., N.D., M.A.Z., E.I.C., and M.K.-W. edited and revised manuscript; C.E.W., M.B.R., E.M.R., N.D., M.A.Z., E.I.C., and M.K.-W. approved final version of manuscript.
Supplementary Material
ACKNOWLEDGMENTS
The authors thank Xiaoyang (Lisa) Fang for outstanding technical support.
Footnotes
The online version of this article contains supplemental material.
REFERENCES
- 1.Benjamini Y, Hochberg Y. Controlling the false discovery rate: a practical and powerful approach to multiple testing. J Roy Stat Soc Ser B 57: 289–300, 1995. [Google Scholar]
- 2.Brailoiu E, Dun SL, Brailoiu GC, Mizuo K, Sklar LA, Oprea TI, Prossnitz ER, Dun NJ. Distribution and characterization of estrogen receptor G protein-coupled receptor 30 in the rat central nervous system. J Endocrinol 193: 311–321, 2007. [DOI] [PubMed] [Google Scholar]
- 3.Bruce-Keller AJ, Keeling JL, Keller JN, Huang FF, Camondola S, Mattson MP. Antiinflammatory effects of estrogen on microglial activation. Endocrinology 141: 3646–3656, 2000. [DOI] [PubMed] [Google Scholar]
- 4.Carnegie JA, Robertson HA. Conjugated and unconjugated estrogens in fetal and maternal fluids of the pregnant ewe: a possible role for estrone sulfate during early pregnancy. Biol Reprod 19: 202–211, 1978. [DOI] [PubMed] [Google Scholar]
- 5.Cline MS, Smoot M, Cerami E, Kuchinsky A, Landys N, Workman C, Christmas R, Vila-Campilo I, Creech M, Gross B, Hanspers K, Isserlin R, Kelley R, Killcoyne S, Lotia S, Maere S, Morris J, Ono K, Pavlovic V, Pico AR, Vailaya A, Wang PL, Adler A, Conklin BR, Hood L, Kuiper M, Sander C, Schmulevich I, Schwikowski B, Warner GJ, Ideker T, Bader GD. Integration of biological networks and gene expression data using Cytoscape. Nat Protoc 2: 2366–2382, 2007. [DOI] [PMC free article] [PubMed] [Google Scholar]
- 6.Dela Cruz TV, Stewart DL, Winston SJ, Weatherman KS, Phelps JL, Mendoza JC. Risk factors for intracranial hemorrhage in the extracorporeal membrane oxygenation patient. J Perinatol 17: 18–23, 1997. [PubMed] [Google Scholar]
- 7.Fenik JC, Rais-Bahrami K. Neonatal cerebral oximetry monitoring during ECMO cannulation. J Perinatol 29: 376–381, 2009. [DOI] [PubMed] [Google Scholar]
- 8.Filardo EJ. Epidermal growth factor receptor (EGFR) transactivation by estrogen via the G-protein-coupled receptor, GPR30: a novel signaling pathway with potential significance for breast cancer. J Steroid Biochem Mol Biol 80: 231–238, 2002. [DOI] [PubMed] [Google Scholar]
- 9.Fraites MJ, Wood CE. Chemoreflex activity increases prostaglandin endoperoxide synthase mRNA expression in the late-gestation fetal sheep brain. Reprod Sci 18: 824–831, 2011. [DOI] [PMC free article] [PubMed] [Google Scholar]
- 10.Gazzolo D, Abella R, Marinoni E, di Iorio R, Li Volti G, Galvano F, Frigiola A, Temporini F, Moresco L, Colivicchi M, Sabatini M, Ricotti A, Strozzi MC, Crivelli S, Risso FM, Sannia A, Florio P. New markers of neonatal neurology. J Matern Fetal Neonatal Med 22, Suppl 3: 57–61, 2009. [DOI] [PubMed] [Google Scholar]
- 11.Gersting J, Schaub CE, Keller-Wood M, Wood CE. Inhibition of brain prostaglandin endoperoxide synthase-2 prevents the preparturient increase in fetal adrenocorticotropin secretion in the sheep fetus. Endocrinology 149: 4128–4136, 2008. [DOI] [PMC free article] [PubMed] [Google Scholar]
- 12.Knutson N, Wood CE. Interaction of PGHS-2 and glutamatergic mechanisms controlling the ovine fetal hypothalamus-pituitary-adrenal axis. Am J Physiol Regul Integr Comp Physiol 299: R365–R370, 2010. [DOI] [PMC free article] [PubMed] [Google Scholar]
- 13.Lin CY, Strom A, Vega VB, Kong SL, Yeo AL, Thomsen JS, Chan WC, Doray B, Bangarusamy DK, Ramasamy A, Vergara LA, Tang S, Chong A, Bajic VB, Miller LD, Gustafsson JA, Liu ET. Discovery of estrogen receptor alpha target genes and response elements in breast tumor cells. Genome Biol 5: R66, 2004. [DOI] [PMC free article] [PubMed] [Google Scholar]
- 14.Madderom MJ, Gischler SJ, Duivenvoorden H, Tibboel D, Ijsselstijn H. Neonatal extracorporeal membrane oxygenation: impaired health at 5 years of age. Pediatr Crit Care Med 14: 183–193, 2013. [DOI] [PubMed] [Google Scholar]
- 15.Maere S, Heymans K, Kuiper M. BiNGO: a Cytoscape plugin to assess overrepresentation of gene ontology categories in biological networks. Bioinformatics 21: 3448–3449, 2005. [DOI] [PubMed] [Google Scholar]
- 16.Milan A, Freato F, Vanzo V, Chiandetti L, Zaramella P. Influence of ventilation mode on neonatal cerebral blood flow and volume. Early Hum Dev 85: 415–419, 2009. [DOI] [PubMed] [Google Scholar]
- 17.Nathanielsz PW, Elsner C, Magyar D, Fridshal D, Freeman A, Buster JE. Time trend analysis of plasma unconjugated and sulfoconjugated estrone and 3 beta-delta 5-steroids in fetal and maternal sheep plasma in relation to spontaneous parturition at term. Endocrinology 110: 1402–1407, 1982. [DOI] [PubMed] [Google Scholar]
- 18.Pappas A, Shankaran S, Laptook AR, Langer JC, Bara R, Ehrenkranz RA, Goldberg RN, Das A, Higgins RD, Tyson JE, Walsh MC. Hypocarbia and adverse outcome in neonatal hypoxic-ischemic encephalopathy. J Pediatr 158: 752–758, 2011. [DOI] [PMC free article] [PubMed] [Google Scholar]
- 19.Powers MJ, Wood CE. Ketamine inhibits fetal ACTH responses to cerebral hypoperfusion. Am J Physiol Regul Integr Comp Physiol 292: R1542–R1549, 2007. [DOI] [PMC free article] [PubMed] [Google Scholar]
- 20.Purinton SC, Newman H, Castro MI, Wood CE. Ontogeny of estrogen sulfatase activity in ovine fetal hypothalamus, hippocampus, and brain stem. Am J Physiol Regul Integr Comp Physiol 276: R1647–R1652, 1999. [DOI] [PubMed] [Google Scholar]
- 21.Purinton SC, Wood CE. Oestrogen augments the fetal ovine hypothalamus- pituitary-adrenal axis in response to hypotension. J Physiol 544: 919–929, 2002. [DOI] [PMC free article] [PubMed] [Google Scholar]
- 22.Quinn JA, Graeber CT, Frackelton AR, Jr, Kim M, Schwarzbauer JE, Filardo EJ. Coordinate regulation of estrogen-mediated fibronectin matrix assembly and epidermal growth factor receptor transactivation by the G protein-coupled receptor, GPR30. Mol Endocrinol 23: 1052–1064, 2009. [DOI] [PMC free article] [PubMed] [Google Scholar]
- 23.Rabaglino MB, Richards E, Denslow N, Keller-Wood M, Wood CE. Genomics of estradiol-3-sulfate action in the ovine fetal hypothalamus. Physiol Genomics 44: 669–677, 2012. [DOI] [PMC free article] [PubMed] [Google Scholar]
- 24.Saoud CJ, Wood CE. Modulation of ovine fetal adrenocorticotropin secretion by androstenedione and 17beta-estradiol. Am J Physiol Regul Integr Comp Physiol 272: R1128–R1134, 1997. [DOI] [PubMed] [Google Scholar]
- 25.Schaub CE, Gersting JA, Keller-Wood M, Wood CE. Development of ER-alpha and ER-beta expression in the developing ovine brain and pituitary. Gene Expr Patt 8: 457–463, 2008. [DOI] [PubMed] [Google Scholar]
- 26.Schaub CE, Keller-Wood M, Wood CE. Blockade of estrogen receptors decreases CNS and pituitary prostaglandin synthase expression in fetal sheep. Neuroendocrinology 87: 121–128, 2008. [DOI] [PMC free article] [PubMed] [Google Scholar]
- 27.Simpkins JW, Yang SH, Sarkar SN, Pearce V. Estrogen actions on mitochondria–physiological and pathological implications. Mol Cell Endocrinol 290: 51–59, 2008. [DOI] [PMC free article] [PubMed] [Google Scholar]
- 28.Srivastava DP, Evans PD. G-protein oestrogen receptor 1: trials and tribulations of a membrane oestrogen receptor. J Neuroendocrinol 25: 1219–1230, 2013. [DOI] [PubMed] [Google Scholar]
- 29.Takenouchi T, Kasdorf E, Engel M, Grunebaum A, Perlman JM. Changing pattern of perinatal brain injury in term infants in recent years. Pediatr Neurol 46: 106–110, 2012. [DOI] [PubMed] [Google Scholar]
- 30.Tong H, Dhillon H, Wood CE. Induction of PGHS-2 mRNA in response to cerebral hypoperfusion in late-gestation fetal sheep. Prostaglandins Other Lipid Mediat 62: 165–172, 2000. [DOI] [PubMed] [Google Scholar]
- 31.Tong H, Gridley KE, Wood CE. Induction of immunoreactive prostaglandin H synthases 1 and 2 and fos in response to cerebral hypoperfusion in late-gestation fetal sheep. J Soc Gynecol Investig 9: 342–350, 2002. [PubMed] [Google Scholar]
- 32.Tong H, Lakhdir F, Wood CE. Endogenous prostanoids modulate the ACTH and AVP responses to hypotension in late-gestation fetal sheep. Am J Physiol Regul Integr Comp Physiol 275: R735–R741, 1998. [DOI] [PubMed] [Google Scholar]
- 33.Tong H, Richards E, Wood CE. Prostaglandin endoperoxide synthase-2 abundance is increased in brain tissues of late-gestation fetal sheep in response to cerebral hypoperfusion. J Soc Gynecol Investig 6: 127–135, 1999. [DOI] [PubMed] [Google Scholar]
- 34.Tong H, Wood CE. Indomethacin attenuates the cerebral blood flow response to hypotension in late-gestation fetal sheep. Am J Physiol Regul Integr Comp Physiol 277: R1268–R1273, 1999. [DOI] [PubMed] [Google Scholar]
- 35.Wang J, Duncan D, Shi Z, Zhang B. WEB-based GEne SeT AnaLysis Toolkit (WebGestalt): update 2013. Nucleic Acids Res 41: W77–W83, 2013. [DOI] [PMC free article] [PubMed] [Google Scholar]
- 36.Warde-Farley D, Donaldson SL, Comes O, Zuberi K, Badrawi R, Chao P, Franz M, Grouios C, Kazi F, Lopes CT, Maitland A, Mostafavi S, Montojo J, Shao Q, Wright G, Bader GD, Morris Q. The GeneMANIA prediction server: biological network integration for gene prioritization and predicting gene function. Nucleic Acids Res 38: W214–W220, 2010. [DOI] [PMC free article] [PubMed] [Google Scholar]
- 37.Winikor J, Schlaerth C, Rabaglino MB, Cousins R, Sutherland M, Wood CE. Complex actions of estradiol-3-sulfate in late gestation fetal brain. Reprod Sci 18: 654–665, 2011. [DOI] [PMC free article] [PubMed] [Google Scholar]
- 38.Wood CE. Cerebral hypoperfusion increases estrogen receptor abundance in the ovine fetal brain and pituitary. Neuroendocrinology 87: 216–222, 2008. [DOI] [PMC free article] [PubMed] [Google Scholar]
- 39.Wood CE, Giroux D. Central nervous system prostaglandin endoperoxide synthase-1 and -2 responses to oestradiol and cerebral hypoperfusion in late-gestation fetal sheep. J Physiol 549: 573–581, 2003. [DOI] [PMC free article] [PubMed] [Google Scholar]
- 40.Wood CE, Powers MJ, Keller-Wood M. Blockade of PGHS-2 inhibits the hypothalamus-pituitary-adrenal axis response to cerebral hypoperfusion in the sheep fetus. Am J Physiol Regul Integr Comp Physiol 296: R1813–R1819, 2009. [DOI] [PMC free article] [PubMed] [Google Scholar]
- 41.Wood CE, Rabaglino MB, Chang EI, Denslow N, Keller-Wood M, Richards E. Genomics of the fetal hypothalamic cellular response to transient hypoxia: endocrine, immune, and metabolic responses. Physiol Genomics 45: 521–527, 2013. [DOI] [PMC free article] [PubMed] [Google Scholar]
- 42.Zaramella P, Freato F, Grazzina N, Saraceni E, Vianello A, Chiandetti L. Does helmet CPAP reduce cerebral blood flow and volume by comparison with Infant Flow driver CPAP in preterm neonates? Intens Care Med 32: 1613–1619, 2006. [DOI] [PubMed] [Google Scholar]
- 43.Zhang B, Kirov S, Snoddy J. WebGestalt: an integrated system for exploring gene sets in various biological contexts. Nucleic Acids Res 33: W741–W748, 2005. [DOI] [PMC free article] [PubMed] [Google Scholar]
Associated Data
This section collects any data citations, data availability statements, or supplementary materials included in this article.