

Abstract
Peroxisome proliferator activated receptor-α (PPARα) is a master transcriptional regulator of hepatic metabolism and mediates the adaptive response to fasting. Here, we demonstrate the roles for PPARα in hepatic metabolic adaptations to birth. Like fasting, nutrient supply is abruptly altered at birth when a transplacental source of carbohydrates is replaced by a high-fat, low-carbohydrate milk diet. PPARα-knockout (KO) neonatal mice exhibit relative hypoglycemia due to impaired conversion of glycerol to glucose. Although hepatic expression of fatty acyl-CoA dehydrogenases is imparied in PPARα neonates, these animals exhibit normal blood acylcarnitine profiles. Furthermore, quantitative metabolic fate mapping of the medium-chain fatty acid [13C]octanoate in neonatal mouse livers revealed normal contribution of this fatty acid to the hepatic TCA cycle. Interestingly, octanoate-derived carbon labeled glucose uniquely in livers of PPARα-KO neonates. Relative hypoketonemia in newborn PPARα-KO animals could be mechanistically linked to a 50% decrease in de novo hepatic ketogenesis from labeled octanoate. Decreased ketogenesis was associated with diminished mRNA and protein abundance of the fate-committing ketogenic enzyme mitochondrial 3-hydroxymethylglutaryl-CoA synthase (HMGCS2) and decreased protein abundance of the ketogenic enzyme β-hydroxybutyrate dehydrogenase 1 (BDH1). Finally, hepatic triglyceride and free fatty acid concentrations were increased 6.9- and 2.7-fold, respectively, in suckling PPARα-KO neonates. Together, these findings indicate a primary defect of gluconeogenesis from glycerol and an important role for PPARα-dependent ketogenesis in the disposal of hepatic fatty acids during the neonatal period.
Keywords: peroxisome proliferator-activated receptor-α, metabolic adaptation to birth, 3-hydroxymethylglutaryl-CoA synthase, glucose homeostasis, ketone body metabolism, nuclear magnetic resonance substrate fate mapping
nutrient supply and organismal bioenergetics shift dramatically at birth, when a continuous transplacental nutrient stream replete with carbohydrates ceases and is replaced by a cyclically interrupted high-fat, low-carbohydrate milk diet (19, 44). Thus, the neonatal liver must coordinate inductions of hepatic fatty acid oxidation, ketogenesis, and gluconeogenesis to meet the metabolic demands required for adaptation to extrauterine life (19, 44). Fatty acid oxidation yields high-energy phosphates and reducing equivalents used to fuel the endergonic reactions of hepatic gluconeogenesis and acetyl-CoA, which is converted to ketone bodies through ketogenesis. Although glucose produced in the liver is the primary fuel source for the neonatal brain, ketone bodies serve as an important glucose-sparing fuel source, particularly for the brain, heart, and skeletal muscle (6, 11, 38, 44).
The ketone body metabolism pathway is a high-capacity energy conduit between the liver and extrahepatic tissues that can dispose of up to two-thirds of the fat entering the liver (47). In liver mitochondria, a series of ketogenic reactions catalyzed by mitochondrial thiolases, mitochondrial 3-hydroxymethylglutaryl-CoA synthase (HMGCS2; fate-committing), and HMG-CoA lyase convert acetyl-CoA derived from β-oxidation of fatty acids into the ketone body acetoacetate (AcAc), which is reduced to β-hydroxybutyrate (βOHB) by βOHB dehydrogenase 1 (BDH1; reviewed in Refs. 6, 11, 30, and 38). Within mitochondria of extrahepatic tissues, BDH1 oxidizes βOHB to AcAc. Terminal oxidation of ketone bodies in extrahepatic tissues requires covalent activation of AcAc by CoA, which is catalyzed by mitochondrial succinyl-CoA-3:oxoacid CoA transferase (SCOT), the fate-committing enzyme of ketone body oxidation. SCOT is uniquely required for ketone body oxidation, and thus oxidation of ketones does not occur in its absence (11).
Germline SCOT-knockout (KO) mice all die within the first 48 h of life with hyperketonemic hypoglycemia in a manner that phenocopies human sudden infant death syndrome (9, 10). Surprisingly, ketone body oxidation is dispensable for survival of the neonatal period and starvation in adulthood when individually eliminated from cardiomyocytes, skeletal myocytes, or neurons, which comprise the three greatest consumers of ketone bodies (12). Paradoxically, ketone body oxidation, an exclusively extrahepatic process (33, 46), coordinates hepatic metabolic homeostasis by preventing toxic accumulation of ketone bodies, which alters hepatic pyruvate metabolism and fatty acid oxidation, inhibits ketogenesis, and oxidizes redox potential in liver (10). Thus, interorgan coordination of ketogenesis and ketone body oxidation is critical for the preservation of hepatic intermediary metabolism, which is vital during the transition to extrauterine life.
The nuclear receptor peroxisome proliferator-activated receptor-α (PPARα) is a master transcriptional regulator of hepatic intermediary metabolism (28, 35). Fasted adult PPARα-KO mice exhibit hypoglycemia, hypoketonemia, and hepatic steatosis (23, 24). In response to fatty acids, PPARα is thought to promote ketogenesis by inducing fibroblast growth factor 21 (Fgf21), enzymatic mediators of fatty acid oxidation, and Hmgcs2 transcription (3, 7, 8, 20, 39). Significant overlap exists between the bioenergetic challenges faced during fasting and during the transition to birth. Therefore, we applied high-resolution measurements of dynamic metabolism, using 13C-labeled substrates and systems physiology approaches in neonatal mice to determine the mechanisms by which PPARα supports successful adaptation to birth.
METHODS
Animals.
PPARα-KO mice on the C57BL/6J background were acquired from the Jackson Laboratory, and PPARα-KO and wild-type control mice were maintained in our colony as C57BL/6N X C57BL/6J hybrids for at least 10 generations. Fed postnatal day zero (P0; the 1st day of postnatal life) mice were collected within 4 h of birth. All P1 (2nd day of postnatal life) mice were maintained with the dam through the first 30 h after birth and milk fed. The presence of gastric milk spots was confirmed in all mice by both visual inspection of the abdomen prior to experimentation and examination of the gastric contents after euthanization. Breeder pairs were maintained at 22°C on a standard polysaccharide-rich chow diet (Lab Diet 5053) and autoclaved water ad libitum. Lights were off between 1800 and 0600. All experiments consisted of mouse pups that were harvested from at least three litters derived from three different breeder pairings and were conducted using protocols approved by the Animal Studies Committee at Washington University.
Plasma metabolite quantification.
Serum total ketone bodies were determined using standard biochemical assays coupled to colorimetric substrates, as described previously (45). Blood glucose was measured in duplicate using handheld glucometers (Aviva).
Tissue metabolite quantification.
Hepatic triacylglycerol (TAG) and free fatty acid (FFA) concentrations were quantified biochemically using a Folch extract of liver, as described previously (13).
Gene expression analysis.
Quantification of gene expression was performed using real-time RT-quantitative PCR using the ΔΔCT approach as described (45), normalizing to ribosomal protein L32(Rpl32), using primer sequences listed within Table 1.
Table 1.
Primers
| Sequence (5′-3′) |
||
|---|---|---|
| RT-qPCR Primers | Forward | Reverse |
| Acaa2 | ACAAGCACACTGCCCACACTTACT | TGCCTCATCAAGGCTTGGTCACAT |
| Acadl | CAGTTGCATGAAACCAAACG | GAGTTGCACACATTCATAAGC |
| Acadm | GCTGGAGACATTGCCAATCA | TCTTGGCGTCCCTCATCAG |
| Acads | CAAGCTGGCAGACATGG | GGACTCCTTGGTGAAAGG |
| Acadvl | TGGTGGTGGTTCTGTCC | AGTTGCAGCCTCAATGC |
| Acat1 | GTCTGGCTAGTATTTGCAACG | TTCAGCCGGTCACATGG |
| Acox1 | GGATGGTAGTCCGG | AGTCTGGATCGTTC |
| Bdh1 | TGCAACAGTGAAGAGGTGGAGAAG | CAAACGTTGAGATGCCTGCGTTGT |
| Cpt1a | CATGTCAAGCCAGACGAAGA | TGGTAGGAGAGCAGCACCTT |
| Fabp1 | AAAGTGGTCCGCAATGAGTTCACC | TTGTCACCTTCCAGCTTGACGACT |
| G6pc | AAAGTCAACCGCCATGCAAAGGAC | TAGCAAAGAAAGACAGGGCTACCAG |
| Gpd1 | TTCACTGCGGTGTACAAAGTGTGC | CATTCACATGTGTTCCGGGTGGTT |
| Gpd2 | GGACCGTAGTTGTGGAGGATGTG | CTCTGGTTGTACATAGCGCTGGCT |
| Gyk | CCGTTACTCCACATGGAAGAAAGCTGTG | GCATCTTGGAAATCCGTGAGGTGG |
| Hmgcl | GGACTTCATCTGTCAAGCC | TCATTGTATACACCCAATTCCC |
| Hmgcs2 | TGGTTCAAGACAGGGACACAGAAC | AGAGGAATACCAGGGCCCAACAAT |
| Rpl32 | CCTCTGGTGAAGCCCAAGATC | TCTGGGTTTCCGCCAGTTT |
| Pck1 | GGAAGGACAAAGATGGCAAGTTC | AGGCGTTTTCCTTAGGGATGTAG |
| Me1 | TCTCCTCCCAGATGTACAGCACTA | GCGTTACTGGTTGACTTTGGTCTG |
| Me2 | TATACTGTGTAGTGCCCACAGCCCAGTT | AGTACCGTCGCAAGCTTAAAGCAG |
| Me3 | ACTAGACACCTACAGCTGGCCTAA | TTCATCCAGCCCAAACCATCTCTG |
| Pcx | ACAGCACACACACTACCTGCAATG | GCAGGCCCTTATTTGGCAAGAGAT |
| Ppargc1a | CGGAAATCATATCCAACCAG | TGAGGACCGCTAGCAAGTTTG |
qPCR, quantitative PCR; Acaa2, acetyl-CoA acyltransferase 2; Acadl, long-chain acyl-CoA dehydrogenase; Acadm, medium-chain acyl-CoA dehydrogenase; Acads, short-chain acyl-CoA dehydrogenase; Acadvl, very long-chain acyl-CoA dehydrogenase; Acat1, mitochondrial acetoacetyl-CoA thiolase; Acox1, acyl-CoA oxidase; Bdh1, β-hydroxybutyrate dehydrogenase 1; Cpt1a, carnitine palmitolytransferase 1a; Fabp1, fatty acid-binding protein; G6pc, glucose-6-phosphatase; Gpd1, cytosolic glycerol phosphate dehydrogenase; Gpd2, mitochondrial glycerol phosphate dehydrogenase; Gyk, glycerol kinase; Hmgcl, hydroxymethylglutaryl-CoA lyase; Hmgcs2, 3-hydroxymethylglutaryl-CoA synthase; Rpl32, ribosomal protein L32; Pck1, phosphoenolpyruvate carboxykinase; Me1, -2, and -3, malic enzyme 1, 2, and 3, respectively; Pcx, pyruvate carboxylase; Ppargc1a, peroxisome proliferator-activated receptor-γ coactivator-1α.
Immunoblotting.
Lysates from liver were generated in a protein lysis buffer: 20 mM Tris·HCl, 150 mM NaCl, 1 mM EDTA, 1% Triton X-100, 1% phosphatase inhibitor cocktail (Sigma), and protease inhibitor cocktail (complete mini EDTA-free; Roche), pH 7.5. Immunoblots to detect HMGCS2 (rabbit anti-mHMGCS; Santa Cruz Biotechnology), BDH1 (rabbit anti-BDH1; Proteintech Group), and actin (rabbit anti-actin; Sigma) were performed as described (9). Band intensities were quantified densitometrically using Quantity One software (Bio-Rad Laboratories).
Glucose, glycerol, and pyruvate tolerance tests.
Glucose, glycerol, and pyruvate tolerance were measured in fed P0 or P1 mice (as indicated in the text and figure legends) that had been removed from the dam and maintained on a heating pad for the duration of the experiment. For glucose tolerance tests, neonates were injected intraperitoneally (ip) with 4% glucose dissolved in milliQ H2O (2 g/kg body wt). Blood glucose was measured at 15 min and at 60 min after glucose administration via tail snip and decapitation, respectively. For glycerol and pyruvate tolerance tests, neonates were injected with 4% glycerol or 4% pyruvate, respectively, in phosphate-buffered saline (2 g/kg body wt). Blood glucose was measured prior to glycerol or pyruvate administration via tail snip and 45 min after glycerol or pyruvate administration via decapitation.
In vivo substrate utilization.
P0 or P1 mice were injected ip with either 20 μmol of [U-13C]glycerol or 10 μmol/g body wt sodium [1,2,3,4-13C4]octanoate (Cambridge Isotope Laboratories). After intraperitoneal injections, neonatal mice were maintained on a heating pad for 20 min and euthanized by decapitation, and livers were rapidly freeze-clamped in liquid N2. Neutralized perchloric acid tissue extracts were profiled using 13C-edited proton nuclear magnetic resonance (NMR) measured at 11.75 T (Varian/Agilent Direct Drive-1) via first increment gradient heteronuclear single-quantum correlation (gHSQC). Signals were collected from extracts dissolved in 275 μl of D2O + 1 mM trimethylsilyl propionate (TSP) and loaded into high-precision, thin-walled, 5-mm tubes (Shigemi). Quantification of signals by integration of the 1H{13C} and 13C-edited (gHSQC) collections of carbon 2 for taurine, carbon 4 for βOHB, carbon 1 for glucose, and carbon 4 for glutamate were as described previously (9). Fractional enrichments of 13C-labeled glucose, glutamate, and βOHB and tissue concentrations (pool sizes) of glucose, taurine, glutamate, and βOHB were calculated as described previously (10, 45) by dividing taurine-normalized integral values for each queried metabolite derived from the gHSQC collections by the corresponding integral value obtained from the 1H{13C} collections. Because signal from 13C-labeled glycerol obscured the taurine signal on gHSQC, integrals were normalized to TSP and adjusted by an attenuation factor of 1.4624, which was determined via calibration using TSP and glucose standards.
Tandem mass spectrometry analysis of blood amino acids and acylcarnitines.
Blood was spotted onto 1.3-cm spots on Whatman 903 filter paper. Amino acids were quantified as butyl ester derivatives, using multiple precursor/product combinations in a reversed-phase liquid chromatography protocol coupled to tandem mass spectrometry (15). Carnitine esters were measured by scanning for the precursors of the common m/z 85 carnitine fragment. Quantification was achieved in all cases by using stable isotope 2H-labeled internal standards, using an electrospray ionization source coupled to an API 3200-Qtrap tandem mass spectrometer (Applied Biosystems).
Statistical analysis.
All results are presented as means ± SE. Student's t-tests or two-way ANOVA assessments with Bonferroni post hoc analysis were performed as appropriate, using GraphPad Prism (version 5.0).
RESULTS
PPARα-deficient neonates exhibit hypoglycemia due to impaired gluconeogenesis from glycerol.
During fasting, the switch to a lipid-dominated nutrient supply provokes hypoglycemia in adult PPARα-KO mice (23, 24). Similarly, the shift to a high-fat, low-carbohydrate milk diet caused hypoglycemia in neonatal PPARα-KO mice. On the 1st day of life, P0, glycemia did not differ between wild-type and PPARα-KO neonates (Fig. 1A, left). As expected, wild-type neonates increased glycemia significantly between P0 and P1 (27.9 ± 3.7 vs. 54.1 ± 5.8 mg/dl; n > 10/group, P < 0.001; Fig. 1A, open bars), whereas in contrast, PPARα-KO neonates failed to increase glycemia between P0 and P1 (Fig. 1A, black bars), and on P1, blood glucose concentrations were significantly lower in PPARα-KO neonates compared with control mice (33.6 ± 2.8 vs. 54.1 ± 5.8 mg/dl, respectively, n > 10/group, P < 0.001; Fig. 1A, right). Glucose tolerance tests in P0 and P1 mice demonstrated that glucose disposal was not significantly different between wild-type and PPARα-KO neonates (Fig. 1, B and C), suggesting that impaired hepatic gluconeogenesis might underlie the hypoglycemia observed in PPARα-KO neonates on P1. Whereas hepatic mRNA abundances of the gluconeogenic mediators phosphoenolpyruvate carboxykinase (Pck1), glucose-6-phosphatase (G6pc), glycerol kinase (Gyk), and cytosolic glycerol phosphate dehydrogenase (Gpd1) did not differ between groups of mice on P0 or P1, expression of mitochondrial glycerol phosphate dehydrogenase (Gpd2) was significantly lower in PPARα-KO neonates on P0 and P1 (Fig. 2, A–E). Furthermore, peak blood glucose concentrations were lower in P0 PPARα-KO neonates following intraperitoneal glycerol administration (glycerol tolerance test; 44.13 ± 4.27 vs. 63.2 ± 3.46 mg/dl, n > 15/group, P < 0.01; Fig. 2F), suggesting that PPARα-KO neonates exhibited impaired conversion of glycerol (which is normally liberated by lipolysis from milk-derived triacylglycerols) to glucose. To directly quantify hepatic conversion of glycerol into glucose in P1 neonates, we utilized proton-edited 13C-NMR spectroscopy to measure contribution of [13C]glycerol to gluconeogenesis. After a 20-min incubation with [13C]glycerol (20 μmol/g body wt), P1 neonates were euthanized and their livers extracted to determine glucose enrichment via NMR. Although glucose pools following treatment were similar in both groups (Fig. 2G, right), [13C]glucose enrichment from [13C]glycerol was more than twofold higher in control compared with PPARα-KO neonates (58.0 ± 2.1 vs. 28.4 ± 2.7% enrichment, n = 5/group, P < 0.0001; Fig. 2G, left). Hypoglycemia and impaired gluconeogenesis from glycerol are associated with a protein catabolic state, as tandem mass spectrometric analysis of circulating amino acids revealed significantly increased concentrations of most amino and organic acids in PPARα-KO neonates on P1 (Table 2). These results indicate that PPARα supports glycemia during adaptation to birth at least in part by promoting gluconeogenesis from glycerol.
Fig. 1.
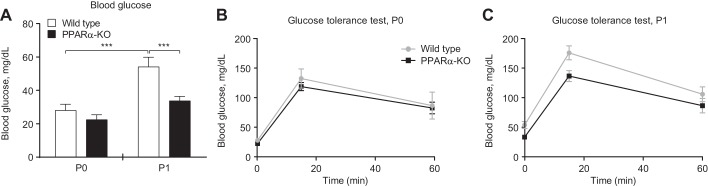
Neonatal peroxisome proliferator-activated receptor-α-konckout (PPARα-KO) mice exhibit relative hypoglycemia. A: blood glucose on postnatal days 0 (P0) and 1 (P1) in suckling wild-type and PPARα-KO mice. Glucose tolerance in P0 (B) and P1 (C) mice. Basal glycemia in B and C (0-min time point) is replicated from A, since glycemia can be safely measured only twice in neonatal mice; n > 6/group. ***P < 0.001 by 2-way ANOVA, as indicated.
Fig. 2.

PPARα promotes gluconeogenesis from glycerol in neonatal mice. A–E: mRNA abundances of gluconeogenic mediators in neonatal liver; n = 8/group. *P < 0.05 and **P < 0.01 by 2-way ANOVA, as indicated. F: glycerol tolerance test in fed P0 mice; n > 10/group. **P < 0.01 by Student's t-test, as indicated. G: hepatic fractional enrichment of [13C]glucose (left) and total hepatic glucose pools (right) 20 min after ip injection of [U-13C]glycerol (20 μmol/g body wt) in neonatal mice; n = 5/group. ****P < 0.0001 by Student's t-test, as indicated. Pck1, phosphoenolpyruvate carboxykinase 1; G6pc, glucose-6-phosphatase; Gyk, glycerol kinase; Gpd1, cytosolic glycerol phosphate dehydrogenase; Gpd2, mitochondrial glycerol phosphate dehydrogenase.
Table 2.
Blood amino and organic acid concentrations
| Blood Amino Acid Concentration on P1, μM |
||
|---|---|---|
| Amino/Organic Acid | Wild type | PPARα-KO |
| Alanine | 106.8 ± 9.3 | 194.2 ± 30.8* |
| β-Alanine | 18.8 ± 1.4 | 18.5 ± 1.5 |
| α-NH2-adipic acid | 8.7 ± 2.3 | 10.3 ± 2.0 |
| α-NH2-n-butyric acid | 1.8 ± 0.7 | 5.8 ± 0.8** |
| γ-NH2-butyric acid | 8.3 ± 3.2 | 8.2 ± 2.0 |
| β-NH2-isobutyric acid | 1.2 ± 0.2 | 2.3 ± 0.5* |
| Arginine | 195.7 ± 25.0 | 264.0 ± 11.4* |
| Carnosine | 0.5 ± 0.2 | 0.3 ± 0.2 |
| Citrulline | 42.0 ± 3.2 | 59.8 ± 5.4* |
| Glutamine | 193.3 ± 16.2 | 360.5 ± 49.5** |
| Glutamate | 188.2 ± 15.9 | 232 ± 12.75 |
| Glycine | 418.2 ± 7 | 683.2 ± 45.4*** |
| Histidine | 15.7 ± 1.6 | 19.5 ± 2.6 |
| Homocitrulline | 1.1 ± 0.2 | 3.0 ± 0.3*** |
| Hydroxyproline | 54.5 ± 5.1 | 52.8 ± 2.4 |
| Isoleucine | 18.8 ± 2.4 | 45.7 ± 4.7*** |
| Leucine | 23.2 ± 3.0 | 79.2 ± 8.5*** |
| Lysine | 270.8 ± 34.9 | 479.8 ± 19.6*** |
| Methionine | 19.0 ± 1.3 | 42.5 ± 4.7*** |
| Ornithine | 20.7 ± 3.3 | 31.5 ± 2.7* |
| Phenylalanine | 39.3 ± 2.0 | 80.8 ± 7.1*** |
| Proline | 91.7 ± 4.2 | 142.7 ± 15.1** |
| Sarcosine | 5.3 ± 0.5 | 9.5 ± 1.0** |
| Serine | 226.2 ± 10.4 | 281.5 ± 15.3* |
| Threonine | 142.2 ± 8.7 | 226.7 ± 22.2** |
| Tyrosine | 48.0 ± 3.6 | 89.5 ± 17.0* |
| Valine | 44.5 ± 1.8 | 115.0 ± 16.0 |
Values are means ± SE; n = 6/group.
P1, 2nd day of postnatal life; PPARα-KO, peroxisome proliferator-activated receptor-α-knockout.
P < 0.05,
P < 0.01, and
P < 0.001 by Student's t-test, as indicated.
Loss of PPARα does not disrupt terminal oxidation of medium-chain fatty acids in neonatal liver.
PPARα is thought to influence hepatic energy metabolism through transcriptional regulation of the mediators of fatty acid oxidation, which is critical for gluconeogenesis. Surprisingly, hepatic mRNA abundances of certain known PPARα target genes involved in fatty acid oxidation, including peroxisome proliferator-activated receptor-γ coactivator-1α (Ppargc1a), carnitine palmitolytransferase 1a (Cpt1a), and acyl-CoA oxidase (Acox1), were not different between groups of mice on either P0 or P1 (Fig. 3, A–C). In contrast, hepatic mRNA abundance of the liver-type fatty acid-binding protein (Fabp1) was decreased significantly in P1 PPARα-KOs, as were the abundances of the fatty acid oxidation mediators very-long- (Acadvl), long- (Acadl), medium- (Acadm), and small-chain (Acads) acyl-CoA dehydrogenases (Fig. 3, D–H). Despite these transcriptional changes, tandem mass spectrometric analysis of circulating acylcarnitine concentrations in PPARα-KO and wild-type P1 neonates revealed strikingly few significant differences between these groups, indicating appropriate enzymatic processing of these lipid species in PPARα-KO neonates (Table 3). Thus, next we quantified directly the hepatic mitochondrial fates of the medium-chain fatty acid [13C]octanoate in neonatal mice using NMR spectroscopy. First, we quantified contribution of [13C]octanoate to the hepatic tricarboxylic acid (TCA) cycle. Following a 20-min incubation with [13C]octanoate (10 μmol/g body wt), neonates were euthanized and livers extracted for NMR profiling. 13C-enrichment of glutamate, which serves as a quantitative surrogate for the contribution of [13C]acetyl-CoA derived from a 13C-labeled substrate to the TCA cycle (22), was normal in both P0 and P1 PPARα-KO animals (Fig. 3I, left). Total hepatic glutamate concentrations (pools) did not differ between groups of mice on P0 or P1 (Fig. 3I, right), nor did concentrations of taurine, a normalizing metabolite that is not labeled by [13C]octanoate (Fig. 3J). As expected, negligible [13C]glucose enrichment from [13C]octanoate was detected in wild-type and PPARα-KO neonates on P0 (Fig. 4A, left). However, on P1, whereas 13C enrichment of glucose from [13C]octanoate remained at background in livers of wild-type animals, 13C enrichment of glucose from [13C]octanoate was nearly threefold greater in livers of PPARα-KO neonates compared with wild-type mice (3.1 ± 0.7 vs. 1.1 ± 0.1% enrichment, n > 3/group, P = 0.0013; Fig. 4A, right). Octanoate administration to P1 PPARα-KO mice was also associated with a modest but insignificant rise in total hepatic glucose pools (Fig. 4B), potentially reflecting an ability of this fatty acid to stimulate gluconeogenesis. Importantly, in this experiment, the total hepatic glucose pool was not decreased in PPARα-KO neonates. These results suggest that in the absence of PPARα signaling, the relative contribution of [13C]octanoate-derived, 13C-labeled TCA cycle intermediates to the gluconeogenic precursor pool in neonatal liver is increased.
Fig. 3.

Normal hepatic terminal fatty acid oxidation of PPARα-KO neonates. A–H: hepatic mRNA abundances of mediators of fatty acid oxidation; n = 8/group. *P < 0.05, **P < 0.01, ***P < 0.001, and ****P < 0.0001 by 2-way ANOVA, as indicated. I: hepatic fractional 13C enrichments of glutamate (left) and total hepatic glutamate pools (right) 20 min after ip injection of sodium [1,2,3,4-13C4]octanoate (10 μmol/g body wt) in neonatal mice; n = 4–8/group. J: total hepatic taurine pools from the same mice as in I. Pparg1a, PPARγ coactivator-1α; Cpt1a, carnitine palmitoyl transferase 1a; Acox1, acyl-CoA oxidase; Acadvl, very long-chain acyl-CoA dehydrogenase; Acadl, long-chain acyl-CoA dehydrogenase; Acadm, medium-chain acyl-CoA dehydrogenase; Acads, short-chain acyl-CoA dehydrogenase.
Table 3.
Blood acylcarnitine concentrations
| Blood Acylcarnitine Concentration on P1, μM |
||
|---|---|---|
| Acylcarnitine | Wild type | PPARα-KO |
| C0 | 49 ± 3.9 | 41 ± 2.1 |
| C2 | 9.2 ± 0.9 | 7.6 ± 0.5 |
| C3 | 0.8 ± 0.12 | 1.0 ± 0.1 |
| C3:1 | 0.11 ± 0.02 | 0.16 ± 0.05 |
| C3-DC | 0.18 ± 0.02 | 0.32 ± 0.1 |
| C4 | 0.24 ± 0.06 | 0.41 ± 0.14 |
| C4-OH | 0.13 ± 0.02 | 0.12 ± 0.03 |
| C4-DC | 0.23 ± 0.02 | 0.2 ± 0.01 |
| C5 | 0.11 ± 0.01 | 0.2 ± 0.04 |
| C5:1 | 0.08 ± 0.01 | 0.14 ± 0.04 |
| C5-OH | 0.17 ± 0.02 | 0.18 ± 0.04 |
| C5-DC | 0.07 ± 0.01 | 0.13 ± 0.03 |
| C6 | 0.15 ± 0.03 | 0.15 ± 0.04 |
| C6-OH | 0.05 ± 0.005 | 0.11 ± 0.03 |
| C8 | 0.25 ± 0.04 | 0.19 ± 0.04 |
| C8:1 | 0.17 ± 0.04 | 0.26 ± 0.07 |
| C10 | 0.19 ± 0.03 | 0.16 ± 0.02 |
| C10:1 | 0.17 ± 0.03 | 0.24 ± 0.07 |
| C10:1-OH | 0.15 ± 0.01 | 0.21 ± 0.03 |
| C12 | 0.31 ± 0.03 | 0.27 ± 0.03 |
| C12:1 | 0.09 ± 0.01 | 0.2 ± 0.03** |
| C12-OH | 0.08 ± 0.01 | 0.13 ± 0.05 |
| C12:1-OH | 0.3 ± 0.05 | 0.72 ± 0.36 |
| C14 | 0.69 ± 0.05 | 0.42 ± 0.03** |
| C14:1 | 0.18 ± 0.03 | 0.16 ± 0.05 |
| C14:2 | 0.09 ± 0.02 | 0.1 ± 0.04 |
| C14-OH | 0.09 ± 0.01 | 0.08 ± 0.02 |
| C14:1-OH | 0.12 ± 0.03 | 0.2 ± 0.09 |
| C16 | 2.1 ± 0.2 | 1.6 ± 0.2 |
| C16:1 | 0.24 ± 0.04 | 0.19 ± 0.03 |
| C16-OH | 0.09 ± 0.02 | 0.09 ± 0.02 |
| C16:1-OH | 0.1 ± 0.01 | 0.08 ± 0.01 |
| C18 | 0.46 ± 0.05 | 0.4 ± 0.05 |
| C18:1 | 0.57 ± 0.05 | 0.56 ± 0.08 |
| C18:2 | 0.29 ± 0.02 | 0.32 ± 0.06 |
| C18-OH | 0.06 ± 0.01 | 0.07 ± 0.02 |
| C18:1-OH | 0.06 ± 0.01 | 0.1 ± 0.03 |
| C18:2-OH | 0.05 ± 0.01 | 0.09 ± 0.01* |
Values are means ± SE; n = 6/group.
P < 0.05 and
P < 0.01 by Student's t-test, as indicated.
Fig. 4.
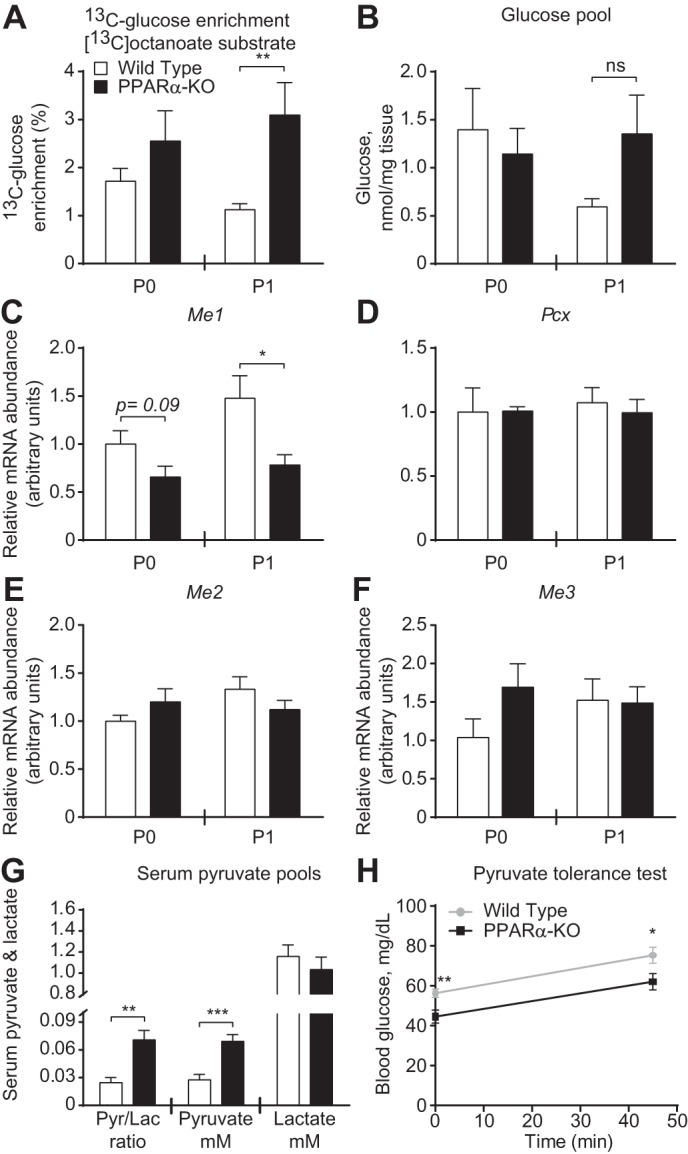
Altered pyruvate metabolism is associated with labeling of glucose from fatty acids in livers of PPARα-KO neonates. A and B: hepatic fractional 13C enrichments of glucose (A) and total hepatic glucose pools (B) 20 min after ip injection of sodium [1,2,3,4-13C4]octanoate (10 μmol/g body wt) in neonatal mice; n = 4–8/group. C–F: hepatic mRNA abundances of mediators of pyruvate metabolism; n = 8/group. G: serum pyruvate/lactate ratios (left), [pyruvate] (in mM; middle), and [lactate] (in mM; right) in P1 mice. H: pyruvate tolerance test in P1 mice; n > 10/group. *P < 0.05, **P < 0.01, and ***P < 0.001 by 2-way ANOVA or Student's t-test, as indicated. Me, malic enzyme; Pcx, pyruvate carboxylase.
To determine whether alterations of pyruvate metabolism contribute to increased [13C]glucose enrichment from [13C]octanoate, we first quantified the messages for the primary enzymatic mediators of pyruvate metabolism. The mRNA abundance of cytoplasmic malic enzyme (Me1), which catalyzes the NADP+/NADPH-dependent oxidoreduction between pyruvate and malate, thus linking gluconeogenesis to the TCA cycle, was decreased in livers of PPARα-KO neonates by ∼50% on P1 (Fig. 4C). Hepatic mRNA abundances of mitochondrial pyruvate carboxylase (Pcx) and mitochondrial malic enzymes 2 (Me2) and (Me3) did not differ between PPARα-KO and wild-type neonatal mice on either P0 or P1 (Fig. 4, D–F). However, serum pyruvate/lactate ratios were increased approximately threefold in PPARα-KO mice on P1 (0.07 ± 0.01 vs. 0.03 ± 0.01, n = 6–8/group, P = 0.0012; Fig. 4G, left), which was attributable to increased serum pyruvate concentrations (69.2 ± 7.2 vs. 27.6 ± 5.8 μM, n = 7–8/group, P = 0.0006; Fig. 4G, middle), as serum lactate concentrations did not differ between groups (Fig. 4G, right). Finally, following ip pyruvate injections, PPARα-KO neonates exhibited decreased maximal blood glucose levels (Fig. 4H). However, because the magnitude of glucose excursion was no different between groups, decreased blood glucose concentrations following pyruvate injection could simply reflect basal hypoglycemia.
Hepatic steatosis is linked to impaired ketogenesis in PPARα-deficient neonates.
We next determined whether loss of PPARα, a known positive regulator of Hmgcs2 transcription and ketogenesis in adult mice, disrupts ketogenesis during the ketogenic neonatal period (6, 19, 23, 24, 38, 39). Circulating total ketone body concentrations were significantly lower in PPARα-KO neonates on P1 (0.51 ± 0.03 vs. 0.80 ± 0.10 mM, n > 5/group, P < 0.01; Fig. 5A). Blunted ketonemia was associated with a threefold decrease in Hmgcs2 transcript abundance on P1 (n = 8/group, P = 0.02; Fig. 5B). Bdh1 transcript abundance increased significantly between P0 and P1 in livers of both wild-type and PPARα-KO neonates, and there was no diminution in transcript abundance in livers of PPARα-KO newborn animals (Fig. 5C). Additionally, transcript abundances of other key enzymatic mediators of ketogenesis, including HMG-CoA lyase (Hmgcl) and the mitochondrial thiolases acetoacetyl-CoA thiolase (Acat1) and acetyl-CoA acyltransferase 2 (Acaa2), were all significantly decreased in PPARα-KO neonates compared with controls on P1 (Fig. 5, D–F). Whereas livers from PPARα-KO neonates exhibited substantially decreased Hmgcs2 mRNA abundance on P1, immunoblots of neonatal hepatic extracts revealed modest discordance between Hmgcs2 transcript and HMGCS2 protein abundance. Hepatic HMGCS2 protein abundance was only ∼25 and ∼20% lower in PPARα-KO neonates on P0 and P1, respectively. Moreover, HMGCS2 protein abundance increased significantly, by ∼25%, between P0 and P1 in both groups (Fig. 5G, middle). Hepatic BDH1 protein abundance was also decreased ∼25% on P1 in PPARα-KO neonates and, unlike livers of wild-type mice, did not increase from P0 to P1 (Fig. 5G, right).
Fig. 5.

PPARα-KO neonates exhibit decreased hepatic expression of ketogenic enzymes and hypoketonemia. A: serum total ketone bodies (TKB) in fed neonatal mice; n > 6/group. B–F: hepatic mRNA abundances of ketogenic enzymes; n = 8/group. G: immunoblots for mitochondrial 3-hydroxymethylglutaryl-CoA synthase 2 (HMGCS2), β-hydroxybutyrate dehydrogenase 1 (BDH1), and actin in neonatal liver (quantification normalized to actin below). *P < 0.05, **P < 0.01, and ***P < 0.001 by 2-way ANOVA, as indicated. Hmgcl, 3-hydroxymethylglutaryl-CoA lyase; Acaa2, mitochondrial acetyl-CoA acyltransferase 2; Acat1, mitochondrial acetoacetyl-CoA thiolase; NS, not significant.
To determine whether the observed decreases in the abundances of enzymatic mediators of hepatic ketogenesis in neonatal PPARα-KO mice were associated with impaired ketogenesis, we performed NMR profiling of [13C]octanoate metabolism in neonatal livers and found that blunted ketonemia could be linked directly to impaired de novo ketone body synthesis. 13C enrichment of βOHB from [13C]octanoate was decreased ∼33% on P0 and ∼50% on P1 in PPARα-KO livers (Fig. 6A, left). Because total hepatic βOHB content did not differ between genotypes on P0 or P1 (Fig. 6A, right), the decrease in 13C-βOHB enrichment reflects decreased de novo ketogenesis. Moreover, the trend toward a decrease in the total hepatic βOHB pool in P1 PPARα-KO neonates confirms that the diminished fractional enrichment of 13C-βOHB from [13C]octanoate mice cannot be attributed to an increase in the total βOHB pool. Finally, to determine whether the observed ketogenic defect in livers of neonatal PPARα-KO mice was associated with an inability to adequately dispose of dietary fat, we quantified both FFA and those esterified as TAG. Livers of PPARα-KO and control neonates demonstrated similar concentrations of hepatic TAG and FFA on P0. However, livers of P1 PPARα-KO mice exhibited significant steatosis, accumulating 6.9-fold greater hepatic [TAG] (23.6 ± 3.9 vs. 3.3 ± 1.6 mg/g live;, n = 6–7/group, P < 0.0001) and 2.7-fold greater [FFA] (2.7 ± 0.23 vs. 1.0 ± 0.3 nmol/mg liver; n = 6–7/group, P < 0.0001) than controls (Fig. 6, B and C). Together, these results suggest an important role for PPARα-dependent ketogenesis in prevention of hepatic steatosis in neonatal mice.
Fig. 6.
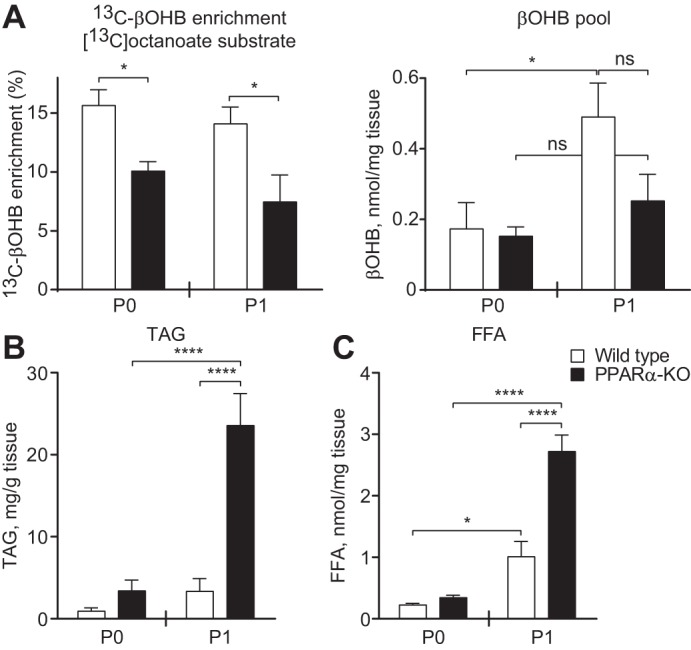
Suppression of de novo ketogenesis is associated with neonatal hepatic steatosis. A: hepatic fractional 13C enrichments of β-hydroxybutyrate (βOHB; left) and total βOHB pools (right) 20 min after ip injection of sodium [1,2,3,4-13C4]octanoate (10 μmol/g body wt) in neonatal mice; n = 4–8/group. B and C: hepatic triacylglycerol (TAG; B) and free fatty acid (FFA; C) concentrations in neonatal mice on P0 and P1; n = 6–7/group, *P < 0.05 and ****P < 0.0001 by 2-way ANOVA, as indicated.
DISCUSSION
The transition to extrauterine life provokes marked shifts in nutrient availability and energy metabolism. In contrast to the carbohydrate-replete nutrient state experienced in utero, the neonatal energy economy is dominated by lipid metabolism. Therefore, it is surprising that mice deficient in PPARα, a master regulator of lipid metabolism, survive the neonatal period. Using NMR spectroscopy and tandem mass spectrometry to quantitatively map substrate fate in neonatal liver and systems physiology approaches, we have dissected metabolic defects exhibited by PPARα-KO neonates. These mice are relatively hypoglycemic, which was mechanistically linked to decreased gluconeogenesis, particularly from glycerol. Whereas livers of PPARα-KO mice exhibited normal expression of certain key mediators of fatty acid oxidation, expression of the fatty acid oxidation enzymes small-, medium-, long-, and very long-chain acyl-CoA dehydrogenases was decreased in the livers of P1 PPARα-KO neonates. Nonetheless, circulating acylcarnitine profile of P1 PPARα-KO remained strikingly normal, and terminal oxidation of the medium-chain fatty acid octanoate was also normal in the livers of these mice. Unlike fatty acid oxidation, ketogenesis was markedly impaired in PPARα-KO neonates. These mice displayed hypoketonemia due to a 50% decrease in hepatic ketogenesis that was linked to decreased expression of ketogenic enzymes and was associated with hepatic steatosis. Together, our results identify a critical role for PPARα-dependent ketogenesis in the disposal of hepatic fatty acids in the neonatal period.
Hypoglycemia, hypoketonemia, and hepatic steatosis in PPARα-KO neonates phenocopy fasted adult PPARα-KO mice (23, 24). The mechanisms underlying fasting hypoglycemia in adult PPARα-KO mice remain controversial. The results of Patsouris et al. (34), which linked hypoglycemia at least in part to decreased hepatic glucose production from glycerol in adult PPARα-KO mice, are consistent with our data in neonatal PPARα-KO mice, whereas the work of others indicated preserved gluconeogenesis from glycerol in adult PPARα-KO mice (48). Here, we used NMR spectroscopy to quantitatively demonstrate that PPARα-KO neonates do not convert [13C]glycerol into hepatic glucose as effectively as wild-type neonates. Although increased glucose disposal could theoretically drive hypoglycemia, adult PPARα-KO mice actually exhibit decreased basal peripheral glucose disposal (34), and glucose tolerance did not differ in neonatal PPARα-KO mice from controls, suggesting that increased glucose disposal is not responsible for the hypoglycemia observed in these animals. Therefore, diminished gluconeogenesis from glycerol is likely a major contributing mechanism to the relative hypoglycemia observed in neonatal PPARα-KO mice. Increased circulating pyruvate (with normal lactate) concentrations in neonatal PPARα-KO mice and the inability of exogenous pyruvate to completely restore glycemia suggest that a modest impairment of gluconeogenesis from pyruvate may also contribute to relative hypoglycemia. Finally, as in fasted adult PPARα-KO mice, which exhibit enhanced amino acid catabolism and increased urea cycle activity (27), the concentrations of most circulating amino acids are increased in PPARα-KO neonates. Together, these results suggest that amino acid mobilization partially compensates for impairments of gluconeogenesis and ketogenesis.
Since hepatic fatty acid oxidation supports gluconeogenesis, impaired fatty acid oxidation is frequently offered as a cause of hypoglycemia in PPARα-KO mice. However, because of the technical challenges associated with directly measuring the contribution of fatty acids to the TCA cycle, ketonemia is often used as a surrogate that reports fatty acid oxidation. Here, we interrogated the activities of the fractional contribution of acetyl-CoA to the TCA cycle and to ketogenesis in neonatal liver, using NMR to map the fate of [13C]octanoate, a medium-chain fatty acid that readily enters the mitochondrial matrix independently of allosterically regulated mitochondrial CPT-1A (30). Although we cannot rule out the possibility of inadequate very long- and long-chain fatty acid oxidation, our results suggest that an impairment of terminal fatty acid oxidation does not contribute directly to hypoglycemia or hepatic steatosis in PPARα-KO neonates, because the contribution of [13C]octanoate to the acetyl-CoA entering the TCA cycle was normal in livers of these mice, and circulating acylcarnitines were normal on P1. It is nonetheless conceivable that overall TCA cycle flux is decreased in the livers of PPARα-KO neonates, yielding a diminished rate of terminal fatty acid oxidation. The precise role of PPARα in governing TCA cycle flux is controversial and may differ across tissues and physiological states. Gélinas et al. (18) demonstrated normal TCA cycle flux in hearts of adult PPARα-KO mice despite a decrease in the proportional contribution of oleate to oxidative cardiac metabolism. Conversely, the data of Makowski et al. (27) suggested that TCA cycle flux is decreased in skeletal muscle of adult PPARα-KO mice, and the findings of Satapati et al. (40) indicate that PPARα agonists increase hepatic TCA cycle flux in adult animals. However, to our knowledge, hepatic TCA cycle flux has not been quantified in PPARα-KO mice. Although our methods did not directly quantify TCA cycle flux, our results are most consistent with the notion that hepatic TCA cycle flux is relatively normal in livers of PPARα-KO neonates, because [13C]glutamate enrichment from [13C]octanoate is normal in the presence of normal total glutamate hepatic pools. Livers of PPARα-KO neonates may exhibit a subtle defect of β-oxidation, particularly in longer-chain fatty acids, that precludes maximal stimulation of ketogenesis but still generates enough acetyl-CoA to support normal TCA cycle contribution, leading to hypoketonemia despite normal terminal fatty acid oxidation. Taken together, our data indicate that neonatal PPARα-KO mice are unlikely to exhibit a major defect of terminal hepatic fatty acid oxidation and also indicate that ketogenesis is a poor biomarker for terminal fatty acid oxidation, as ketonemia and ketogenesis are suppressed in PPARα-KO neonates, whereas contribution of β-oxidation-derived acetyl-CoA to the TCA cycle is preserved.
Surprisingly, livers from neonatal PPARα-KO mice exhibited enriched [13C]glucose from [13C]octanoate. Fatty acid carbons do not normally contribute to gluconeogenesis, because rates of pyruvate carboxylation to the TCA cycle intermediates oxaloacetate and malate and subsequent efflux into gluconeogenesis (pyruvate cycling) are thought to greatly exceed TCA cycle flux in liver (5, 26), although recent studies using novel tracer methods in humans in vivo have challenged this paradigm (4). It is important to note that labeling of glucose from 13C-labeled fatty acids observed in livers of neonatal PPARα-KO mice does not reflect net gluconeogenesis from fatty acids. Unlike lower organisms, mammals are not known to channel acetyl-CoA carbon directly into glucose due to the absence of the glyoxylate cycle enzymes isocitrate lyase and malate synthase (14). Acetyl-CoA entering the mammalian TCA cycle instead passes through two obligatory decarboxylation reactions catalyzed by isocitrate dehydrogenase and α-ketoglutarate dehydrogenase before generating gluconeogenic intermediates (malate/oxaloacetate), and because 2 mol of carbon is lost as CO2 for every mole of acetyl-CoA that enters the mammalian TCA cycle, net gluconeogenesis from fat does not occur. Thus, the most probable explanation for increased 13C labeling of glucose from [13C]octanoate in livers of neonatal PPARα-KO mice is decreased competition in the gluconeogenic intermediate pool from unlabeled endogenous glycerol, and potentially pyruvate, due to impaired gluconeogenesis from these substrates.
The marked degree of ketogenic suppression in livers of neonatal PPARα-KO mice appears disproportionate to the modest decreases in HMGCS2 and BDH1 protein abundances observed in hepatic extracts from these mice. Alterations of HMGCS2 acetylation and succinylation status could prospectively account for the apparent mismatch between 13C-βOHB enrichment and HMGCS2 and BDH1 protein abundance (36, 41). Nonetheless, diminished ketogenesis in PPARα-KO mice was associated with neonatal fatty liver, as these mice exhibited marked increases in hepatic TAG and FFA concentrations. Together, these results suggest that PPARα-dependent ketogenesis is a critical pathway for the disposal of hepatic fat.
Nonalcoholic fatty liver disease (NAFLD) and nonalcoholic steatohepatitis (NASH) affect approximately 1 billion individuals worldwide and incur significant morbidity and mortality (2, 25, 31). Nonetheless, effective therapies that directly target NAFLD and NASH do not currently exist (37). PPARα deficiency in mice increases NASH susceptibility (1, 21), and treatment with PPARα agonists protects against diet-induced steatohepatitis in mice (21, 42). Unfortunately, treatment with the PPARα agonist fenofibrate does not decrease hepatic triglyceride content in human NAFLD (16, 17). One resolution for this interspecies discrepancy is offered by the possibility that PPARα agonists may stimulate ketogenesis more robustly in rodents than in humans (16, 29, 32, 43, 49). Thus, further exploration of the specific role of ketogenesis in human NAFLD pathogenesis may be warranted.
GRANTS
This work was supported by the National Institutes of Health, DK-091538 (to P. A. Crawford), the Diabetes Research Center (DK-020579), the Nutrition and Obesity Research Center (DK-056341), the Digestive Disease Research Core Center (DK-052574), and Training Grant HL-007873 (to D. G. Cotter) and the Children's Discovery Institute through the St. Louis Children's Hospital Foundation (to P. A. Crawford).
DISCLOSURES
No conflicts of interest, financial or otherwise, are declared by the authors.
AUTHOR CONTRIBUTIONS
D.G.C., B.E., and P.A.C. conception and design of research; D.G.C., B.E., D.A.d., and D.J.D. performed experiments; D.G.C., B.E., D.A.d., D.J.D., and P.A.C. analyzed data; D.G.C., B.E., D.A.d., D.J.D., and P.A.C. interpreted results of experiments; D.G.C., B.E., and P.A.C. prepared figures; D.G.C., B.E., and P.A.C. drafted manuscript; D.G.C., B.E., and P.A.C. edited and revised manuscript; D.G.C., B.E., D.A.d., D.J.D, and P.A.C. approved final version of manuscript.
ACKNOWLEDGMENTS
We thank Rebecca Schugar for helpful discussions, Laura Kyro for assistance with graphics, and Ashley Moll and Jamison Leid for excellent technical assistance.
REFERENCES
- 1. Abdelmegeed MA, Yoo SH, Henderson LE, Gonzalez FJ, Woodcroft KJ, Song BJ. PPARalpha expression protects male mice from high fat-induced nonalcoholic fatty liver. J Nutr 141: 603–610, 2011 [DOI] [PMC free article] [PubMed] [Google Scholar]
- 2. Anstee QM, Targher G, Day CP. Progression of NAFLD to diabetes mellitus, cardiovascular disease or cirrhosis. Nat Rev Gastroenterol Hepatol 10: 330–344, 2013 [DOI] [PubMed] [Google Scholar]
- 3. Badman MK, Pissios P, Kennedy AR, Koukos G, Flier JS, Maratos-Flier E. Hepatic fibroblast growth factor 21 is regulated by PPARalpha and is a key mediator of hepatic lipid metabolism in ketotic states. Cell Metab 5: 426–437, 2007 [DOI] [PubMed] [Google Scholar]
- 4. Befroy DE, Perry RJ, Jain N, Dufour S, Cline GW, Trimmer JK, Brosnan J, Rothman DL, Petersen KF, Shulman GI. Direct assessment of hepatic mitochondrial oxidative and anaplerotic fluxes in humans using dynamic (13)C magnetic resonance spectroscopy. Nat Med 20: 98–102, 2014 [DOI] [PMC free article] [PubMed] [Google Scholar]
- 5. Burgess SC, He T, Yan Z, Lindner J, Sherry AD, Malloy CR, Browning JD, Magnuson MA. Cytosolic phosphoenolpyruvate carboxykinase does not solely control the rate of hepatic gluconeogenesis in the intact mouse liver. Cell Metab 5: 313–320, 2007 [DOI] [PMC free article] [PubMed] [Google Scholar]
- 6. Cahill GF., Jr. Fuel metabolism in starvation. Annu Rev Nutr 26: 1–22, 2006 [DOI] [PubMed] [Google Scholar]
- 7. Chakravarthy MV, Lodhi IJ, Yin L, Malapaka RR, Xu HE, Turk J, Semenkovich CF. Identification of a physiologically relevant endogenous ligand for PPARalpha in liver. Cell 138: 476–488, 2009 [DOI] [PMC free article] [PubMed] [Google Scholar]
- 8. Chakravarthy MV, Pan Z, Zhu Y, Tordjman K, Schneider JG, Coleman T, Turk J, Semenkovich CF. “New” hepatic fat activates PPARalpha to maintain glucose, lipid, and cholesterol homeostasis. Cell Metab 1: 309–322, 2005 [DOI] [PubMed] [Google Scholar]
- 9. Cotter DG, d'Avignon DA, Wentz AE, Weber ML, Crawford PA. Obligate role for ketone body oxidation in neonatal metabolic homeostasis. J Biol Chem 286: 6902–6910, 2011 [DOI] [PMC free article] [PubMed] [Google Scholar]
- 10. Cotter DG, Ercal B, d'Avignon DA, Dietzen DJ, Crawford PA. Impact of peripheral ketolytic deficiency on hepatic ketogenesis and gluconeogenesis during the transition to birth. J Biol Chem 288: 19739–19749, 2013 [DOI] [PMC free article] [PubMed] [Google Scholar]
- 11. Cotter DG, Schugar RC, Crawford PA. Ketone body metabolism and cardiovascular disease. Am J Physiol Heart Circ Physiol 304: H1060–H1076, 2013 [DOI] [PMC free article] [PubMed] [Google Scholar]
- 12. Cotter DG, Schugar RC, Wentz AE, d'Avignon DA, Crawford PA. Successful adaptation to ketosis by mice with tissue-specific deficiency of ketone body oxidation. Am J Physiol Endocrinol Metab 304: E363–E374, 2013 [DOI] [PMC free article] [PubMed] [Google Scholar]
- 13. Crawford PA, Crowley JR, Sambandam N, Muegge BD, Costello EK, Hamady M, Knight R, Gordon JI. Regulation of myocardial ketone body metabolism by the gut microbiota during nutrient deprivation. Proc Natl Acad Sci USA 106: 11276–11281, 2009 [DOI] [PMC free article] [PubMed] [Google Scholar]
- 14. Dean JT, Tran L, Beaven S, Tontonoz P, Reue K, Dipple KM, Liao JC. Resistance to diet-induced obesity in mice with synthetic glyoxylate shunt. Cell Metab 9: 525–536, 2009 [DOI] [PMC free article] [PubMed] [Google Scholar]
- 15. Dietzen DJ, Weindel AL, Carayannopoulos MO, Landt M, Normansell ET, Reimschisel TE, Smith CH. Rapid comprehensive amino acid analysis by liquid chromatography/tandem mass spectrometry: comparison to cation exchange with post-column ninhydrin detection. Rapid Commun Mass Spectrom 22: 3481–3488, 2008 [DOI] [PubMed] [Google Scholar]
- 16. Fabbrini E, Mohammed BS, Korenblat KM, Magkos F, McCrea J, Patterson BW, Klein S. Effect of fenofibrate and niacin on intrahepatic triglyceride content, very low-density lipoprotein kinetics, and insulin action in obese subjects with nonalcoholic fatty liver disease. J Clin Endocrinol Metab 95: 2727–2735, 2010 [DOI] [PMC free article] [PubMed] [Google Scholar]
- 17. Fernández-Miranda C, Pérez-Carreras M, Colina F, López-Alonso G, Vargas C, Solís-Herruzo JA. A pilot trial of fenofibrate for the treatment of non-alcoholic fatty liver disease. Dig Liver Dis 40: 200–205, 2008 [DOI] [PubMed] [Google Scholar]
- 18. Gélinas R, Labarthe F, Bouchard B, Mc Duff J, Charron G, Young ME, Des Rosiers C. Alterations in carbohydrate metabolism and its regulation in PPARα null mouse hearts. Am J Physiol Heart Circ Physiol 294: H1571–H1580, 2008 [DOI] [PubMed] [Google Scholar]
- 19. Girard J, Ferré P, Pégorier JP, Duée PH. Adaptations of glucose and fatty acid metabolism during perinatal period and suckling-weaning transition. Physiol Rev 72: 507–562, 1992 [DOI] [PubMed] [Google Scholar]
- 20. Inagaki T, Dutchak P, Zhao G, Ding X, Gautron L, Parameswara V, Li Y, Goetz R, Mohammadi M, Esser V, Elmquist JK, Gerard RD, Burgess SC, Hammer RE, Mangelsdorf DJ, Kliewer SA. Endocrine regulation of the fasting response by PPARalpha-mediated induction of fibroblast growth factor 21. Cell Metab 5: 415–425, 2007 [DOI] [PubMed] [Google Scholar]
- 21. Ip E, Farrell GC, Robertson G, Hall P, Kirsch R, Leclercq I. Central role of PPARalpha-dependent hepatic lipid turnover in dietary steatohepatitis in mice. Hepatology 38: 123–132, 2003 [DOI] [PubMed] [Google Scholar]
- 22. Jones JG, Hansen J, Sherry AD, Malloy CR, Victor RG. Determination of acetyl-CoA enrichment in rat heart and skeletal muscle by 1H nuclear magnetic resonance analysis of glutamate in tissue extracts. Anal Biochem 249: 201–206, 1997 [DOI] [PubMed] [Google Scholar]
- 23. Kersten S, Seydoux J, Peters JM, Gonzalez FJ, Desvergne B, Wahli W. Peroxisome proliferator-activated receptor alpha mediates the adaptive response to fasting. J Clin Invest 103: 1489–1498, 1999 [DOI] [PMC free article] [PubMed] [Google Scholar]
- 24. Leone TC, Weinheimer CJ, Kelly DP. A critical role for the peroxisome proliferator-activated receptor alpha (PPARalpha) in the cellular fasting response: The PPARalpha-null mouse as a model of fatty acid oxidation disorders. Proc Natl Acad Sci USA 96: 7473–7478, 1999 [DOI] [PMC free article] [PubMed] [Google Scholar]
- 25. Loomba R, Sanyal AJ. The global NAFLD epidemic. Nat Rev Gastroenterol Hepatol 10: 686–690, 2013 [DOI] [PubMed] [Google Scholar]
- 26. Magnusson I, Schumann WC, Bartsch GE, Chandramouli V, Kumaran K, Wahren J, Landau BR. Noninvasive tracing of Krebs cycle metabolism in liver. J Biol Chem 266: 6975–6984, 1991 [PubMed] [Google Scholar]
- 27. Makowski L, Noland RC, Koves TR, Xing W, Ilkayeva OR, Muehlbauer MJ, Stevens RD, Muoio DM. Metabolic profiling of PPARalpha−/− mice reveals defects in carnitine and amino acid homeostasis that are partially reversed by oral carnitine supplementation. FASEB J 23: 586–604, 2009 [DOI] [PMC free article] [PubMed] [Google Scholar]
- 28. Mandard S, Muller M, Kersten S. Peroxisome proliferator-activated receptor alpha target genes. Cell Mol Life Sci 61: 393–416, 2004 [DOI] [PMC free article] [PubMed] [Google Scholar]
- 29. Mannaerts GP, Thomas J, Debeer LJ, McGarry JD, Foster DW. Hepatic fatty acid oxidation and ketogenesis after clofibrate treatment. Biochim Biophys Acta 529: 201–211, 1978 [DOI] [PubMed] [Google Scholar]
- 30. McGarry JD, Foster DW. Regulation of hepatic fatty acid oxidation and ketone body production. Annu Rev Biochem 49: 395–420, 1980 [DOI] [PubMed] [Google Scholar]
- 31. Michelotti GA, Machado MV, Diehl AM. NAFLD, NASH and liver cancer. Nat Rev Gastroenterol Hepatol 10: 656–665, 2013 [DOI] [PubMed] [Google Scholar]
- 32. Oosterveer MH, Grefhorst A, van Dijk TH, Havinga R, Staels B, Kuipers F, Groen AK, Reijngoud DJ. Fenofibrate simultaneously induces hepatic fatty acid oxidation, synthesis, and elongation in mice. J Biol Chem 284: 34036–34044, 2009 [DOI] [PMC free article] [PubMed] [Google Scholar]
- 33. Orii KE, Fukao T, Song XQ, Mitchell GA, Kondo N. Liver-specific silencing of the human gene encoding succinyl-CoA: 3-ketoacid CoA transferase. Tohoku J Exp Med 215: 227–236, 2008 [DOI] [PubMed] [Google Scholar]
- 34. Patsouris D, Mandard S, Voshol PJ, Escher P, Tan NS, Havekes LM, Koenig W, März W, Tafuri S, Wahli W, Müller M, Kersten S. PPARalpha governs glycerol metabolism. J Clin Invest 114: 94–103, 2004 [DOI] [PMC free article] [PubMed] [Google Scholar]
- 35. Rakhshandehroo M, Sanderson LM, Matilainen M, Stienstra R, Carlberg C, de Groot PJ, Müller M, Kersten S. Comprehensive analysis of PPARalpha-dependent regulation of hepatic lipid metabolism by expression profiling. PPAR Res 2007: 26839, 2007 [DOI] [PMC free article] [PubMed] [Google Scholar]
- 36. Rardin MJ, He W, Nishida Y, Newman JC, Carrico C, Danielson SR, Guo A, Gut P, Sahu AK, Li B, Uppala R, Fitch M, Riiff T, Zhu L, Zhou J, Mulhern D, Stevens RD, Ilkayeva OR, Newgard CB, Jacobson MP, Hellerstein M, Goetzman ES, Gibson BW, Verdin E. SIRT5 regulates the mitochondrial lysine succinylome and metabolic networks. Cell Metab 18: 920–933, 2013 [DOI] [PMC free article] [PubMed] [Google Scholar]
- 37. Ratziu V. Pharmacological agents for NASH. Nat Rev Gastroenterol Hepatol 10: 676–685, 2013 [DOI] [PubMed] [Google Scholar]
- 38. Robinson AM, Williamson DH. Physiological roles of ketone bodies as substrates and signals in mammalian tissues. Physiol Rev 60: 143–187, 1980 [DOI] [PubMed] [Google Scholar]
- 39. Rodriguez JC, Gil-Gomez G, Hegardt FG, Haro D. Peroxisome proliferator-activated receptor mediates induction of the mitochondrial 3-hydroxy-3-methylglutaryl-CoA synthase gene by fatty acids. J Biol Chem 269: 18767–18772, 1994 [PubMed] [Google Scholar]
- 40. Satapati S, He T, Inagaki T, Potthoff M, Merritt ME, Esser V, Mangelsdorf DJ, Kliewer SA, Browning JD, Burgess SC. Partial resistance to peroxisome proliferator-activated receptor-alpha agonists in ZDF rats is associated with defective hepatic mitochondrial metabolism. Diabetes 57: 2012–2021, 2008 [DOI] [PMC free article] [PubMed] [Google Scholar]
- 41. Shimazu T, Hirschey MD, Hua L, Dittenhafer-Reed KE, Schwer B, Lombard DB, Li Y, Bunkenborg J, Alt FW, Denu JM, Jacobson MP, Verdin E. SIRT3 deacetylates mitochondrial 3-hydroxy-3-methylglutaryl CoA synthase 2 and regulates ketone body production. Cell Metab 12: 654–661, 2010 [DOI] [PMC free article] [PubMed] [Google Scholar]
- 42. Shiri-Sverdlov R, Wouters K, van Gorp PJ, Gijbels MJ, Noel B, Buffat L, Staels B, Maeda N, van Bilsen M, Hofker MH. Early diet-induced non-alcoholic steatohepatitis in APOE2 knock-in mice and its prevention by fibrates. J Hepatol 44: 732–741, 2006 [DOI] [PubMed] [Google Scholar]
- 43. Tremblay-Mercier J, Tessier D, Plourde M, Fortier M, Lorrain D, Cunnane SC. Bezafibrate mildly stimulates ketogenesis and fatty acid metabolism in hypertriglyceridemic subjects. J Pharmacol Exp Ther 334: 341–346, 2010 [DOI] [PubMed] [Google Scholar]
- 44. Ward Platt M, Deshpande S. Metabolic adaptation at birth. Semin Fetal Neonatal Med 10: 341–350, 2005 [DOI] [PubMed] [Google Scholar]
- 45. Wentz AE, d'Avignon DA, Weber ML, Cotter DG, Doherty JM, Kerns R, Nagarajan R, Sambandam N, Crawford PA. Adaptation of myocardial substrate metabolism to a ketogenic nutrient environment. J Biol Chem 285: 24447–24456, 2010 [DOI] [PMC free article] [PubMed] [Google Scholar]
- 46. Williamson DH, Bates MW, Page MA, Krebs HA. Activities of enzymes involved in acetoacetate utilization in adult mammalian tissues. Biochem J 121: 41–47, 1971 [DOI] [PMC free article] [PubMed] [Google Scholar]
- 47. Williamson JR, Browning ET, Scholz R. Interactions between fatty acid oxidation and the citric acid cycle in perfused rat liver. J Biol Chem 244: 4617–4627, 1969 [PubMed] [Google Scholar]
- 48. Xu J, Xiao G, Trujillo C, Chang V, Blanco L, Joseph SB, Bassilian S, Saad MF, Tontonoz P, Lee WN, Kurland IJ. Peroxisome proliferator-activated receptor alpha (PPARalpha) influences substrate utilization for hepatic glucose production. J Biol Chem 277: 50237–50244, 2002 [DOI] [PubMed] [Google Scholar]
- 49. Yamamoto K, Fukuda N, Zhang L, Sakai T. Altered hepatic metabolism of fatty acids in rats fed a hypolipidaemic drug, fenofibrate. Pharmacol Res 33: 337–342, 1996 [DOI] [PubMed] [Google Scholar]