

Abstract
In dogs consuming a high-fat and -fructose diet (52 and 17% of total energy, respectively) for 4 wk, hepatic glucose uptake (HGU) in response to hyperinsulinemia, hyperglycemia, and portal glucose delivery is markedly blunted with reduction in glucokinase (GK) protein and glycogen synthase (GS) activity. The present study compared the impact of selective increases in dietary fat and fructose on liver glucose metabolism. Dogs consumed weight-maintaining chow (CTR) or hypercaloric high-fat (HFA) or high-fructose (HFR) diets diet for 4 wk before undergoing clamp studies with infusion of somatostatin and intraportal insulin (3–4 times basal) and glucagon (basal). The hepatic glucose load (HGL) was doubled during the clamp using peripheral vein (Pe) glucose infusion in the first 90 min (P1) and portal vein (4 mg·kg−1·min−1) plus Pe glucose infusion during the final 90 min (P2). During P2, HGU was 2.8 ± 0.2, 1.0 ± 0.2, and 0.8 ± 0.2 mg·kg−1·min−1 in CTR, HFA, and HFR, respectively (P < 0.05 for HFA and HFR vs. CTR). Compared with CTR, hepatic GK protein and catalytic activity were reduced (P < 0.05) 35 and 56%, respectively, in HFA, and 53 and 74%, respectively, in HFR. Liver glycogen concentrations were 20 and 38% lower in HFA and HFR than CTR (P < 0.05). Hepatic Akt phosphorylation was decreased (P < 0.05) in HFA (21%) but not HFR. Thus, HFR impaired hepatic GK and glycogen more than HFA, whereas HFA reduced insulin signaling more than HFR. HFA and HFR effects were not additive, suggesting that they act via the same mechanism or their effects converge at a saturable step.
Keywords: Glucokinase, glycogen, glycogen synthase, glycogen phosphorylase, insulin signaling
excess consumption of dietary fat and fructose or sucrose, in what has been commonly referred to as a “Western” diet, has been suggested to play a role in the obesity and diabetes epidemic within the US (47–49). High fat and fructose intakes are associated with the development of impaired glucose tolerance (IGT) (e.g., see Refs. 2, 10, and 42), suggesting that the liver is a key target of these diets. Failure of the liver to transition from net output to uptake of glucose is associated with the development of IGT and hyperglycemia (5, 30). Unfortunately, hepatic glucose uptake (HGU) is difficult, if not impossible, to quantify in the human and many animal models because of the invasiveness of the procedures required and the difficulty in cannulating the hepatic vasculature. The dog has proven to be a useful model for examination of HGU and postprandial metabolism (reviewed in Ref. 34).
In the dog, 4 wk of high-fat plus high-fructose feeding [high-fat and -fructose diet (HFFD)] impairs glucose tolerance and renders the liver resistant to the stimulatory effects of hyperinsulinemia, hyperglycemia, and portal glucose delivery on HGU and glycogen synthesis (10). Two enzymes especially important to those processes are hepatic glucokinase (GK), the rate-determining enzyme in HGU, and glycogen synthase (GS), which is required for storage of the glucose taken up by the liver. Previously, we demonstrated that 4 wk of HFFD in dogs is associated with diminished GK and GS activity, impaired HGU, and reduced glycogen synthesis during a hyperinsulinemic hyperglycemic clamp in the presence of portal glucose delivery (the portal glucose signal) (9). However, we cannot ascertain from those data whether excess dietary fat, fructose, or both are required to elicit aberrant hepatic glucose flux under conditions that mimic the postprandial state. To form a basis for further study and eventually translate the knowledge into public health measures, it is important to separate the effects of fat vs. fructose. Thus, the aim of this study was to determine which macronutrient (fat or fructose) is the primary contributor to metabolic dysfunction seen after 4 wk of feeding or whether both are required.
RESEARCH DESIGN AND METHODS
Animal Care and Surgical Procedures
The protocol was approved by the Vanderbilt University Institutional Animal Care and Use Committee, and the animals were housed and cared for according to Association for Assessment and Accreditation of Laboratory Animal Care guidelines. Adult male mongrel dogs (n = 5/group) were fed a meat/laboratory chow diet [control (CTR); Kal Kan, Franklin, TN, and PMI Nutrition LabDiet, Richmond, IN], a high-fat diet (HFA; TestDiet, Richmond, IN), or a high-fructose diet (HFR; TestDiet) once daily for 4 wk (Table 1). The dogs in the CTR group were fed amounts calculated to achieve weight maintenance. The percentage of energy provided as fructose in the HFR was chosen to approximate the 90th percentile of fructose intakes among US adults and adolescents (51), and the fat and saturated fat percentage contents of the HFA diet were >95th percentile for individuals >1 yr of age in the US (3). Energy consumption of dogs in HFA and HFR was matched, but both groups were hypercaloric relative to CTR (Fig. 1).
Table 1.
Macronutrient composition of diets
| %Total Energy |
|||
|---|---|---|---|
| Macronutrient | CTR | HFA | HFR |
| Protein | 31 | 22 | 26 |
| Fat (total) | 26 | 52 | 26 |
| Saturated fat | 11* | 23 | 11 |
| Monounsaturated fat | 10* | 22 | 11 |
| Polyunsaturated fat | 4* | 7 | 4 |
| Carbohydrate (total) | 43 | 26 | 48 |
| Starch | 41 | 21 | 24 |
| Glucose | <0.1 | <0.1 | <0.1 |
| Fructose | <0.1 | <0.1 | 17 |
| Sucrose | 1.3 | <0.1 | <0.1 |
| Lactose | <0.1 | <0.1 | <0.1 |
CTR, chow and meat control diet; HFA, high-fat diet; HFR, high-fructose diet.
Values are approximate; information not available from the manufacturer of the meat in the diet.
Fig. 1.
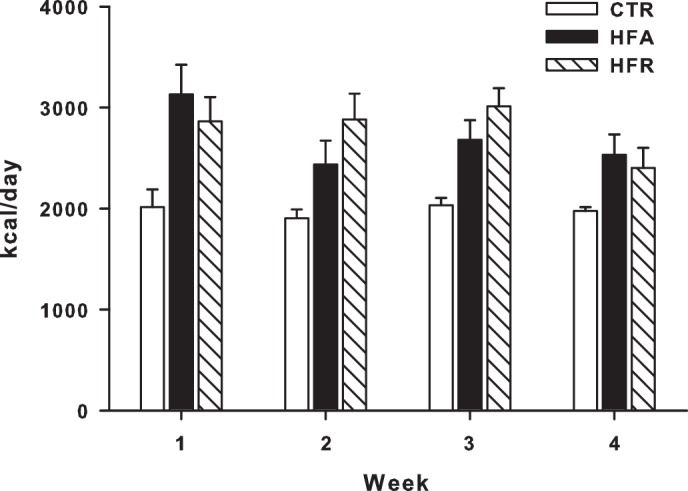
Mean daily energy intake. Daily energy intake was recorded in dogs fed a control (CTR), a high-fat (HFA), or a high-fructose (HFR) diet for 4 wk. Data are means ± SE; n = 5/group. Dogs fed the HFA or HFR diets were provided isoenergetic quantities of their respective diets over the course of 4 wk, but both groups were hypercalorically fed relative to CTR dogs.
Experimental Design
After 4 wk of experimental diet feeding, hyperinsulinemic hyperglycemic (HIHG) clamp experiments were conducted on conscious dogs following an 18-h fast. Just prior to beginning the fast, each dog was fed a can of meat to ensure equivalent energy and macronutrient consumption among groups on the day before study. Each experiment consisted of a 100-min equilibration period (−120 to −20 min), a 20-min period for basal sampling (−20 to 0 min), and a 180-min experimental period divided into two subperiods (P1, 0–90 min; P2, 90–180 min). At −120 min, a priming dose of [3-3H]glucose (38 μCi) was delivered, and a constant infusion of [3-3H]glucose (0.38 μCi/min) was initiated. At time 0, a constant peripheral venous infusion of somatostatin (0.8 μg·kg−1·min−1) was begun, and insulin and glucagon were infused intraportally at three to four times basal (1.2 mU·kg−1·min−1) and basal (0.55 ng.kg−1.min−1) rates, respectively. A variable peripheral infusion of 50% dextrose was also begun to double the hepatic glucose load (HGL). In P2, 20% dextrose was infused intraportally at 4.0 mg·kg−1·min−1, and the peripheral glucose infusion rate was reduced at the same time so that HGL was equivalent during P1 and P2. Throughout P1 and P2, the arterial glucose concentrations were analyzed at 5-min intervals, and the peripheral glucose infusion rate was adjusted as necessary to maintain comparable concentrations in all animals and to maintain the HGL at a stable level within each animal. At the end of the study, each animal was anesthetized with pentobarbital sodium, whereas all infusions were continued, and liver tissue was freeze-clamped in situ and stored at −80°C for later analysis. Then the animal was euthanized.
Analyses
Real-time PCR and western blotting.
RNA isolation, cDNA synthesis, quantitative PCR primers and analysis, and Western blotting procedures were performed as described previously (13, 41). The GK antibody was a gift from Dr. Masakazu Shiota (Vanderbilt University School of Medicine). All other antibodies were purchased from Santa Cruz Biotechnology [actin and GK regulatory protein (GKRP)] or Cell Signaling Technology [phosphorylated Akt (Ser473) and GSK-3β]. Test protein bands were quantified using ImageJ software (http://rsb.info.nih.gov/ij/), and all were normalized to actin.
Enzyme activity.
GK activity was assessed as described previously (4). GS activity ratio was calculated as activity measured at low glucose 6-phosphate (G6P; 160 μM) vs. high G6P (6.7 mM) concentrations [GS-(L/H) ratio of low to high G6P], with low UDP glucose (134 μM) (23). Glycogen phosphorylase (GP) activity was assessed by measuring the incorporation of [14C]glucose from [14C]glucose 1-phosphate into glycogen in the absence or presence of 2 mM AMP (20). G6P concentrations were determined by the method of Michal (33).
Biochemicals.
Plasma glucose, [3H]glucose, glucagon, insulin, and nonesterified fatty acid (NEFA) levels and blood lactate and glycerol concentrations were measured using standard methods, as described previously (19, 36). Liver glycogen levels were determined by the method of Keppler and Decker (26).
Hepatic tissue lipids were extracted using the method of Folch et al. (16) and separated by thin-layer chromatography using Silica Gel 60 A plates developed in petroleum ether, ethyl ether, and acetic acid (80:20:1) and visualized by rhodamine 6G. Individual lipid classes were scraped from the plates and methylated using BF3/methanol, as described by Morrison and Smith (37). The methylated fatty acids were extracted and analyzed by gas chromatography, with dipentadecanoyl phosphatidylcholine (C15:0), diheptadecanoin (C17:0), trieicosenoin (C20:1), and cholesteryl eicosenoate (C20:1) used as standards.
Calculations
Unidirectional HGU was calculated by multiplying the hepatic fractional extraction of [3H]glucose by the HGL (mg·kg−1·min−1), as described previously (9). It should be stressed that this approach yields HGU rather than net HGU. Net hepatic substrate balances, net hepatic carbon retention, and nonhepatic glucose uptake (non-HGU) were calculated with the arteriovenous difference method, as described previously (10). Non-HGU is the difference between the glucose infusion rate (GIR) and net hepatic glucose balance (NHGB), adjusted for change in the size of the glucose pool, as described previously (52). An indirect method was utilized for calculation of NHGB, comprised of net hepatic glucose output (NHGO) and uptake (NHGU), to reduce any error introduced by streaming of infusate in the portal vein (10). Thus, HGU and NHGU provide independent assessments of liver glucose uptake, both of which have inherent noise. Attributing meaning to their differences is thus not useful. Tracer-determined glucose disappearance (Rd) was calculated from isotope dilution (50). Plasma insulin and glucagon levels entering the hepatic sinusoids were calculated as described elsewhere (13). The incorporation of glucose into glycogen through the direct pathway was calculated by dividing hepatic 3H-labeled glycogen by the average inflowing plasma [3H]glucose-specific radioactivity (44).
Statistical Analyses
All data are presented as means ± SE. Mean values for P1 or P2 are the means for the last hour of each period. Two-way analysis of variance with or without repeated-measures design was used (SigmaStat; Systat, Richmond, CA), and post hoc analysis was performed using the Student-Newman-Keuls multiple-comparisons test. Significance was established when P was <0.05.
RESULTS
Weight Change
Body weights at the beginning of dietary intervention were not different among the groups (24.9 ± 1.6, 24.9 ± 0.8, and 25.9 ± 1.0 kg in CTR, HFA, and HFR, respectively). The cumulative weight changes during the 4 wk of dietary intervention were −0.8 ± 0.4, 2.2 ± 0.5, and 1.6 ± 0.5 kg, respectively (P < 0.005 for HFA and HFR vs. CTR).
Plasma Hormone Concentrations
Fasting arterial plasma insulin levels were increased in HFR and HFA (70 and 55%, respectively, P < 0.05) relative to CTR (mean of the values in the basal period: 8.0 ± 1.6, 13.6 ± 1.2, and 12.4 ± 1.6 μU/ml in CTR, HFR, and HFA, respectively; Fig. 2). Consistent with this, arterial plasma C-peptide concentrations tended to be elevated in HFR and HFA (0.36 ± 0.0 and 0.43 ± 0.08 ng/ml, respectively, vs. 0.23 ± 0.03 ng/ml in CTR; P = 0.15 and 0.08). There was no effect of diet on fasting arterial plasma glucagon levels. During the HIHG clamp, arterial and hepatic sinusoidal insulin concentrations increased similarly (3- to 4-fold basal) in all groups, and arterial and hepatic sinusoidal glucagon concentrations remained basal (Fig. 2).
Fig. 2.

Plasma hormone concentrations during hyperinsulinemic hyperglycemic (HIHG) clamps. Arterial plasma insulin (A) and glucagon (B) and hepatic sinusoidal insulin (C) and glucagon (D) during basal (−20 to 0 min) and experimental periods (0–180 min) of HIHG clamps in CTR (◻), HFA (▲), or HFR (○) diet groups. Po, portal. Data are means ± SE; n = 5/group. *P < 0.05, CTR vs. other groups.
Blood Glucose, HGL, and HGU
Fasting blood glucose concentrations did not differ among groups during the basal period. During P1, arterial blood glucose concentrations were increased to ≈163 mg/dl in all groups (P < 0.05 vs. basal period) to double the HGL (Fig. 3). During P2, arterial blood glucose was clamped at a slightly reduced concentration (≈150 mg/dl) to maintain a doubling of the hepatic glucose load in the presence of intraportal glucose infusion. The portal blood glucose concentrations in the three groups averaged ≈160 and 165 mg/dl during P1 and P2, respectively, such that the arterial-portal glucose gradient (mg/dl) was 3 in P1 and −15 in P2. Total hepatic blood flow was similar among groups under basal conditions and throughout the clamp (data not shown).
Fig. 3.

Arterial blood glucose (A), hepatic glucose load (HGL; B), unidirectional hepatic glucose uptake (HGU; C and D), and net hepatic glucose balance (NHGB; E and F) in CTR (◻), HFA (▲), and HFR (○) during the basal (−20 to 0 min) and experimental periods (0–180 min) of HIHG clamps. Data are means ± SE; n = 5/group. *P < 0.05 vs. CTR.
Basal HGU averaged 0.2–0.5 mg·kg−1·min−1 in all groups (Fig. 3). Combined hyperinsulinemia and hyperglycemia stimulated an increase in HGU and CTR, with a mean rate of 1.7 ± 0.3 mg·kg−1·min−1 during the last hour (steady-state period) of P1 (P < 0.05 vs. basal period). Delivery of glucose into the portal vein augmented HGU even further (mean of 2.8 ± 0.3 mg·kg−1·min−1 during the last hour of P2; Fig. 3). In contrast, both high-fat and high-fructose feeding for 4 wk impaired the liver's response to the stimulatory effects of combined hyperinsulinemia, hyperglycemia, and portal glucose delivery on HGU. Whereas the mean rate of HGU in HFA during P1 (1.0 ± 0.3 mg·kg−1·min−1) did not differ significantly from that in CTR, the rate in HFR (0.6 ± 0.2 mg·kg−1·min−1) was significantly less than in CTR (Fig. 3). In the presence of portal glucose delivery (P2), on the other hand, both groups displayed significantly lower rates of HGU relative to CTR. This was due to further stimulation of HGU during P2 in CTR and the lack of such an effect in both HFA and HFR.
Basal rates of tracer-determined hepatic glucose production (HGP) were very similar among all groups (≈2.2 mg·kg−1·min−1). During P1, HGP was quickly and fully suppressed in CTR (averaging only 0.2 ± 0.3 mg·kg−1·min−1 during the last hour of P1), but it was less suppressed in the other groups (to 1.0 ± 0.4 and 1.3 ± 0.2 mg·kg−1·min−1 in the HFA and HFR groups, respectively; P = 0.09 and P < 0.01, respectively, vs. CTR). During P2, HGP in was zero in all groups, with no significant differences among groups (data not shown).
During the basal period, all groups were in a state of net hepatic glucose output (Fig. 3). The CTR group switched to NHGU within 30 min of the start of the HIHG clamp, and intraportal glucose delivery during P2 enhanced NHGU 2.1 mg·kg−1·min−1 over the rate observed in P1. During P1, NHGO in HFA was rapidly and fully suppressed (with NHGO reaching 0.1 ± 0.1 mg·kg−1·min−1 during the last hour of P1). The addition of portal glucose delivery during P2 increased NHGU by 1.7 ± 0.2 mg·kg−1·min−1, an increment not significantly different from that in the CTR group. Thus the enhancement of NHGU by the glucose portal signal appeared intact. Nevertheless, the actual rate of NHGU in HFA was significantly blunted compared with CTR during both P1 and P2. In the HFR group, NHGO was not fully suppressed during P1 (0.8 ± 0.2 mg·kg−1·min−1), and the group only exhibited NHGU of 0.8 ± 0.3 mg·kg−1·min−1 during the last hour of P2 (P < 0.01 vs. CTR group). Thus the response to the portal glucose signal was lost.
The peripheral venous GIR required to maintain hyperglycemia did not differ significantly among groups, probably because of the large variance in the response of the CTR animals, and there were no significant differences among the groups in either non-HGU or tracer-determined Rd (Table 2). Rd was numerically higher in CTR than in the other two groups (P = 0.3 for both groups vs. CTR), whereas non-HGU was not; thus the trend toward a higher Rd in CTR was consistent with the greater liver glucose uptake in that group.
Table 2.
Rates of glucose infusion, nonhepatic glucose uptake, and glucose Rd
| Experimental Period |
|||
|---|---|---|---|
| Group | Basal Period | Period 1 (−PoG) | Period 2 (+PoG) |
| Total glucose infusion rate, mg·kg−1·min−1 | |||
| CTR | 0.0 ± 0.0 | 9.0 ± 3.0 | 10.2 ± 2.4 |
| HFA | 0.0 ± 0.0 | 5.7 ± 0.8 | 8.4 ± 1.2 |
| HFR | 0.0 ± 0.0 | 4.9 ± 0.6 | 8.5 ± 1.2 |
| Nonhepatic glucose uptake, mg·kg−1·min−1 | |||
| CTR | 1.7 ± 0.2 | 6.8 ± 2.1 | 6.3 ± 2.4 |
| HFA | 1.8 ± 0.2 | 5.7 ± 0.6 | 6.4 ± 1.0 |
| HFR | 2.0 ± 0.1 | 5.9 ± 0.5 | 7.2 ± 1.0 |
| Glucose Rd, mg·kg−1·min−1 | |||
| CTR | 2.5 ± 0.2 | 7.1 ± 1.6 | 9.0 ± 2.0 |
| HFA | 2.7 ± 0.2 | 6.4 ± 0.5 | 7.7 ± 1.0 |
| HFR | 2.6 ± 0.2 | 6.1 ± 0.4 | 7.8 ± 1.0 |
Values are means ± SE; n = 5/group. Rd, glucose disappearance; −PoG, no portal glucose; +PoG, portal glucose infusion. The glucose infusion rate (GIR) during period 2 is the sum of the portal and peripheral GIRs; the portal GIR was 4 mg·kg−1·min−1 in all groups. There were no significant differences among groups.
Lactate Metabolism
All groups exhibited similar arterial blood lactate concentrations and rates of net hepatic lactate uptake (NHLU) under basal conditions (Fig. 4). In the CTR and HFA groups, hyperinsulinemia and hyperglycemia elicited an increase in arterial blood lactate levels coincident with a switch from NHLU to output (NHLO), although NHLO was significantly lower in HFA vs. CTR. In contrast, arterial blood lactate levels were not significantly elevated from basal during either test period in HFR, and these animals exhibited NHLU for the entire study (P < 0.05 vs. CTR and HFA).
Fig. 4.

Arterial blood lactate (A) and glycerol (C) and plasma nonesterified fatty acid (NEFA; E) concentrations and net hepatic balances of lactate (B), glycerol (D), and NEFA (F) during basal (−20 to 0 min) and experimental periods (0–180 min) of HIHG clamps in CTR (◻), HFA (▲), and HFR (○) diet groups. Data are means ± SE; n = 5/group. *P < 0.05, CTR vs. other groups; **P < 0.05, HFR vs. other groups; †P < 0.05, HFA vs. CTR; ‡P < 0.05, HFR vs. CTR.
Glycerol, NEFA, and Triglyceride Metabolism
During the basal period, arterial blood glycerol concentrations were significantly elevated in HFA and HFR vs. CTR, whereas net hepatic glycerol uptake was significantly higher only in HFR (Fig. 4). Fasting arterial plasma NEFA concentrations and net hepatic NEFA uptakes were not different among groups. Glycerol and NEFA concentrations declined in response to hyperinsulinemia in all groups, but the glycerol concentrations remained higher in the HFA and HFR groups than in CTR during the clamp. The net hepatic uptake rates of glycerol and NEFA decreased in parallel to the changes in their circulating concentrations and were not different in either HFA or HFR vs. CTR during P1 or P2 (Fig. 4).
Fasting plasma total triglyceride concentrations did not differ among diet groups (1,156 ± 284, 1,165 ± 156, and 1,148 ± 28 μmol/l in CTR, HFA, and HFR, respectively, P = 0.8). Likewise, terminal liver triglyceride levels were not statistically different among groups (μg/mg liver: CTR 1.6 ± 0.2, HFA 2.0 ± 0.3, and HFR 1.8 ± 0.2; P =0.4). Additionally, the predominant fatty acid species in liver triglycerides in all groups was 18:1 (35–40%), followed by 18:2 (22–28%) and 16:0 (20–22%), with no differences in lipid species among groups.
Hepatic GK and GKRP
Relative hepatic GK mRNA expression in hepatic biopsies taken at the end of study was not significantly different among groups. GK protein content and its catalytic activity were reduced by 43 and 56%, respectively, in HFA vs. CTR (P < 0.05; Fig. 5). In HFR, GK protein content and activity were reduced even further (58 and 74%, respectively, P < 0.05 vs. CTR and HFA). There was also a significant but more modest decrease in GKRP protein (Fig. 5).
Fig. 5.

Hepatic glucokinase (GK) and glucokinase regulatory protein (GKRP) and phosphorylated (p)-Akt, a marker of insulin signaling. Levels of GK mRNA (A), protein (B), and activity (C), GKRP protein (D), and p-Akt on Ser473 (E) in CTR (open bars), HFA (black bars), and HFR (hatched bars) groups. All proteins are expressed relative to tissue actin, and data for the HFA and HFR groups are normalized to those in CTR. Data are means ± SE; n = 5/group. Groups with the same letters are not significantly different from each other; where there are no letters, there are no significant differences among groups.
Hepatic Insulin Signaling and Glycogen Metabolism
The phosphorylation of Akt was significantly lower (21%) in HFA compared with CTR, whereas there was only a minor (9%) and nonsignificant decline in HFR (Fig. 5). In keeping with this, the fractional activity ratio (active/total) of GS was reduced by 50 and 25% in HFA and HFR, respectively, although only HFA was statistically different (P < 0.05) from CTR (Fig. 6). On the other hand, the activity ratio of GP tended to be elevated by the dietary modifications (140 and 51% greater than CTR in HFA and HFR, respectively; P = 0.06 and 0.05, respectively, vs. CTR). When the activity ratios of GS and GP were themselves expressed as a ratio, they were significantly lower in both HFA (0.26) and HFR (0.61) than in CTR (1.26), although there were no significant differences in HFA and HFR vs. CTR with regard to total activity of either enzyme. Moreover, terminal liver glycogen levels were significantly lower in HFR and tended to be lower in HFA than in CTR (Fig. 6). Net hepatic carbon retention, an indicator of net hepatic glycogen synthesis, followed the same pattern as terminal glycogen concentrations [9.8 ± 1.0, 5.9 ± 1.7, and 3.7 ± 1.1 mg/g liver in CTR, HFA, and HFR, respectively (P = 0.09 and 0.004 vs. CTR)]. Likewise, the incorporation of glucose into glycogen through the direct synthetic pathway (glucose → glucose 6-phosphate → glucose 1-phosphate → UDP-glucose → glycogen) was markedly decreased in both HFR and HFA (78 and 62%, respectively, P < 0.05 vs. CTR), with the reduction being significantly greater in HFR than in HFA (Fig. 6). Hepatic G6P did not differ significantly among groups (71 ± 12, 63 ± 8, and 85 ± 17 nmol/g liver in CTR, HFA, and HFR, respectively). The phosphorylation of GSK-3β was also similar among groups (relative protein: 1.00 ± 0.04, 0.97 ± 0.09, and 1.01 ± 0.06 in CTR, HFA, and HFR, respectively).
Fig. 6.
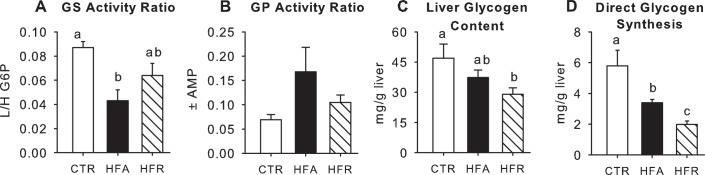
Markers of hepatic glycogen metabolism. Activity ratios of glycogen synthase (GS; A) and glycogen phosphorylase (GP; B), terminal liver glycogen concentrations (C), and glycogen synthesized via the direct pathway (D) for CTR (open bars), HFA (black bars), and HFR (hatched bars). Data are means ± SE; n = 5/group. Groups with the same letters are not significantly different from one another; where there are no letters, there are no significant differences among groups. L/H, ratio of low to high glucose 6-phosphate.
DISCUSSION
Numerous studies have described the adverse metabolic effects of high dietary fat (27–29, 43) or fructose (39, 40, 46) on whole body insulin action and hepatic glucose metabolism; however, most of those studies were conducted under hyperinsulinemic euglycemic conditions in which the liver was only a minor contributor to whole body glucose disposal and the liver's ability to take up glucose was not evaluated. In the current studies, we utilized conditions that normally stimulate liver glucose uptake and found that either a high-fat or a high-fructose diet significantly impaired HGU and NHGU in response to the combination of hyperinsulinemia and hyperglycemia, with or without portal glucose delivery. In the HFR group, not only was NHGU markedly blunted in response to the combination of hyperinsulinemia and hyperglycemia brought about with peripheral glucose infusion (P1), but also, the enhancement of NHGU in response to the portal glucose delivery (P2) was lost. In the HFA group, NHGU during P1 was significantly reduced compared with CTR, but the enhancement of NHGU in response to portal glucose delivery remained intact. Nevertheless, because of the blunting of NHGU during P1, the rate of NHGU during P2 remained significantly reduced in HFA compared with CTR.
In our previous study using a diet high in both fat and fructose (HFFD) carried out under conditions similar to these, we observed that the HFFD was associated with the loss of the enhancement of NHGU in response to the portal glucose signal as well as a marked reduction in GK protein and in activation of GS compared with the weight-maintaining control diet (9). Our primary goal in the current studies was to determine which of the dietary components, fat or fructose, was most responsible for the defects or whether they had additive effects. For this reason, we compared the HFA and HFR diets to the same CTR diet we used previously. However, this means that we have not examined the effect of overfeeding per se on the liver, and it would interesting in the future to examine animals given an excess of the chow diet.
GK Protein and Activity
In our previous investigation comparing chow-fed control dogs and those receiving HFFD (9), which followed a protocol identical to the current one, we also collected hepatic tissue under basal conditions (euglycemia and euinsulinemia) from dogs that did not undergo the study so that we could examine the increases in GK that occurred during the clamp. In both the CTR and HFFD dogs in that investigation, GK mRNA increased ≈24-fold above basal by the end of P2. However, the ability of the portal glucose signal to increase both GK protein and activity was abolished by the HFFD. Similarly, in the current investigation, the increase in GK mRNA caused by hyperinsulinemia, hyperglycemia, and the portal glucose signal (≈24-fold) was not impacted significantly by either the HFA or HFR diets. Additionally, both diets suppressed GK protein and activity, suggesting that they also abolished the ability of portal glucose delivery to increase the activity of GK, the rate-limiting enzyme for hepatic glucose utilization (15). In fact, the decrease in GK activity in HFR relative to CTR was equivalent in magnitude to the decrease observed previously in dogs fed a combination of high fat and fructose (9). Thus, as was true for HGU, the effects of high dietary fat and fructose on hepatic GK activity were not additive, with a saturable effect being seen in response to a selective physiological increase in dietary fructose alone. Furthermore, the differences in GK protein among groups mirrored the differences in HGU and net hepatic lactate balance (see below), underscoring the fact that GK serves a critical function in facilitating the normal response of the liver to elevated glucose and insulin.
Hepatic GK mRNA expression is dependent on insulin (24, 31), and the higher basal insulin concentrations in the HFA and HFR groups, relative to CTR, likely helped sustain GK mRNA expression in those groups. A significant decline in GK protein content in HFA and HFR vs. CTR in the absence of a difference between groups in relative GK expression suggests either that the translation of GK mRNA was impaired or that the turnover (degradation) of GK protein was enhanced. Although rodent studies have generally shown that hepatic GK mRNA, as well as protein and activity, are reduced by high-fat feeding (11, 12, 25, 38), these findings are not universal (21, 53). Gorman et al. (21) reported an actual increase in hepatic GK mRNA in wild-type mice on a high-fat vs. chow diet. Additionally, the effect of high-fructose feeding on hepatic GK activity is unclear. Bizeau et al. (6) demonstrated a significant decrease in GK activity in primary cultures of periportal hepatocytes isolated from rats that were fed a high-sucrose diet (in which 35% of the energy was derived from fructose) for 1 wk. Conversely, liver GK activity was increased in rats that consumed 10% fructose in their drinking water for 3 wk (17, 18), although they also exhibited impaired glucose tolerance, fasting hyperglycemia, hyperinsulinemia, hypertriglyceridemia, and increased liver triglyceride content. Thus, it is difficult to ascertain whether excess fructose per se contributed to modulation of liver GK activity in that study. In the present study, hepatic GKRP content was significantly reduced only in HFR dogs, although it tended to be lower in the HFA group than in CTR. GKRP is thought to exert a permissive effect on GK protein content by protecting it from degradation (14, 22). Thus, a decrease in GKRP might have contributed to the exaggerated decline of hepatic GK protein observed in HFR dogs and the more modest fall in HFA. Despite the diminished GK protein and activity, we were unable to detect differences among groups in hepatic G6P levels.
Glycolytic Flux
The transition from NHLO to uptake is a marker of the transition from the fed to fasting state, and it occurs ≈24 h after once daily feeding of the diet received by the CTR dogs (1, 35). All groups were in a state of NHLU during the basal period because they were underfed relative to their energy requirements on the day prior to study to achieve similar fasting states with the three different diet treatments. NHLU persisted in the HFR group for the duration of the experiment, whereas the livers of dogs in the other groups switched rapidly from NHLU to NHLO upon initiation of hyperinsulinemia and hyperglycemia. In our previous studies (9), dogs fed the HFFD did not switch from NHLU to NHLO under identical experimental conditions. Thus, it would appear that a selective increase in dietary fructose elicits greater impairment in net hepatic glycolytic flux than a selective increase in dietary fat. However, even in the HFA group, NHLO was significantly reduced relative to CTR. The impact of the HFA and HFR diets on lactate metabolism was due possibly to impaired insulin-mediated activation of rate-limiting enzymes involved in the glycolytic pathway (phosphofructokinase-1/2 and pyruvate kinase) and/or a decrease in the amount of substrate available for catabolism through the glycolytic pathway secondary to impaired HGU. During the clamp period, arterial blood glycerol concentrations were higher, and plasma NEFA concentrations tended to be higher, in the HFA and HFR groups than in CTR. Chu et al. (7) demonstrated that elevation of plasma NEFA levels via infusion of lipid emulsion and heparin completely eliminated the ability of hyperglycemia per se to cause NHLO, a finding attributable to stimulation of hepatic gluconeogenic flux and presumably inhibition of glycolysis (2). However, the similarity in NEFA and glycerol concentrations in HFA and HFR suggests that this was not the reason, or at least not the sole reason, for the HFR group's failure to switch to NHLO during the clamp.
Insulin Resistance
There was dissociation among diet groups in the present study with regard to the impact of insulin on phosphorylated Akt during the clamp. The HFA group exhibited a significant, albeit modest, decrease in Akt phosphorylation relative to CTR. In agreement with this finding, the activity ratio of glycogen synthase, a reflection of its phosphorylation state, was also significantly reduced in HFA vs. CTR, whereas the activity ratio of GP tended to be increased. On the other hand, in HFR, Akt phosphorylation was reduced minimally, and the GS and GP activity ratios tended to change less than with HFA. Nevertheless, there was a tendency for GS and GP to be aberrantly regulated such that when GS and GP were themselves expressed as a ratio, there was a significant decrease in both HFA and HFR vs. CTR. Consistent with this, terminal liver glycogen levels were significantly reduced in HFR, and direct glycogen synthesis was reduced in both HFA and HFR vs. CTR, with HFR impacted more than HFA. These findings are consistent with the decreases in GK and HGU in these groups. Thus, high-fat feeding was associated with greater impairment in Akt phosphorylation and in the covalent regulation of GS and GP than HFR, whereas high-fructose feeding was associated with greater impairment in hepatic glycogen synthesis, which was most likely associated with a larger deficit in GK activity, resulting in insufficient provision of the substrate required for the synthesis of liver glycogen. On the other hand, in HFA, changes in the concentrations of allosteric effectors of GS and GP in vivo could have been sufficient to partially override covalent inhibition of GS, thereby allowing some glycogen synthesis. Nevertheless, in our earlier study, the combination of high dietary fat and fructose under similar experimental conditions did not result in a further decline in the activity ratio of GS, a further increase in the activity ratio of GP, or a greater impairment in hepatic glycogen synthesis (9). Thus, the relative contributions of fat and fructose to aberrant hepatic glycogen synthesis are also not additive (Table 3). In contrast to the marked effects of the modified diets, particularly HFA and HFR, on hepatic glucose metabolism under hyperinsulinemic and hyperglycemic conditions, the nonhepatic tissues appeared to be minimally affected, with no significant differences among groups in the absolute rates of non-HGU in either period of the clamp.
Table 3.
Relative responses to the hyperinsulinemic hyperglycemic clamp
| Group | ↑HGU | ↓HGP | GK Activity | GS/GP | Glycogen Synthesis |
|---|---|---|---|---|---|
| CTR | ++++ | ++++ | ++++ | ++++ | ++++ |
| HFA | ++ | ++ | ++ | + | ++ |
| HFR | + | + | + | ++ | + |
| HFA + HFR* | + | + | + | + | + |
↑HGU and ↓HGP, increase in hepatic glucose uptake and decrease in hepatic glucose production, respectively, under clamp conditions; GK, glucokinase; GS/GP, ratio of glycogen synthase activity to glycogen phosphorylase activity.
From our previous publication (9) and shown for reference. +, ++, and ++++ represent the magnitude of the effect, which varies such that + is the smallest effect. Increasing effects are shown by ++, and ++++ represents the greatest effect.
Summary and Conclusions
Both HFA and HFR diet consumption for 4 wk significantly impaired hepatic GK activity, HGU, NHGU, and direct glycogen synthesis. Nevertheless, the HFR diet impacted the magnitude of the decrease in GK activity more than the HFA diet. Removal of the fructose component from a diet rich in both fat and fructose ameliorated the severity of the defect in GK activity, HGU, NHGU, and hepatic glucose disposition; on the other hand, removal of excess fat in the presence of high dietary fructose attenuated the severity of the defect in insulin signaling. Our results are especially important in that they demonstrate that excess consumption of dietary fat or fructose per se induces a significant posttranscriptional decrease in GK protein and an abnormality in liver glucose uptake in a model in which the finding is not confounded by coincident development of gluco- or lipotoxicity (e.g., see Refs. 8, 32, and 45). These complications can obscure a primary effect of fat and/or fructose on the liver. In the current studies, circulating and hepatic triglycerides, as well as fasting plasma glucose, did not rise in the HFA and HFR groups. Moreover, in previous work carried out in our laboratory, histological examination of livers of high-fat-treated dogs revealed little or no fatty infiltration (Grueter CA and Cherrington AD, unpublished observations). Thus, our results reflect the impacts of the dietary components themselves and not the secondary effects of impaired liver function resulting from fatty infiltration.
Given that rates of HGU under the same experimental conditions in dogs fed a diet high in both fat and fructose were similar to those observed in HFR in the present study, as well as the fact that the sum of the individual effects of HFA and HFR on HGU, glycogen synthesis, and GK activity exceeded those in dogs fed the HFFD (9), the adverse effects of high dietary fat or fructose on the response of the liver to hyperinsulinemia, hyperglycemia, and portal glucose delivery do not appear to be additive. This suggests that the HFA and HFR diets utilize the same pathway to impair HGU or that they signal through separate pathways that converge at the same rate-limiting, saturable step.
GRANTS
This research was supported in part by National Institute of Diabetes and Digestive and Kidney Diseases Grants R01-DK-18243 (to A. D. Cherrington) and R37-DK-27221 (to P. J. Roach) as well as the Metabolic Physiology Shared Resource, Hormone Assay and Analytical Services, and Lipid Cores of the Vanderbilt University Medical Center Diabetes Research and Training Center Grants DK-20593 and DK-059637.
DISCLOSURES
No conflicts of interest, financial or otherwise, are declared by the authors.
AUTHOR CONTRIBUTIONS
K.C.C. and A.D.C. conception and design of research; K.C.C., G.K., B.F., and D.W.N. performed experiments; K.C.C., M.S.S., C.J.R., J.M.I., and A.D.C. analyzed data; K.C.C., J.M.I., P.J.R., P.E.W., and A.D.C. interpreted results of experiments; K.C.C. and M.C.M. prepared figures; K.C.C. drafted manuscript; K.C.C., G.K., M.C.M., J.M.I., P.J.R., and A.D.C. edited and revised manuscript; K.C.C., G.K., M.C.M., M.S.S., C.J.R., J.M.I., P.J.R., P.E.W., and A.D.C. approved final version of manuscript.
ACKNOWLEDGMENTS
We greatly appreciate the technical assistance and support of Margaret Lautz, Jon Hastings, and Patsy Raymer.
A. D. Cherrington is the Jacquelyn A. Turner and Dr. Dorothy J. Turner Chair in Diabetes Research. Current affiliation of K. C. Coate: Department of Pharmacology, University of Texas Southwestern Medical Center, Dallas, TX. Current affiliation of C. J. Ramnanan: University of Ottawa Faculty of Medicine, Ottawa, ON, Canada. Current affiliation of J. M. Irimia: Department of Pathology, Indiana University School of Medicine, Indianapolis, IN.
REFERENCES
- 1. Adkins-Marshall BA, Myers SR, Hendrick GK, Williams PE, Triebwasser K, Floyd B, Cherrington AD. Interaction between insulin and glucose-delivery route in regulation of net hepatic glucose uptake in conscious dogs. Diabetes 39: 87–95, 1990 [DOI] [PubMed] [Google Scholar]
- 2. Alves TC, Befroy DE, Kibbey RG, Kahn M, Codella R, Carvalho RA, Falk Petersen K, Shulman GI. Regulation of hepatic fat and glucose oxidation in rats with lipid-induced hepatic insulin resistance. Hepatology 53: 1175–1181, 2011 [DOI] [PMC free article] [PubMed] [Google Scholar]
- 3.Applied Research Program. Usual energy intake from total fat [Online]. Washington, DC: National Cancer Institute; http://appliedresearch.cancer.gov/diet/usualintakes/energy/t3.html [9 December 2013] [Google Scholar]
- 4. Barzilai N, Rossetti L. Role of glucokinase and glucose-6-phosphatase in the acute and chronic regulation of hepatic glucose fluxes by insulin. J Biol Chem 268: 25019–25025, 1993 [PubMed] [Google Scholar]
- 5. Basu A, Basu R, Shah P, Vella A, Johnson CM, Nair KS, Jensen MD, Schwenk WF, Rizza RA. Effects of type 2 diabetes on the ability of insulin and glucose to regulate splanchnic and muscle glucose metabolism: evidence for a defect in hepatic glucokinase activity. Diabetes 49: 272–283, 2000 [DOI] [PubMed] [Google Scholar]
- 6. Bizeau ME, Thresher JS, Pagliassotti MJ. Sucrose diets increase glucose-6-phosphatase and glucose release and decrease glucokinase in hepatocytes. J Appl Physiol 91: 2041–2046, 2001 [DOI] [PubMed] [Google Scholar]
- 7. Chu CA, Sherck SM, Igawa K, Sindelar DK, Neal DW, Emshwiller M, Cherrington AD. Effects of free fatty acids on hepatic glycogenolysis and gluconeogenesis in conscious dogs. Am J Physiol Endocrinol Metab 282: E402–E411, 2002 [DOI] [PubMed] [Google Scholar]
- 8. Clapper JR, Hendricks MD, Gu G, Wittmer C, Dolman CS, Herich J, Athanacio J, Villescaz C, Ghosh SS, Heilig JS, Lowe C, Roth JD. Diet-induced mouse model of fatty liver disease and nonalcoholic steatohepatitis reflecting clinical disease progression and methods of assessment. Am J Physiol Gastrointest Liver Physiol 305: G483–G495, 2013 [DOI] [PubMed] [Google Scholar]
- 9. Coate KC, Kraft G, Irimia JM, Smith MS, Farmer B, Neal DW, Roach PJ, Shiota M, Cherrington AD. Portal vein glucose entry triggers a coordinated cellular response that potentiates hepatic glucose uptake and storage in normal but not high-fat/high-fructose-fed dogs. Diabetes 62: 392–400, 2013 [DOI] [PMC free article] [PubMed] [Google Scholar]
- 10. Coate KC, Scott M, Farmer B, Moore MC, Smith M, Roop J, Neal DW, Williams P, Cherrington AD. Chronic consumption of a high-fat/high-fructose diet renders the liver incapable of net hepatic glucose uptake. Am J Physiol Endocrinol Metab 299: E887–E898, 2010 [DOI] [PMC free article] [PubMed] [Google Scholar]
- 11. Collier GR, Chisholm K, Sykes S, Dryden PA, O'Dea K. More severe impairment of oral than intravenous glucose tolerance in rats after eating a high fat diet. J Nutr 115: 1471–1476, 1985 [DOI] [PubMed] [Google Scholar]
- 12. Commerford SR, Ferniza JB, Bizeau ME, Thresher JS, Willis WT, Pagliassotti MJ. Diets enriched in sucrose or fat increase gluconeogenesis and G-6-Pase but not basal glucose production in rats. Am J Physiol Endocrinol Metab 283: E545–E555, 2002 [DOI] [PubMed] [Google Scholar]
- 13. Edgerton DS, Ramnanan CJ, Grueter CA, Johnson KM, Lautz M, Neal DW, Williams PE, Cherrington AD. Effects of insulin on the metabolic control of hepatic gluconeogenesis in vivo. Diabetes 58: 2766–2775, 2009 [DOI] [PMC free article] [PubMed] [Google Scholar]
- 14. Farrelly D, Brown KS, Tieman A, Ren J, Lira SA, Hagan D, Gregg R, Mookhtiar KA, Hariharan N. Mice mutant for glucokinase regulatory protein exhibit decreased liver glucokinase: a sequestration mechanism in metabolic regulation. Proc Natl Acad Sci USA 96: 14511–14516, 1999 [DOI] [PMC free article] [PubMed] [Google Scholar]
- 15. Ferre T, Riu E, Bosch F, Valera A. Evidence from transgenic mice that glucokinase is rate limiting for glucose utilization in the liver. FASEB J 10: 1213–1218, 1996 [DOI] [PubMed] [Google Scholar]
- 16. Folch J, Lees M, Sloane Stanley GH. A simple method for the isolation and purification of total lipides from animal tissues. J Biol Chem 226: 497–509, 1957 [PubMed] [Google Scholar]
- 17. Francini F, Castro MC, Gagliardino JJ, Massa ML. Regulation of liver glucokinase activity in rats with fructose-induced insulin resistance and impaired glucose and lipid metabolism. Can J Physiol Pharmacol 87: 702–710, 2009 [DOI] [PubMed] [Google Scholar]
- 18. Francini F, Castro MC, Schinella G, Garcia ME, Maiztegui B, Raschia MA, Gagliardino JJ, Massa ML. Changes induced by a fructose-rich diet on hepatic metabolism and the antioxidant system. Life Sci 86: 965–971, 2010 [DOI] [PubMed] [Google Scholar]
- 19. Galassetti P, Shiota M, Zinker BA, Wasserman DH, Cherrington AD. A negative arterial-portal venous glucose gradient decreases skeletal muscle glucose uptake. Am J Physiol Endocrinol Metab 275: E101–E111, 1998 [DOI] [PubMed] [Google Scholar]
- 20. Gilboe DP, Larson KL, Nuttall FQ. Radioactive method for the assay of glycogen phosphorylases. Anal Biochem 47: 20–27, 1972 [DOI] [PubMed] [Google Scholar]
- 21. Gorman T, Hope DC, Brownlie R, Yu A, Gill D, Lofvenmark J, Wedin M, Mayers RM, Snaith MR, Smith DM. Effect of high-fat diet on glucose homeostasis and gene expression in glucokinase knockout mice. Diabetes Obes Metab 10: 885–897, 2008 [DOI] [PubMed] [Google Scholar]
- 22. Grimsby J, Coffey JW, Dvorozniak MT, Magram J, Li G, Matschinsky FM, Shiota C, Kaur S, Magnuson MA, Grippo JF. Characterization of glucokinase regulatory protein-deficient mice. J Biol Chem 275: 7826–7831, 2000 [DOI] [PubMed] [Google Scholar]
- 23. Guinovart JJ, Salavert A, Massague J, Ciudad CJ, Salsas E, Itarte E. Glycogen synthase: a new activity ratio assay expressing a high sensitivity to the phosphorylation state. FEBS Lett 106: 284–288, 1979 [DOI] [PubMed] [Google Scholar]
- 24. Iynedjian PB, Pilot PR, Nouspikel T, Milburn JL, Quaade C, Hughes S, Ucla C, Newgard CB. Differential expression and regulation of the glucokinase gene in liver and islets of Langerhans. Proc Natl Acad Sci USA 86: 7838–7842, 1989 [DOI] [PMC free article] [PubMed] [Google Scholar]
- 25. Jiang M, Zhang Y, Liu M, Lan MS, Fei J, Fan W, Gao X, Lu D. Hypermethylation of hepatic glucokinase and L-type pyruvate kinase promoters in high-fat diet-induced obese rats. Endocrinology 152: 1284–1289, 2011 [DOI] [PubMed] [Google Scholar]
- 26. Keppler D, Decker K. Glycogen: determination with amyloglycosidase. In: Methods of Enzymatic Analysis, edited by Bergmeyer HU. New York: Verlag Chemie Weinheim, Academic, 1974, p. 1127–1131 [Google Scholar]
- 27. Kim SP, Ellmerer M, Van Citters GW, Bergman RN. Primacy of hepatic insulin resistance in the development of the metabolic syndrome induced by an isocaloric moderate-fat diet in the dog. Diabetes 52: 2453–2460, 2003 [DOI] [PubMed] [Google Scholar]
- 28. Kraegen EW, Clark PW, Jenkins AB, Daley EA, Chisholm DJ, Storlien LH. Development of muscle insulin resistance after liver insulin resistance in high-fat-fed rats. Diabetes 40: 1397–1403, 1991 [DOI] [PubMed] [Google Scholar]
- 29. Kraegen EW, James DE, Storlien LH, Burleigh KM, Chisholm DJ. In vivo insulin resistance in individual peripheral tissues of the high fat fed rat: assessment by euglycaemic clamp plus deoxyglucose administration. Diabetologia 29: 192–198, 1986 [DOI] [PubMed] [Google Scholar]
- 30. Krssak M, Brehm A, Bernroider E, Anderwald C, Nowotny P, Dalla Man C, Cobelli C, Cline GW, Shulman GI, Waldhausl W, Roden M. Alterations in postprandial hepatic glycogen metabolism in type 2 diabetes. Diabetes 53: 3048–3056, 2004 [DOI] [PubMed] [Google Scholar]
- 31. Magnuson MA. Tissue-specific regulation of glucokinase gene expression. J Cell Biochem 48: 115–121, 1992 [DOI] [PubMed] [Google Scholar]
- 32. Mastrocola R, Collino M, Rogazzo M, Medana C, Nigro D, Boccuzzi G, Aragno M. Advanced glycation end products promote hepatosteatosis by interfering with SCAP-SREBP pathway in fructose-drinking mice. Am J Physiol Gastrointest Liver Physiol 305: G398–G407, 2013 [DOI] [PubMed] [Google Scholar]
- 33. Michal G. d-Glucose 6-phosphate and d-fructose 6-phosphate. In: Methods of Enzymatic Analysis (3rd ed.), edited by Bergmeyer HU. Berlin: Verlay Chemie, Weinheim, 1984, p. 191–198 [Google Scholar]
- 34. Moore MC, Coate KC, Winnick JJ, An Z, Cherrington AD. Regulation of hepatic glucose uptake and storage in vivo. Adv Nutr 3: 286–294, 2012 [DOI] [PMC free article] [PubMed] [Google Scholar]
- 35. Moore MC, Pagliassotti MJ, Wasserman DH, Goldstein R, Asher J, Neal DW, Cherrington AD. Hepatic denervation alters the transition from the fed to the food-deprived state in conscious dogs. J Nutr 123: 1739–1746, 1993 [DOI] [PubMed] [Google Scholar]
- 36. Moore MC, Rossetti L, Pagliassotti MJ, Monahan M, Venable C, Neal D, Cherrington AD. Neural and pancreatic influences on net hepatic glucose uptake and glycogen synthesis. Am J Physiol Endocrinol Metab 271: E215–E222, 1996 [DOI] [PubMed] [Google Scholar]
- 37. Morrison WR, Smith LM. Preparation of fatty acid methyl esters and dimethylacetals from lipids with boron fluoride-methanol. J Lipid Res 5: 600–608, 1964 [PubMed] [Google Scholar]
- 38. Oakes ND, Cooney GJ, Camilleri S, Chisholm DJ, Kraegen EW. Mechanisms of liver and muscle insulin resistance induced by chronic high-fat feeding. Diabetes 46: 1768–1774, 1997 [DOI] [PubMed] [Google Scholar]
- 39. Pagliassotti MJ, Prach PA. Quantity of sucrose alters the tissue pattern and time course of insulin resistance in young rats. Am J Physiol Regul Integr Comp Physiol 269: R641–R646, 1995 [DOI] [PubMed] [Google Scholar]
- 40. Pagliassotti MJ, Shahrokhi KA, Moscarello M. Involvement of liver and skeletal muscle in sucrose-induced insulin resistance: dose-response studies. Am J Physiol Regul Integr Comp Physiol 266: R1637–R1644, 1994 [DOI] [PubMed] [Google Scholar]
- 41. Ramnanan CJ, Edgerton DS, Rivera N, Irimia-Dominguez J, Farmer B, Neal DW, Lautz M, Donahue EP, Meyer CM, Roach PJ, Cherrington AD. Molecular characterization of insulin-mediated suppression of hepatic glucose production in vivo. Diabetes 59: 1302–1311, 2010 [DOI] [PMC free article] [PubMed] [Google Scholar]
- 42. Ren LP, Chan SM, Zeng XY, Laybutt DR, Iseli TJ, Sun RQ, Kraegen EW, Cooney GJ, Turner N, Ye JM. Differing endoplasmic reticulum stress response to excess lipogenesis versus lipid oversupply in relation to hepatic steatosis and insulin resistance. PLoS One 7: e30816, 2012 [DOI] [PMC free article] [PubMed] [Google Scholar]
- 43. Samuel VT, Liu ZX, Qu X, Elder BD, Bilz S, Befroy D, Romanelli AJ, Shulman GI. Mechanism of hepatic insulin resistance in non-alcoholic fatty liver disease. J Biol Chem 279: 32345–32353, 2004 [DOI] [PubMed] [Google Scholar]
- 44. Satake S, Moore MC, Igawa K, Converse M, Farmer B, Neal DW, Cherrington AD. Direct and indirect effects of insulin on glucose uptake and storage by the liver. Diabetes 51: 1663–1671, 2002 [DOI] [PubMed] [Google Scholar]
- 45. Schultz A, Neil D, Aguila MB, Mandarim-de-Lacerda CA. Hepatic adverse effects of fructose consumption independent of overweight/obesity. Int J Mol Sci 14: 21873–21886, 2013 [DOI] [PMC free article] [PubMed] [Google Scholar]
- 46. Storlien LH, Kraegen EW, Jenkins AB, Chisholm DJ. Effects of sucrose vs starch diets on in vivo insulin action, thermogenesis, and obesity in rats. Am J Clin Nutr 47: 420–427, 1988 [DOI] [PubMed] [Google Scholar]
- 47. Tappy L, Le KA. Metabolic effects of fructose and the worldwide increase in obesity. Physiol Rev 90: 23–46, 2010 [DOI] [PubMed] [Google Scholar]
- 48. van Dam RM, Rimm EB, Willett WC, Stampfer MJ, Hu FB. Dietary patterns and risk for type 2 diabetes mellitus in U.S. men. Ann Intern Med 136: 201–209, 2002 [DOI] [PubMed] [Google Scholar]
- 49. van Dam RM, Willett WC, Rimm EB, Stampfer MJ, Hu FB. Dietary fat and meat intake in relation to risk of type 2 diabetes in men. Diabetes Care 25: 417–424, 2002 [DOI] [PubMed] [Google Scholar]
- 50. Vella A, Rizza RA. Application of isotopic techniques using constant specific activity or enrichment to the study of carbohydrate metabolism. Diabetes 58: 2168–2174, 2009 [DOI] [PMC free article] [PubMed] [Google Scholar]
- 51. Vos MB, Kimmons JE, Gillespie C, Welsh J, Blanck HM. Dietary fructose consumption among US children and adults: the Third National Health and Nutrition Examination Survey. Medscape J Med 10: 160, 2008 [PMC free article] [PubMed] [Google Scholar]
- 52. Winnick JJ, An Z, Moore MC, Ramnanan CJ, Farmer B, Shiota M, Cherrington AD. A physiological increase in the hepatic glycogen level does not affect the response of net hepatic glucose uptake to insulin. Am J Physiol Endocrinol Metab 297: E358–E366, 2009 [DOI] [PMC free article] [PubMed] [Google Scholar]
- 53. Winzell MS, Coghlan M, Leighton B, Frangioudakis G, Smith DM, Storlien LH, Ahrén B. Chronic glucokinase activation reduces glycaemia and improves glucose tolerance in high-fat diet fed mice. Eur J Pharmacol 663: 80–86, 2011 [DOI] [PubMed] [Google Scholar]