Abstract
Reduced AMP kinase (AMPK) activity has been shown to play a key deleterious role in increased hepatic gluconeogenesis in diabetes, but the mechanism whereby this occurs remains unclear. In this article, we document that another AMP-dependent enzyme, AMP deaminase (AMPD) is activated in the liver of diabetic mice, which parallels with a significant reduction in AMPK activity and a significant increase in intracellular glucose accumulation in human HepG2 cells. AMPD activation is induced by a reduction in intracellular phosphate levels, which is characteristic of insulin resistance and diabetic states. Increased gluconeogenesis is mediated by reduced TORC2 phosphorylation at Ser171 by AMPK in these cells, as well as by the up-regulation of the rate-limiting enzymes PEPCK and G6Pc. The mechanism whereby AMPD controls AMPK activation depends on the production of a specific AMP downstream metabolite through AMPD, uric acid. In this regard, humans have higher uric acid levels than most mammals due to a mutation in uricase, the enzyme involved in uric acid degradation in most mammals, that developed during a period of famine in Europe 1.5 × 10⁷ yr ago. Here, working with resurrected ancestral uricases obtained from early hominids, we show that their expression on HepG2 cells is enough to blunt gluconeogenesis in parallel with an up-regulation of AMPK activity. These studies identify a key role AMPD and uric acid in mediating hepatic gluconeogenesis in the diabetic state, via a mechanism involving AMPK down-regulation and overexpression of PEPCK and G6Pc. The uricase mutation in the Miocene likely provided a survival advantage to help maintain glucose levels under conditions of near starvation, but today likely has a role in the pathogenesis of diabetes.—Cicerchi, C., Li, N., Kratzer, J., Garcia, G., Roncal-Jimenez, C. A., Tanabe, K., Hunter, B., Rivard, C. J., Sautin, Y. Y., Gaucher, E. A., Johnson, R. J., Lanaspa, M. A. Uric acid-dependent inhibition of AMP kinase induces hepatic glucose production in diabetes and starvation: Evolutionary implications of the uricase loss in hominids.
Keywords: urate, phosphate, insulin, gluconeogenesis
Diabetes is a condition that affects >2.5 ×10⁸ people in the world and is continuing to increase in epidemic proportions. While diabetes is on the rise, the prevalence of people with prediabetes or insulin resistance is ∼2-fold higher than the prevalence of people with diagnosed diabetes.
A characteristic feature of diabetes is increased hepatic glucose production associated with insulin resistance. Of interest, drugs that prevent hepatic glucose production such as metformin are associated with the activation of the energy sensor enzyme adenosine monophosphate (AMP) kinase (AMPK; refs. 1, 2). In turn, AMPK blocks hepatic gluconeogenesis, in part, by inhibiting the transcription of the rate-limiting enzymes phosphoenolpyruvate carboxykinase (PEPCK) and glucose-6-phosphatase (G6Pc) (3, 4). We have recently shown that another AMP-dependent enzyme in the liver, AMP deaminase (AMPD), is a natural counterregulator of AMPK when activated (5), and recent studies have shown that AMPK agonists may also function as AMPD inhibitors (5–7).
In this article, we have tested the hypothesis that AMPD may negatively regulate AMPK activation in the liver in diabetes. Employing both diabetic mice and human HepG2 cells, we report that the activation of AMPD isoform 2 (AMPD2) counterregulates AMPK and increases hepatic glucose production, in association with up-regulation of PEPCK and G6Pc. We also show that the mechanism whereby AMPD blocks AMPK is mediated by the downstream generation of uric acid from AMP and that lower intracellular phosphate associated with insulin resistance states is a key regulator of the AMPD-AMPK functional interaction by controlling the activation of AMPD.
MATERIALS AND METHODS
Ethics statement
All animal experiments were performed according to protocols approved by the University of Colorado Animal Care and Use Committee.
Induction of diabetes in mice and determination of serum and hepatic parameters
Male mice in the C57/BL6 background aged 8 wk with a body weight of 23–25 g were maintained in the specific pathogen-free barrier facility at the University of Colorado Denver before induction of diabetes. Diabetes was induced by intraperitoneal injections of streptozotocin (50 mg·kg−1·d−1 for 5 consecutive days) dissolved in 10 mM citrate buffer, pH 4.5 (8). After streptozotocin administration, ∼95% of mice became diabetic. Only mice that developed hyperglycemia at 4 wk were included in the study. Control mice were injected with citrate buffer only. All of the mice were euthanized 12 wk after the last injection to obtain blood/serum samples and liver tissues.
Serum glucose and blood HbA1c levels were determined with a VetAce autoanalyzer (Alfa Wassermann, West Caldwell, NJ, USA). Hepatic phosphate levels in MAPK lysates were determined by an enzymatical kit (K410-100; BioVision, Milpatas, CA, USA) as per manufacturer's instructions.
Western blot from liver and HepG2 homogenates
Livers and cultured cells were homogenized in MAPK lysis buffer, as described previously (9). Sample protein content was determined by the BCA protein assay (Pierce, Rockford, IL, USA). Total protein (20 μg/lane) was loaded SDS-PAGE (10% w/v) analysis and then transferred to PVDF membranes. Membranes were incubated with primary antibodies and visualized using a horseradish peroxidase (HRP) secondary antibody and the HRP Immunstar detection kit (Bio-Rad, Hercules, CA, USA). Chemiluminescence was recorded with an Image Station 440CF, and results were analyzed with the 1D Image software (Kodak Digital Science, Rochester, NY). Primary antibodies used include AMPK (2603), Thr172-phosphorylated AMPK (2535), and actin (4967) were purchased from Cell Signaling (Danvers, MA, USA). Antibodies to PEPCK (PCK1; H00005105-M01) and AMPD2 (H00000271-M04A) were purchased from Abnova (Walnut, CA, USA). Transducer of regulated CREB activity 2 (TORC2; NB100-79816) and G6Pc (NBP1-80533) from Novus (Littleton, CO, USA), the uricase (sc33830) antibody was obtained from Santa Cruz Biotechnologies (Santa Cruz, CA, USA), and phosphorylated TORC2 (bs-3415R) was purchased from Bioss (Woburn, MA, USA).
Determination of AMPD activity in cultured cells and liver homogenates
AMPD activity was determined by estimating the production of ammonia by a modification of the method described by Chaney and Marbach (10) from cells and livers collected in a buffer containing 150 mM KCl, 20 mM Tris-HCl, 1 mM EDTA, and 1 mM dithiothreitol. Briefly, the reaction mixture consisted of 25 mM sodium citrate (pH 6.0), 50 mM potassium chloride, and different concentration of AMP. The enzyme reaction was initiated by the addition of the enzyme solution and incubated at 37°C for 15 min. For determination of AMPD regulation by phosphate in cells, phosphate (0–5 mM) was added to the lysates 30 min before the assay for preincubation. The reaction was stopped with the addition of the phenol/hypochlorite reagents: Reagent A (100 mM phenol and 0.050 mg/ml sodium nitroprusside in H2O) was added, followed by reagent B (125 mM sodium hydroxide, 200 mM dibasicsodium phosphate, and 0.1% sodium hypochlorite in H2O) and incubated for 30 min at 25°C. The absorbance of the samples was measured at 625 nm with a spectrophotometer. To determine the absolute specific activity of ammonia production (micromoles ammonia/min), a calibration curve was determined in the range of 5 μM to 1 mM of ammonia.
Cultured cells and overexpression of AMPD2 and ancestral uricases
Stable overexpression of AMPD2 in HepG2 cells was performed employing lentiviral particle codifying for human AMPD2, as described previously (5). Similarly, resurrected ancestral uricases (11) were subcloned into the EcoRI and NotI of the multicloning site of the pLVX-IRES-Puro vector for generation of lentiviral particles ready for transduction in HepG2 cells.
Determination of glucose production in HepG2 cells
HepG2 cells were grown to 80% confluency overnight, and intracellular glucose levels were determined at baseline, 1 or 3 h in the presence of lactate, pyruvate (20:10 mM ratio), and N-6,2′-O-dibutyryladenosine 3′,5′-cyclic monophosphate sodium salt (Bt2-cAMP; 100 μM; cat. no. D0627; Sigma, St. Louis, MO, USA) employing a glucose oxidase-peroxidase-based system (10009582; Cayman Chemicals, Ann Arbor, MI, USA) from fresh lysates obtained with MAPK lysis buffer. In experiments involving inosine, phosphate, or uric acid, cells were preincubated overnight with these compounds prior to exposing the cells to serum-free medium.
Confocal microscopy and determination of TORC2 location in HepG2 cells
HepG2 cells were grown in coverslips to 60% confluency and fixed with 4% paraformaldehyde and permeabilized with 0.1% Triton-X in PBS before overnight incubation with TORC2 antibody (1:50 dilution in PBS-Triton-X with 3% milk). The next day, the cells were washed 3 times with PBS-Triton-X and incubated for 1 h with an Alexa Fluor-488 anti-rabbit antibody. After incubation, cells were washed, mounted with medium containing DAPI for nuclear staining, and imaged with a confocal microscope for colocalization studies. Imaging and analysis were performed with a laser-scanning confocal microscope (LSM510; Carl Zeiss, Thornwood, NY, USA) with a ×63 oil-immersion objective and the corresponding postacquisition software. Imaging experiments were performed in the University of Colorado Anschutz Medical Campus Advance Light Microscopy Core.
RESULTS
Increased hepatic AMPD activity in livers of diabetic mice is associated with lower AMPK activation and higher PEPCK and G6Pc levels
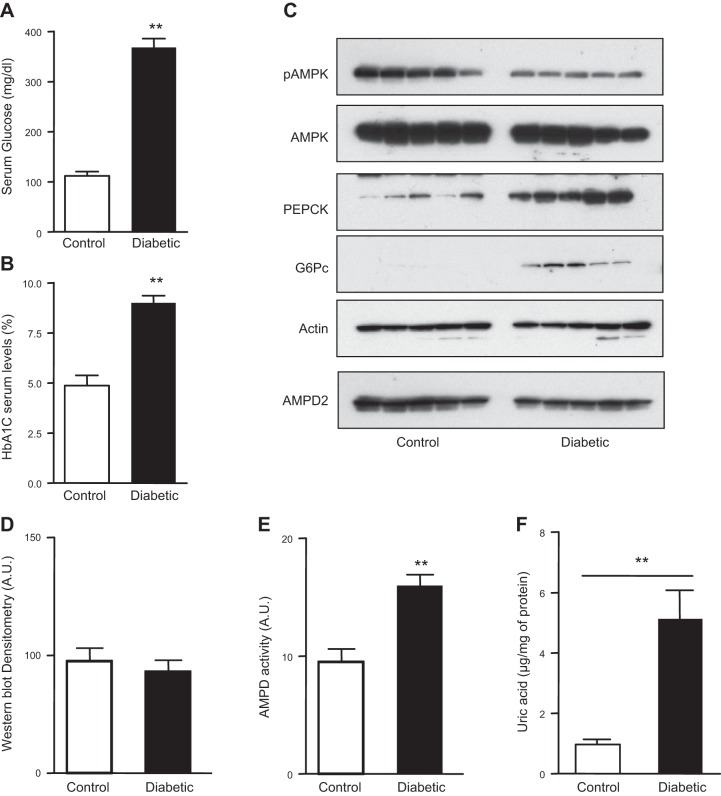
We, and others, have recently reported that AMPD activation leads to the inhibition of AMPK activity in various cell lines (5, 6, 12). Since a decrease in hepatic AMPK activity is a characteristic finding in diabetes (13), we hypothesized that AMPD may be acting as a natural counterregulator of AMPK in the livers of diabetic mice. Diabetes was induced in mice with the standard U.S. National Instutes of Health protocol of streptozocin (14) and hyperglycemia confirmed by measuring fasting serum glucose and HbA1C levels (Fig. 1A, B). At 12 wk after injection of streptozocin, mice were euthanized, and livers were collected for evaluation of AMPK and AMPD activity. As shown in Fig. 1C, D, the active form of AMPK, as determined by Western blot of phosphorylated AMPK (pAMPK) at the Thr172 position (15, 16), was decreased in livers of diabetic mice compared to nondiabetic mice. This decrease of pAMPK levels in diabetic mice was associated with higher expression of PEPCK and G6Pc, rate-limiting proteins in gluconeogenesis (3, 4). No difference in AMPD2 expression, the main isoform of AMPD in hepatocytes (5), was observed between diabetic and nondiabetic mice. However, AMPD activity, determined by measuring the formation of ammonia from AMP, was significantly higher in the livers of diabetic mice (Fig. 1E), documenting that the loss of pAMPK in these mice is associated with increased activity of AMPD. Consistent with this finding, intrahepatic uric acid levels, a downstream product of AMP metabolism through AMPD2 are significantly higher in diabetic mice compared to control animals (Fig. 1F).
Figure 1.
Decreased AMPK phosphorylation and increased AMPD activity in the livers of diabetic mice. A) Serum glucose levels in nondiabetic and diabetic mice. B) Blood HbA1c levels in nondiabetic and diabetic mice. C) Representative Western blot demonstrating reduced AMPK phosphorylation (at Thr172) in the livers of diabetic mice compared to nondiabetics (n=5 mice/group) with no difference in the expression of both total AMPK and total AMPD2. Reduced AMPK phosphorylation is associated with higher PEPCK and G6Pc expression. D) AMPD2 Western blot densitometry, demonstrating no significant change in expression. E) AMPD activity is higher in livers from diabetic mice compared to nondiabetics. F) Intrahepatic uric acid levels in control (nondiabetic) and diabetic mice. **P < 0.01 vs. control nondiabetic mice.
Overexpression of AMPD2 in HepG2 cells leads to up-regulation of PEPCK and G6Pc levels and increased glucose production.
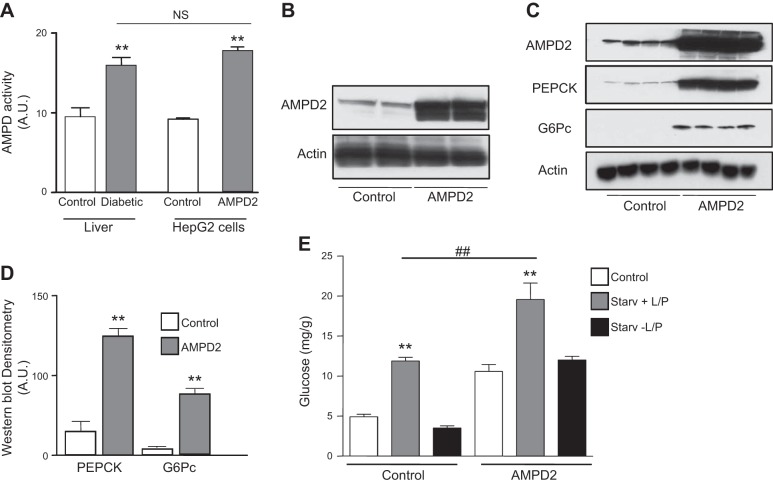
To better understand whether the association of AMPD activity with hepatic gluconeogenesis was causative, we stably overexpressed AMPD2 in human HepG2 cells to obtain values of activity similar to those observed in the livers of diabetic mice (Fig. 2A, B). Interestingly and as shown in Fig. 2C, D, overexpression of AMPD2 resulted in a significant up-regulation of PEPCK and G6Pc. Hepatic glucose production in AMPD2-overexpressing cells was also determined at 3 h after serum-free conditions in medium supplemented with the gluconeogenic substrates, lactate, pyruvate, and the gluconeogenesis stimulant Bt2-cAMP. This treatment resulted in higher intracellular glucose levels in AMPD2-overexpressing cells compared to control HepG2 cells (Fig. 2E). The increase in intracellular glucose levels seems to be derived from increased glucose production rather than decreased utilization since removal of gluconeogenic substrate lactate and pyruvate resulted in no glucose accumulation under the same conditions (Fig. 2E). Of interest, basal glucose levels in AMPD2-overexpressing cells tended to be higher than control cells, perhaps as a result of increased basal expression of PEPCK and G6Pc. Furthermore, inhibition of AMPD2 with pentostatin (10 μM), an inhibitor of AMPD activity (17) (Fig. 3A), resulted in blockade of glucose levels (Fig. 3B).
Figure 2.
Generation of high AMPD activity in human HepG2 cells demonstrate increased expression of gluconeogenic enzymes and glucose production. A) Total AMPD activity in livers of mice (left side of histogram; white bar denotes nondiabetic control; gray bar denotes diabetic cells) and HepG2 cells (right side of histogram; white bar denotes control cells, while gray bar denotes AMPD2-overexpressing cells); n = 4 clones/group. **P < 0.05 vs. respective control. B) Representative Western blot for AMPD2 and actin loading control in control HepG2 cells and cells stably overexpressing AMPD2. C) Representative Western blot for AMPD2, PEPCK, G6Pc, and actin loading control in control HepG2 cells (n=4) and cells stably overexpressing AMPD2 (n=4). D) Western blot densitometry for PEPCK and G6Pc in control HepG2 cells (n=4) and cells stably overexpressing AMPD2 (n=4). **P < 0.01 vs. control. E) Glucose production in HepG2 cells control (left) and stably overexpressing AMPD2 (right) in control conditions (white bars), in serum-free medium supplemented with lactate, pyruvate, and Bt2-cAMP (gray bars) and serum-free medium without lactate, pyruvate, and Bt2-cAMP (black bars). **P < 0.01 vs. control and no L/P; ##P < 0.01.
Figure 3.
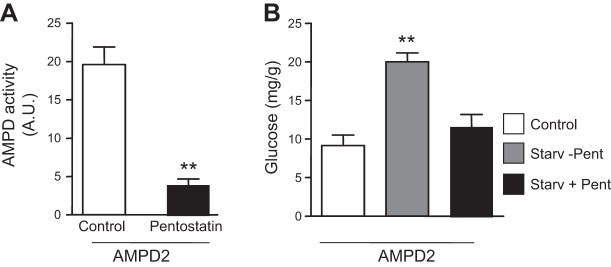
Inhibition of AMPD activity results in blockade of gluconeogenesis. A) Total AMPD activity in HepG2 cells stably overexpressing AMPD2 control (white bar) or in the presence of the AMPD inhibitor pentostatin (100 μM, black bar). **P < 0.01 vs. control. B) Glucose production in HepG2 cells stably overexpressing AMPD2 (right) in control conditions (white bar), in serum-free medium supplemented with lactate, pyruvate, and Bt2-cAMP alone (gray bar), or in the presence of pentostatin (100 μM, black bar). **P < 0.01 vs. control and serum-free medium plus pentostatin.
AMPD2-dependent increase in glucose levels is mediated by the blockade of AMPK activation
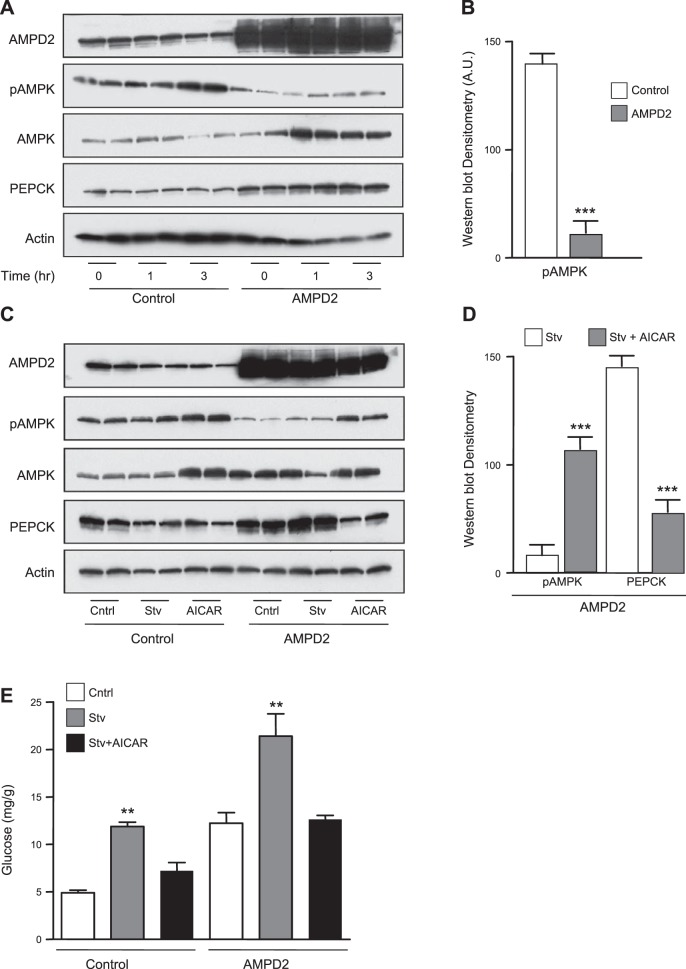
We next analyzed AMPK activity in control and AMPD2-overexpressing cells exposed to serum-free medium for up to 3 h. As shown in Fig. 4A, exposure of cells to serum-free medium and lactate, pyruvate, and Bt2-cAMP increased pAMPK levels in a time-dependent manner in control cells. In contrast, no significant up-regulation of pAMPK was observed in cells stably overexpressing AMPD2, although we observed a significant rise in total AMPK levels, perhaps as a compensatory mechanism secondary to the lack of AMPK activation. By comparison, there were 6.5-fold decreased pAMPK levels in AMPD2-overexpressing cells compared to control cells at 3-h postexposure of cells to serum-free medium (Fig. 4B). Of interest, AMPD2-overexpressing cells were associated with increased total AMPK expression perhaps as a compensatory mechanism. PEPCK expression also remained elevated in AMPD-overexpressing cells in serum-free medium (Fig. 4A). We next evaluated the role of AMPK on AMPD2 in hepatic glucose production by exposing the cells (3 h) to serum-free medium in the presence of lactate, pyruvate, and Bt2-cAMP, with or without the AMPK agonist AICAR (1 μM). As shown in Fig. 4C, AICAR up-regulated pAMPK expression in control cells. This up-regulation was also observed in AMPD2-overexpressing cells (4.3-fold increase compared to nonexposed cells). Of interest, both glucose levels and PEPCK expression were significantly decreased by AICAR in AMPD2-overexpressing cells (Fig. 4D, E), indicating that AMPK blockade may be important in AMPD2-mediated expression of PEPCK and gluconeogenesis.
Figure 4.
AMPD2 controls AMPK phosphorylation in HepG2 cells acutely exposed to serum-free medium. A) Representative Western blot for AMPD2, AMPK, pAMPK, PEPCK, and actin loading control in control HepG2 cells in serum-free medium for different time points (0, 1, and 3 h; n=2/time point) and cells stably overexpressing AMPD2 under the same conditions (n=2 for each time point). B) Western blot densitometry for pAMPK in control HepG2 cells under serum-free medium conditions 3 h and cells stably overexpressing AMPD2 under the same conditions (n=4). ***P < 0.001 vs. control. C) Representative Western blot for AMPD2, AMPK, pAMPK, PEPCK, and actin loading control in control HepG2 cells under serum-free conditions for 3 h in the presence or absence of the AMPK agonist AICAR (1 μM) and cells stably overexpressing AMPD2 under the same conditions (n=2/condition). D) Western blot densitometry for pAMPK and PEPCK in HepG2 cells stably overexpressing AMPD2 under serum-free conditions for 3 h in the presence or absence of the AMPK agonist AICAR (1 μM, n=4/condition). ***P < 0.001 vs. control. E) Glucose production in HepG2 cells control (left) and stably overexpressing AMPD2 (right) in control conditions (white bars), in serum-free conditions supplemented with lactate, pyruvate, and Bt2-cAMP (gray bars) alone or in the presence of AICAR (1 μM). **P < 0.01 vs. respective control and serum-free plus lactate and pyruvate.
AMPD2-induced generation of inosine and uric acid contributes to increased glucose production in HepG2 cells
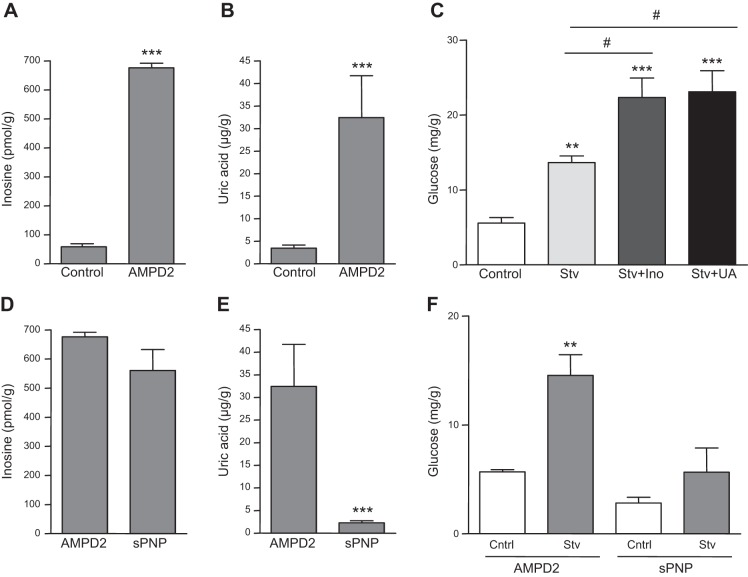
Activated AMPD2 converts AMP to IMP, followed by entering into the purine degradation pathway in which uric acid is the final product (5). Of these products, both inosine and uric acid have been previously suggested to play a role in diabetes (18–20). Consistent with this and as shown in Fig. 5A, B, intracellular levels of inosine and uric acid are significantly increased in AMPD2-overexpressing cells compared to control cells. Furthermore, preincubation of cells with inosine or uric acid further increased hepatic glucose production in cells exposed to lactate, pyruvate and Bt2-cAMP and serum-free medium for 3 h (Fig. 5C), suggesting that these metabolites may mediate AMPD2-dependent increased gluconeogenesis. To separate whether the effect of inosine was mediated by the downstream generation of uric acid, we then stably silenced purine nucleoside phosphorylase (PNP) in HepG2 cells. This way, PNP-deficient cells possess high intracellular inosine levels (Fig. 5D) but much lower intracellular uric acid levels compared to AMPD2-overexpressing cells (Fig. 5E). As shown in Fig. 5F, hepatic glucose production in PNP-deficient cells was decreased compared to AMPD2-overexpressing cells, indicating that uric acid but not inosine mediates AMPD2-dependent increased gluconeogenesis.
Figure 5.
Effects of inosine in hepatic glucose production are mediated by the generation of uric acid. A) Intracellular inosine levels in HepG2 cells control (left) and stably overexpressing AMPD2 (right). ***P < 0.001 vs. control. B) Intracellular uric acid levels in HepG2 control cells (left) and cells stably overexpressing AMPD2 (right). ***P < 0.001 vs. control. C) Glucose production in HepG2 cells under control conditions (white bar), serum-free conditions supplemented with lactate, pyruvate and Bt2-cAMP (light gray bar), and the same serum-free conditions plus inosine (dark gray bar) or uric acid (black bar) **P < 0.01, ***P < 0.001 vs. control; #P < 0.05. D) Intracellular inosine levels in HepG2 stably overexpressing AMPD2 (left) or stably silenced for purine nucleoside phosphorylase (PNP, right). E) Intracellular uric acid levels in HepG2 stably overexpressing AMPD2 (left) or stably silenced for purine nucleoside phosphorylase (PNP, right). ***P < 0.001 vs. control AMPD2-overexpressing cells. F) Glucose production in HepG2 cells stably overexpressing AMPD2 (left) or silenced for PNP (right) under control conditions (white bars) and serum-free conditions supplemented with lactate, pyruvate, and Bt2-cAMP (gray bars). **P < 0.01 vs. control.
Resurrection of ancestral uricases from hominids restores uric acid-induced blockade of AMPK and hepatic glucose production
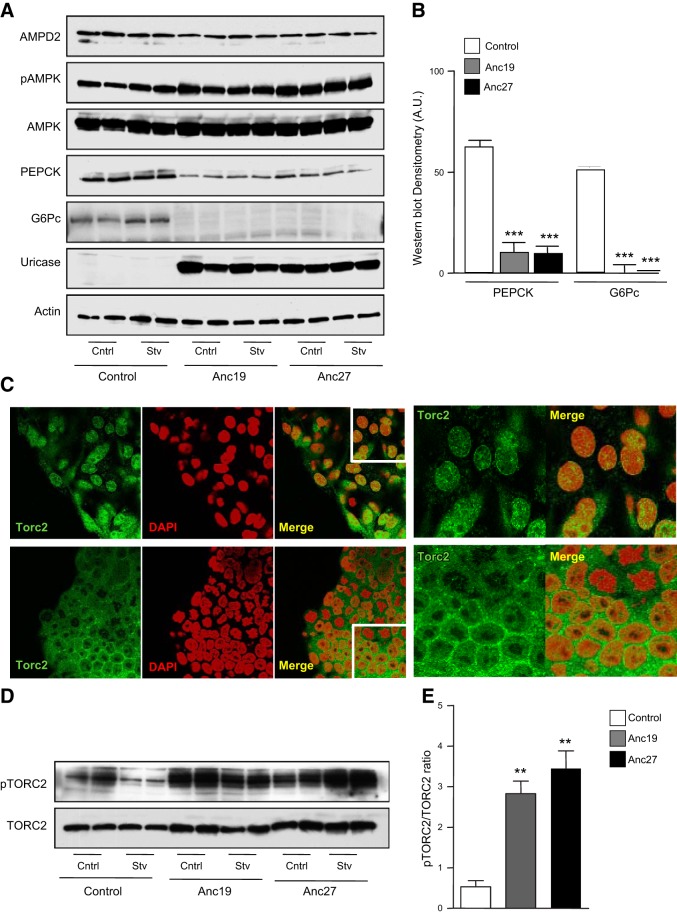
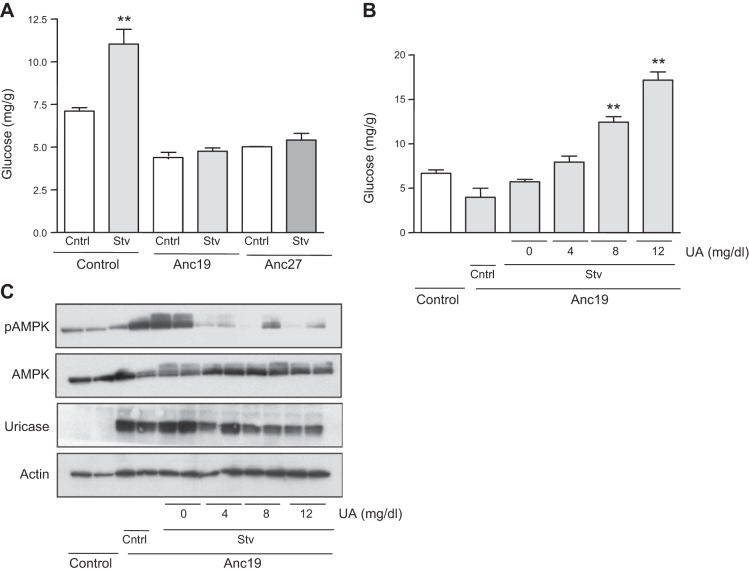
We have previously reported that under starving–serum-free conditions, uric acid plays a key role in inhibiting AMPK activity in HepG2 cells (5). Unlike most mammals, in humans, uric acid levels are high due to a missense mutation in the uricase gene that occurred ∼1.5 × 10⁷ yr ago (21, 22). To better understand the role of uric acid in AMPK activity and glucose production, we expressed resurrected uricases from ancestral hominids (Anc19 and Anc27) in HepG2 cells and confirmed that these cells did not accumulate uric acid after stimulating AMPD2 activity (0.4±0.1 μg/g of protein in control cells vs. 0.1±0.1 μg/g of protein in Anc19-expressing cells; P<0.05) (11). As shown in Fig. 6A, expression of Anc19 and Anc27 resulted in the up-regulation of pAMPK and a concomitant decrease in PEPCK and G6Pc levels. These changes were maintained in serum-free medium (Fig. 6B). One potential mechanism whereby pAMPK blocks PEPCK and G6Pc expression is by the phosphorylation of the transcription factor TORC2 (CRTC2, CREB-regulated transcription coactivator 2), which results in blocking its transport into the nucleus (23, 24). As shown in Fig. 6C (top panels), we found TORC2 is present in the nucleus of cells exposed to lactate, pyruvate, and Bt2-cAMP in serum-free medium for 3 h, where it colocalizes with the nuclear marker DAPI. In contrast, TORC2 was retained in cells expressing the ancestral uricase, Anc19 in perinuclear locations (Fig. 6C, bottom panels). These data suggest that uric acid may mediate the cellular location of TORC2 by controlling AMPK activity. Similar results were observed in Anc27-expressing cells. Consistent with the decreased nuclear expression of TORC2, we found that the levels of TORC2 phosphorylated at Ser171 normalized to total TORC2 levels were higher in Anc19- and Anc27-expressing cells compared to control cells both under control and serum-free conditions (Fig. 6D, E). Likely as a result of lower PEPCK and G6Pc levels, we found that glucose production in Anc19- and Anc27-expressing cells were significantly reduced compared to control cells (Fig. 7A). Of interest, and as shown in Fig. 7B, readdition of uric acid resulted in the activation of gluconeogenesis in a dose-dependent manner, suggesting that the mechanism whereby uricase blocked glucose production is mediated by uric acid degradation. Consistent with this, readdition of uric acid reduced AMPK activation, which was induced by the introduction of Anc19 in HepG2 cells (Fig. 7C).
Figure 6.
Expression of resurrected ancestral uricases from early hominids in HepG2 cells stimulate AMPK phosphorylation and block TORC2 nuclear translocation. A) Representative Western blot for AMPD2, AMPK, pAMPK, PEPCK, G6Pc, uricase, and actin loading control in HepG2 control cells or cells stably expressing ancestral uricase 19 (Anc19) or uricase 27 (Anc27) under normal conditions or serum-free conditions for 3 h in the presence of lactate, pyruvate, and Bt2-cAMP. B) Western blot densitometry for PEPCK (left) and G6Pc (right) under serum-free conditions in control cells (white bars) and cells expressing Anc19 (gray bars) or Anc27 (black bars) (n=4). ***P < 0.001 vs. control. C) Representative confocal image of TORC2 (green) location in HepG2 cells control (top row) or expressing Anc19 (bottom row) under serum-free condition supplemented with lactate, pyruvate, and Bt2-cAMP. The nuclear marker DAPI is shown in red; merged pseudocolor of TORC2 and DAPI is shown in yellow. View: ×63 in left 3 panels; ×100 magnification in right 2 panels. D) Representative Western blot for TORC2 and pTORC2 in HepG2 cells control or stably expressing ancestral uricase 19 (Anc19) or uricase 27 (Anc27) under normal conditions or serum-free conditions for 3 h in the presence of lactate, pyruvate, and Bt2-cAMP. E) Western blot densitometry for pTORC2 (normalized to total TORC2) under serum-free conditions in control cells (white bar) and cells expressing Anc19 (gray bar) or Anc27 (black bar) (n=4). ***P < 0.001 vs. control.
Figure 7.
Expression of resurrected ancestral uricases from early hominids in HepG2 cells page glucose production by reducing intracellular uric acid levels. Glucose production in HepG2 cells control (left), stably overexpressing Anc19 (middle), or Anc27 (right) in control conditions (white bars) or serum-free conditions supplemented with lactate, pyruvate, and Bt2-cAMP (gray bars). **P < 0.01 vs. respective control. B) Glucose production in control cells (left) and stably overexpressing Anc19 (right) in control conditions or serum-free condition supplemented with lactate, pyruvate and Bt2-cAMP and increasing concentrations of uric acid (from 0 to 12 mg/dl). **P < 0.01 vs. respective control. C) Representative Western blot for pAMPK, AMPK, actin, and uricase in the same conditions as in B.
Intracellular phosphate regulates AMPD activity and glucose production in HepG2 cells
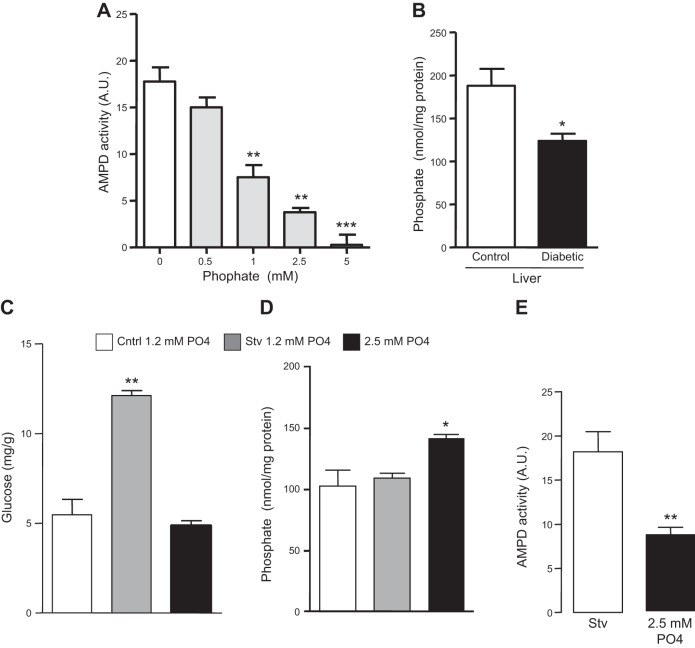
The data presented here indicate that the activation of AMPD in the liver in diabetic states is important for increased gluconeogenesis. However, the mechanisms resulting in increased AMPD activity in diabetes remains unclear. It has been previously reported that phosphate is a natural inhibitor of AMPD activity, and also, serum phosphate levels and transport are tightly regulated by insulin (25–27). We have further confirmed the inhibition of AMPD2 by phosphate in a dose-dependent manner by employing cell lysates incubated at different phosphate concentrations, from 0 to 5 mM (Fig. 8A). Of interest, and consistent with increased AMPD activity, we found significantly decreased levels of phosphate in livers of diabetic mice compared to nondiabetic (Fig. 8B). To better characterize the role that phosphate may have in AMPD activity, we exposed cultured cells to normal (1.2 mM) and high-phosphate (2.5 mM) conditions for 3 d before analyzing glucose production after 3 h postaddition of serum-free medium in the presence of lactate, pyruvate, and Bt2-cAMP. As shown in Fig. 8C, exposure of cells to high phosphate levels resulted in lower hepatic glucose production compared to cells exposed to normal phosphate levels. This was associated with higher intracellular phosphate levels and overall lower AMPD activity in cells exposed to 2.5 mM phosphate (Fig. 8D, E).
Figure 8.
Intracellular phosphate regulates AMPD activity and glucose production in HepG2 cells. A) AMPD activity in cell lysates incubated with increasing levels of phosphate. **P < 0.01 and ***P < 0.001 vs. addition of 0 mM phosphate. B) Intrahepatic phosphate levels in nondiabetic and diabetic mice (n=5). *P < 0.05 vs. nondiabetic control mice. C) Glucose production in HepG2 cells under normal (control) conditions (white bar), serum-free conditions supplemented with lactate, pyruvate, and Bt2-cAMP with 1 mM phosphate (gray bar), or 2.5 mM phosphate (black bar). **P < 0.01 vs. control and serum-free plus 2.5 mM phosphate. D) Percentage of change in intracellular phosphate levels in HepG2 cells under serum-free conditions supplemented with lactate, pyruvate, and Bt2-cAMP with 1 mM phosphate (white bar) or 2.5 mM phosphate (black bar) compared to control conditions. *P < 0.05 vs. control and starvation. E) AMPD activity in cells exposed to 1 and 2.5 mM phosphate for 3 d. **P < 0.001 vs. serum-free condition.
DISCUSSION
Lowering hepatic glucose production is a primary therapeutic strategy to control diabetes (13, 28, 29). Increased hepatic glucose production in diabetic states may occur as a consequence of insulin deficiency or insulin resistance that impairs glucose uptake in multiple organs. Most of the strategies employed to reduce hepatic glucose production in diabetes are associated with stimulation of the energy sensor enzyme AMPK, which is normally activated by an elevated AMP to ATP ratio to block cellular anabolism (i.e., gluconeogenesis, lipogenesis, glycogen synthesis; refs. 13, 24). Here, we show that another AMP-stimulated enzyme, AMPD2, is a natural counterregulator of AMPK and that its activation in the liver of diabetic mice is associated with reduced AMPK activity.
To understand the importance of activated AMPD in diabetes, we stably overexpressed AMPD2 in human HepG2 cells and achieved AMPD activity levels similar to those found in mice that were diabetic for 12 wk. The up-regulation of AMPD2 was associated with decreased AMPK activation and increased glucose production and with an up-regulation in the expression of the gluconeogenic rate-limiting enzymes PEPCK and G6Pc. These data suggest AMPD2 may be a potential target in the treatment of diabetes.
While the regulation of AMPK by AMPD2 may be mediated, in part, by the direct reduction of AMP levels as a consequence of the metabolism of AMP to IMP, we also found that uric acid, a downstream product of AMP metabolism, can inhibit AMPK activity as well. This is of particular interest in humans, as they have higher uric acid levels than other mammals due to the mutation of the uricase gene that occurred in the mid-Miocene. Indeed, our group has postulated that the loss of uricase may have provided a survival advantage to early hominoids due to the ability of uric acid to stimulate fat accumulation and raise blood pressure (30–32). The period during which the mutation occurred was associated with remarkable famine and starvation for the hominoid apes living in Europe that are thought to be our ancestors (30, 31). Consistent with this hypothesis, we found that expression of different uricases resurrected from early hominoids could prevent the increased intracellular glucose levels associated with increased AMPD2 expression. On the basis of these findings, we propose that the loss of uricase may have raised hepatic uric acid levels, thereby stimulating hepatic glucose production and serum glucose levels that would provide fuel for the brain and other organs during the prolonged starvation that occurred during this time. Thus, the loss of uricase may have functioned as a “thrifty gene” as proposed by James Neel in 1962 (33) that would have improved survival during food scarcity but in modern societies might predispose to obesity and diabetes.
The mechanism by which AMPD is activated in diabetes remains unknown. However, our data suggest it may be related to low hepatic levels of phosphate. Insulin not only stimulates glucose uptake, but also uptake of phosphate and potassium into multiple tissues (25, 26, 34). Low intracellular phosphate levels are known to activate AMPD in the liver (35). Here, we show that exposure of cells to high phosphate levels for 3 days results in the blockade of glucose production in an AMPD-dependent manner. Therefore, in diabetic states induced by insulin deficiency (type 1 diabetes) or resistance (type 2 diabetes), the lack of an insulin response may be the mechanism underlying the activation of AMPD2 in the liver. Consistent with this, we also found that intrahepatic levels of phosphate were significantly reduced in diabetic mice. It is important to note that since AMPD activity was increased in isolated activity assays, in which the influence of high uric acid and low phosphate would not be expected to be present, it suggests that the increased AMPD activity may persist despite removing these modulators. Furthermore, recently it has been shown that AMPK down-regulates phosphate transport in the kidney (36), thus suggesting a potential autoregulatory mechanism mediated by AMPD by allowing its activation after intracellular phosphate depletion.
In summary, we propose that under normal conditions (Fig. 9), insulin secretion favors both glucose and phosphate uptake in the liver. When ATP depletion occurs and the AMP/ATP ratio rises, AMPK is activated to block anabolic routes, including gluconeogenesis, in order to switch the cellular energy state into the production of ATP. This mechanism is mediated by the phosphorylation of TORC2 by pAMPK and the blockade of PEPCK and G6Pc transcription. In contrast, in insulin-deficient or insulin-resistant states, intrahepatic phosphate levels decrease, AMPD2 is activated, and uric acid is generated. Increased AMPD activity and uric acid levels block the activation of AMPK leading to the translocation of TORC2 to the nucleus and the transcription of PEPCK and G6Pc that along with increased availability of gluconeogenic substrates in diabetic states (lactate and pyruvate) stimulate de novo production of glucose.
Figure 9.
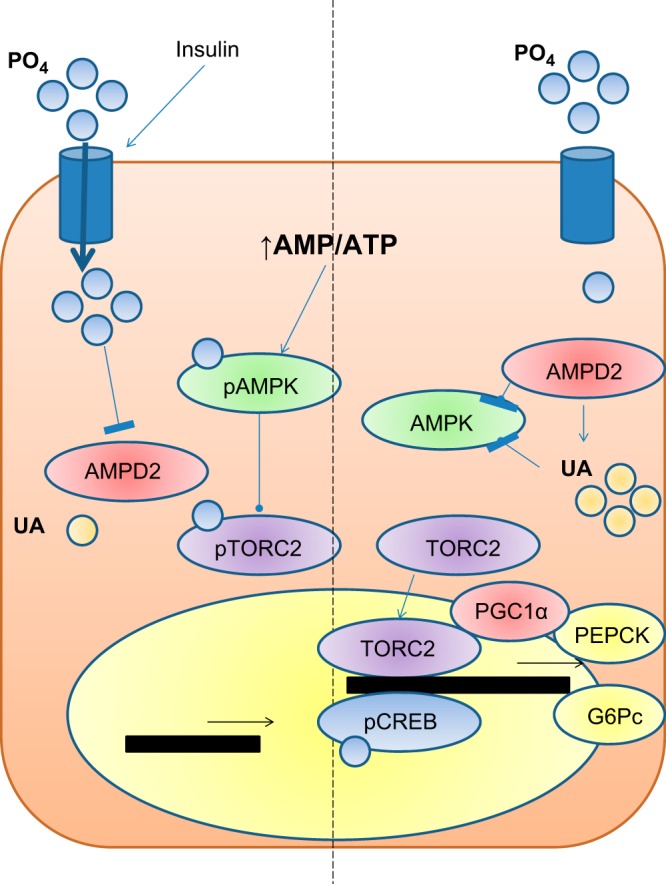
Proposed role of AMPD2 and uric acid in hepatic glucose production in diabetic states. Under normal conditions (left side of panel), insulin secretion favors both glucose and phosphate uptake by the liver. When ATP depletion occurs and the AMP/ATP ratio rises, AMPK is activated by its phosphorylation at threonine-172 to block anabolic routes, including gluconeogenesis, while AMPD activity is reduced by intracellular phosphate. The mechanism whereby AMPK blocks gluconeogensis is mediated by the phosphorylation of TORC2 and PEPCK and G6Pc-reduced transcriptional activity. In contrast, in insulin-deficient or insulin-resistant states (right side of panel), intrahepatic phosphate levels decrease, and AMPD2 is thus activated and uric acid generated. Increased AMPD activity and uric acid levels block the activation of AMPK, leading to the translocation of TORC2 to the nucleus and the transcription of PEPCK and G6Pc that along with increased availability of gluconeogenic substrates in diabetic states (lactate and pyruvate) stimulate de novo production of glucose.
Acknowledgments
This work was supported by grants HL-68607 and RC4-DK090859-01 (to R.J.J.), grant 1K01-DK095930-01 (to M.A.L.), and grant RO1-DK082509 (to G.G.) from the U.S. National Institutes of Health, and startup funds from the University of Colorado. Imaging experiments were performed at the University of Colorado Anschutz Medical Campus Advance Light Microscopy Core, supported, in part, by U.S. National Institutes of Health (NIH)/National Center for Research Resources Colorado Clinical and Translational Science Institute grant UL1 RR-025780.
Footnotes
- AMP
- adenosine monophosphate
- AMPD
- adenosine monophosphate deaminase
- AMPD2
- adenosine monophosphate deaminase isoform 2
- AMPK
- adenosine monophosphate kinase
- Bt2-cAMP
- N-6,2′-O-dibutyryladenosine 3′,5′-cyclic monophosphate sodium salt
- G6Pc
- glucose-6-phosphatase
- PEPCK
- phosphoenolpyruvate carboxykinase
- pAMPK
- phosphorylated) adenosine monophosphate kinase
- TORC2
- transducer of regulated CREB activity 2
REFERENCES
- 1. Towler M. C., Hardie D. G. (2007) AMP-activated protein kinase in metabolic control and insulin signaling. Circ. Res. 100, 328–341 [DOI] [PubMed] [Google Scholar]
- 2. Zhou G., Myers R., Li Y., Chen Y., Shen X., Fenyk-Melody J., Wu M., Ventre J., Doebber T., Fujii N., Musi N., Hirshman M. F., Goodyear L. J., Moller D. E. (2001) Role of AMP-activated protein kinase in mechanism of metformin action. J. Clin. Invest. 108, 1167–1174 [DOI] [PMC free article] [PubMed] [Google Scholar]
- 3. Rajas F., Croset M., Zitoun C., Montano S., Mithieux G. (2000) Induction of PEPCK gene expression in insulinopenia in rat small intestine. Diabetes 49, 1165–1168 [DOI] [PubMed] [Google Scholar]
- 4. Yoshiuchi I., Shingu R., Nakajima H., Hamaguchi T., Horikawa Y., Yamasaki T., Oue T., Ono A., Miyagawa J. I., Namba M., Hanafusa T., Matsuzawa Y. (1998) Mutation/polymorphism scanning of glucose-6-phosphatase gene promoter in noninsulin-dependent diabetes mellitus patients. J. Clin. Endocrinol. Metab. 83, 1016–1019 [DOI] [PubMed] [Google Scholar]
- 5. Lanaspa M. A., Cicerchi C., Garcia G., Li N., Roncal-Jimenez C. A., Rivard C. J., Hunter B., Andres-Hernando A., Ishimoto T., Sanchez-Lozada L. G., Thomas J., Hodges R. S., Mant C. T., Johnson R. J. (2012) Counteracting roles of AMP deaminase and AMP kinase in the development of fatty liver. PLoS One 7, e48801. [DOI] [PMC free article] [PubMed] [Google Scholar]
- 6. Ouyang J., Parakhia R. A., Ochs R. S. Metformin activates AMP kinase through inhibition of AMP deaminase. J. Biol. Chem. 286, 1–11 [DOI] [PMC free article] [PubMed] [Google Scholar]
- 7. Cronstein B. N. (2005) Low-dose methotrexate: a mainstay in the treatment of rheumatoid arthritis. Pharmacol. Rev. 57, 163–172 [DOI] [PubMed] [Google Scholar]
- 8. Tanabe K., Lanaspa M. A., Kitagawa W., Rivard C. J., Miyazaki M., Klawitter J., Schreiner G. F., Saleem M. A., Mathieson P. W., Makino H., Johnson R. J., Nakagawa T. (2012) Nicorandil as a novel therapy for advanced diabetic nephropathy in the eNOS-deficient mouse. Am. J. Physiol. Renal Physiol. 302, F1151–F1160 [DOI] [PMC free article] [PubMed] [Google Scholar]
- 9. Lanaspa M. A., Andres-Hernando A., Rivard C. J., Dai Y., Li N., Berl T. (2009) ZAC1 is up-regulated by hypertonicity and decreases sorbitol dehydrogenase expression, allowing accumulation of sorbitol in kidney cells. J. Biol. Chem. 284, 19974–19981 [DOI] [PMC free article] [PubMed] [Google Scholar]
- 10. Chaney A. L., Marbach E. P. (1962) Modified reagents for determination of urea and ammonia. Clin. Chem. 8, 130–132 [PubMed] [Google Scholar]
- 11. Kratzer J. T., Lanaspa M. A., Murphy M. N., Cicerchi C., Graves C. L., Tipton P. A., Ortlund E. A., Johnson R. J., Gaucher E. A. (2014) Evolutionary history and metabolic insights of ancient mammalian uricases. Proc. Natl. Acad. Sci. U.S.A. 111, 3763–3768 [DOI] [PMC free article] [PubMed] [Google Scholar]
- 12. Plaideau C., Liu J., Hartleib-Geschwindner J., Bastin-Coyette L., Bontemps F., Oscarsson J., Hue L., Rider M. H. (2012) Overexpression of AMP-metabolizing enzymes controls adenine nucleotide levels and AMPK activation in HEK293T cells. FASEB J. 26, 2685–2694 [DOI] [PubMed] [Google Scholar]
- 13. Viollet B., Lantier L., Devin-Leclerc J., Hebrard S., Amouyal C., Mounier R., Foretz M., Andreelli F. (2009) Targeting the AMPK pathway for the treatment of type 2 diabetes. Front. Biosci. 14, 3380–3400 [DOI] [PMC free article] [PubMed] [Google Scholar]
- 14. Brosius F. C., 3rd, Alpers C. E., Bottinger E. P., Breyer M. D., Coffman T. M., Gurley S. B., Harris R. C., Kakoki M., Kretzler M., Leiter E. H., Levi M., McIndoe R. A., Sharma K., Smithies O., Susztak K., Takahashi N., Takahashi T. (2009) Mouse models of diabetic nephropathy. J. Am. Soc. Nephrol. 20, 2503–2512 [DOI] [PMC free article] [PubMed] [Google Scholar]
- 15. Hawley S. A., Davison M., Woods A., Davies S. P., Beri R. K., Carling D., Hardie D. G. (1996) Characterization of the AMP-activated protein kinase kinase from rat liver and identification of threonine 172 as the major site at which it phosphorylates AMP-activated protein kinase. J. Biol. Chem. 271, 27879–27887 [DOI] [PubMed] [Google Scholar]
- 16. Shaw R. J., Kosmatka M., Bardeesy N., Hurley R. L., Witters L. A., DePinho R. A., Cantley L. C. (2004) The tumor suppressor LKB1 kinase directly activates AMP-activated kinase and regulates apoptosis in response to energy stress. Proc. Natl. Acad. Sci. U.S.A. 101, 3329–3335 [DOI] [PMC free article] [PubMed] [Google Scholar]
- 17. Han B. W., Bingman C. A., Mahnke D. K., Sabina R. L., Phillips G. N., Jr. (2005) Crystallization and preliminary X-ray crystallographic analysis of adenosine 5′-monophosphate deaminase (AMPD) from Arabidopsis thaliana in complex with coformycin 5′-phosphate. Acta Crystallogr. F Struct. Biol. Cryst. Commun. 61, 740–742 [DOI] [PMC free article] [PubMed] [Google Scholar]
- 18. Guinzberg R., Cortes D., Diaz-Cruz A., Riveros-Rosas H., Villalobos-Molina R., Pina E. (2006) Inosine released after hypoxia activates hepatic glucose liberation through A3 adenosine receptors. Am. J. Physiol. Endocrinol. Metab. 290, E940–E951 [DOI] [PubMed] [Google Scholar]
- 19. Johnson R. J., Perez-Pozo S. E., Sautin Y. Y., Manitius J., Sanchez-Lozada L. G., Feig D. I., Shafiu M., Segal M., Glassock R. J., Shimada M., Roncal C., Nakagawa T. (2009) Hypothesis: could excessive fructose intake and uric acid cause type 2 diabetes? Endocr. Rev. 30, 96–116 [DOI] [PMC free article] [PubMed] [Google Scholar]
- 20. Lv Q., Meng X. F., He F. F., Chen S., Su H., Xiong J., Gao P., Tian X. J., Liu J. S., Zhu Z. H., Huang K., Zhang C. (2013) High serum uric acid and increased risk of type 2 diabetes: a systemic review and meta-analysis of prospective cohort studies. PLoS One 8, e56864. [DOI] [PMC free article] [PubMed] [Google Scholar]
- 21. Johnson R. J., Andrews P., Benner S. A., Oliver W. (2010) Theodore E. Woodward award. The evolution of obesity: insights from the mid-Miocene. Trans. Am Clin Climatol. Assoc. 121, 295–305; discussion 305–298 [PMC free article] [PubMed] [Google Scholar]
- 22. Johnson R. J., Gaucher E. A., Sautin Y. Y., Henderson G. N., Angerhofer A. J., Benner S. A. (2008) The planetary biology of ascorbate and uric acid and their relationship with the epidemic of obesity and cardiovascular disease. Med. Hypotheses 71, 22–31 [DOI] [PMC free article] [PubMed] [Google Scholar]
- 23. Jansson D., Ng A. C., Fu A., Depatie C., Al Azzabi M., Screaton R. A. (2008) Glucose controls CREB activity in islet cells via regulated phosphorylation of TORC2. Proc. Natl. Acad. Sci. U.S.A. 105, 10161–10166 [DOI] [PMC free article] [PubMed] [Google Scholar]
- 24. Viollet B., Foretz M., Guigas B., Horman S., Dentin R., Bertrand L., Hue L., Andreelli F. (2006) Activation of AMP-activated protein kinase in the liver: a new strategy for the management of metabolic hepatic disorders. J. Physiol. 574, 41–53 [DOI] [PMC free article] [PubMed] [Google Scholar]
- 25. Riley M. S., Schade D. S., Eaton R. P. (1979) Effects of insulin infusion on plasma phosphate in diabetic patients. Metabolism 28, 191–194 [DOI] [PubMed] [Google Scholar]
- 26. Petersen K. F., Dufour S., Shulman G. I. (2005) Decreased insulin-stimulated ATP synthesis and phosphate transport in muscle of insulin-resistant offspring of type 2 diabetic parents. PLoS Med. 2, e233. [DOI] [PMC free article] [PubMed] [Google Scholar]
- 27. Dormandy T. L. (1965) The mechanism of insulin action: the effect of insulin on phosphate turnover in red-cell systems. J. Physiol. 180, 708–721 [DOI] [PMC free article] [PubMed] [Google Scholar]
- 28. Wu C., Okar D. A., Kang J., Lange A. J. (2005) Reduction of hepatic glucose production as a therapeutic target in the treatment of diabetes. Curr. Drug Targets Immune Endocr. Metab. Disord. 5, 51–59 [DOI] [PubMed] [Google Scholar]
- 29. Johnson A. B., Webster J. M., Sum C. F., Heseltine L., Argyraki M., Cooper B. G., Taylor R. (1993) The impact of metformin therapy on hepatic glucose production and skeletal muscle glycogen synthase activity in overweight type II diabetic patients. Metabolism 42, 1217–1222 [DOI] [PubMed] [Google Scholar]
- 30. Johnson R. J., Andrews P. (2010) Fructose, uricase, and the back-to-Africa hypothesis. Evol. Anthropol. 19, 250–257 [Google Scholar]
- 31. Johnson R. J., Lanaspa M. A., Gaucher E. A. (2011) Uric acid: a danger signal from the RNA world that may have a role in the epidemic of obesity, metabolic syndrome, and cardiorenal disease: evolutionary considerations. Semin. Nephrol. 31, 394–399 [DOI] [PMC free article] [PubMed] [Google Scholar]
- 32. Lanaspa M. A., Sanchez-Lozada L. G., Choi Y. J., Cicerchi C., Kanbay M., Roncal-Jimenez C. A., Ishimoto T., Li N., Marek G., Duranay M., Schreiner G., Rodriguez-Iturbe B., Nakagawa T., Kang D. H., Sautin Y. Y., Johnson R. J. (2012) Uric acid induces hepatic steatosis by generation of mitochondrial oxidative stress: potential role in fructose-dependent and -independent fatty liver. J. Biol. Chem. 287, 40732–40744 [DOI] [PMC free article] [PubMed] [Google Scholar]
- 33. Neel J. V. (1962) Diabetes mellitus: a “thrifty” genotype rendered detrimental by “progress”? Am. J. Hum. Genet. 14, 353–362 [PMC free article] [PubMed] [Google Scholar]
- 34. Schmid A. I., Szendroedi J., Chmelik M., Krssak M., Moser E., Roden M. Liver ATP synthesis is lower and relates to insulin sensitivity in patients with type 2 diabetes. Diabetes Care 34, 448–453 [DOI] [PMC free article] [PubMed] [Google Scholar]
- 35. Van den Berghe G., Bronfman M., Vanneste R., Hers H. G. (1977) The mechanism of adenosine triphosphate depletion in the liver after a load of fructose. A kinetic study of liver adenylate deaminase. Biochem. J. 162, 601–609 [DOI] [PMC free article] [PubMed] [Google Scholar]
- 36. Dermaku-Sopjani M., Almilaji A., Pakladok T., Munoz C., Hosseinzadeh Z., Blecua M., Sopjani M., Lang F. (2013) Down-regulation of the Na-coupled phosphate transporter NaPi-IIa by AMP-activated protein kinase. Kidney Blood Press. Res. 37, 547–556 [DOI] [PubMed] [Google Scholar]


