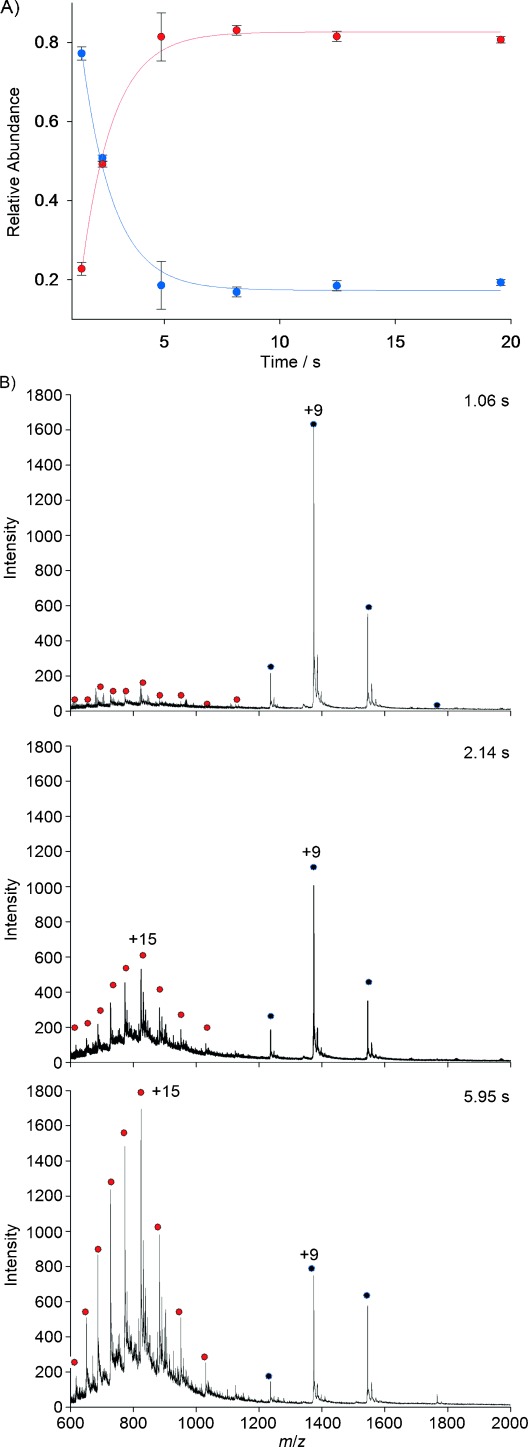
Figure 4.

Unfolding kinetics of Cyt c monitored by time-resolved mass spectrometry. A) The kinetic profile of acid induced denaturation of Cyt c. The depletion of folded Cyt c ( ) and the formation of unfolded species (
 ) is demonstrated. The plot was generated by measuring the signal intensity of charge states 7–20+ at different time points after mixing Cyt c with 5.0 % AcOH. Error bars represent the average error of three independent experiments. Solid lines are fits to the experimental data. B) Representative ESI-MS spectra recorded at different time points, 1.06, 2.14 and 5.95 s, during unfolding.
