Abstract
The BLAST-Like Alignment Tool (BLAT) is used to find genomic sequences that match a protein or DNA sequence submitted by the user. BLAT is typically used for searching similar sequences within the same or closely related species. It was developed to align millions of expressed sequence tags and mouse whole-genome random reads to the human genome at a faster speed (Kent, 2002). It is freely available either on the web or as a downloadable stand-alone program. BLAT search results provide a link for visualization in the University of California, Santa Cruz (UCSC) genome browser where associated biological information may be obtained. Three example protocols are given: using an mRNA sequence to identify the exon-intron locations and associated gene in the genomic sequence of the same species, using a protein sequence to identify the coding regions in a genomic sequence and to search for gene family members in the same species, and using a protein sequence to find homologs in another species. A support protocol is given to visualize multiple nearby matches obtained in a search in one view of the UCSC Genome Browser. Discussion of the technical aspects of BLAT is also provided.
Keywords: sequence similarity, alignment, homology
Introduction
The BLAST-Like Alignment Tool (BLAT) is used to find genomic sequences that match a protein or DNA sequence submitted by the user. The rationale and algorithms of BLAT have been described by its author (Kent, 2002). BLAT was designed to be very efficient at finding sequences with very high identity, such as from the same or closely related species. It does this primarily by pre-indexing the genome and translated (protein) database. (Kent, 2002).
BLAT’s speed is one of its main advantages. It is useful for quickly finding the genome location of a genomic, mRNA or protein sequence. Another is its integration with the University of California, Santa Cruz (UCSC) Genome Browser (UNIT 1.4); each search result links directly to a view of the alignment on the chromosome in the UCSC browser (see Bina, 2006 for a detailed example of this integration). BLAT has also been shown to be good at predicting exon-intron boundaries (Harper et al., 2006). BLAT provides one “stitched” longer alignment for discontinuous alignments between two sequences.
BLAT is available as a stand-alone program (http://genome.ucsc.edu/FAQ/FAQblat.html#blat3) or a web application. The latter is a client that queries the BLAT server at UCSC. In this unit, we will mainly describe the usage of the web version (http://genome.ucsc.edu/cgi-bin/hgBlat) and provide a few pointers to the stand-alone version.
BLAT accepts DNA or protein sequences as a query and provides only genome sequences for comparison. BLAT can compare a DNA query to a DNA database. However, BLAT also can work in a translated mode. For example, it can translate the DNA query and the DNA database and perform the sequence comparisons at the amino acid level. Thus, BLAT can compare a protein query to the translation of a DNA database or can translate a DNA query and compare it to a translated DNA database. It offers a choice of genome sequence databases for over 50 organisms, many with multiple assembly versions available for selection. The user can choose to receive the search results as a web page with a link for viewing them in a graphical format in the UCSC Genome Browser. More details are described in the protocols and in the commentary section.
Basic Protocol 1: Finding the Exon-Intron Structure of a Gene
Eukaryotic protein coding genes contain exons and introns (see the glossary of useful terms listed in the Internet Resources section of this unit). The introns are spliced out in the process of transcription to form mRNA. An mRNA contains a coding region, which is translated into protein, and untranslated regions (UTRs) on the 5′ and 3′ ends.
This protocol describes how to map an mRNA/cDNA sequence to a genomic sequence of the same species to identify exon-intron locations in the genomic sequence. It also describes how to identify the gene associated with the mRNA/cDNA. We will use the human ornithine carbamoyltransferase (OTC) mRNA sequence with NCBI RefSeq accession number NM_000531.5 as an example.
Necessary Resources
Hardware
Computer with internet access
Software
An up-to-date web browser, such as Firefox, Internet Explorer, or Safari
Files
NM_000531.txt
-
1
Go to the BLAT page http://genome.ucsc.edu/cgi-bin/hgBlat.
-
2
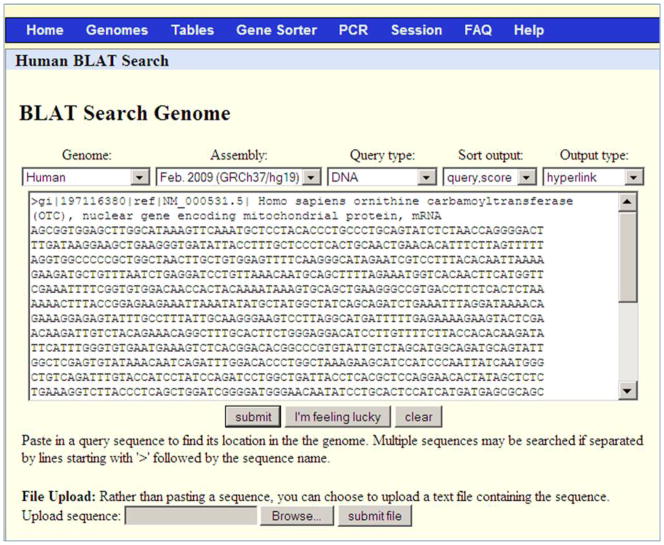
Paste the entire contents of the file NM_000531.txt in the input box (Figure 1).
The query needs to be in the FASTA sequence format. The FASTA sequence format includes a header line beginning with the “>“ symbol and a unique name followed by the sequence in the next line. The query sequence can be pasted in the query box or can be uploaded as a file using the Browse and submit file buttons on the same page (Figure 1). BLAT can accept a single query or multiple queries. Single query sequences are limited to 25,000 nucleotides or 10,000 amino acids. Multiple sequences can be submitted, up to 25 sequences at a time with a total of 50,000 nucleotides or 25,000 amino acids. These limitations can be overcome to some extent by using the stand-alone version as described in the commentary section. Multiple sequences should be separated by a header and must be of the same type of sequence. The header line is not necessary for one sequence only. The optimal minimum length for DNA BLAT is 40 nucleotides and protein BLAT is 20 amino acids. For details, refer to the BLAT online documentation listed in the Internet Resources section of this unit.
-
3
Use the default genome (Human).
Since our goal is to find exon locations in the human genomic sequence, we will search against the human genome. The drop-down menu under the Genome heading lists a number of other organisms; this will be explored in Protocol 3.
-
4
Use the default Assembly (Feb 2009 GRCh37/hg19).
Feb 2009 (GRCh37/hg19) is the most recent human genome assembly as of July 2011. The user is provided with an option of three previous human genome assemblies under the Assembly heading.
-
5
Change the query type to DNA (Figure 1).
There are multiple options listed under the Query type menu. Although the query sequence can only be DNA or protein, this menu also provides an option for the mode in which queries can be searched against the genome sequence. Apart from BLAT’s guess, the options listed in the menu are:
DNA: A DNA query is searched against a DNA database.
Protein: A protein query is searched against 6 reading frame translations of a DNA database (both forward and reverse strands are translated to amino acids in 3 reading frames each).
Translated DNA: BLAT translates a DNA query in 6 reading frames and compares it to 6 reading frame translations of the DNA database.
Translated RNA: BLAT translates a DNA query in 3 reading frames on one strand (forward strand) and compares it to 6 reading frame translations of the DNA database.
The query type “DNA” is useful for finding similarity within the same organism. For example, it is useful for comparing mRNA/EST queries to the genome usually of the same organism (as demonstrated in this Protocol). It works well for human and primate sequences.
The query type “protein” and both translated options are useful for finding more distant matches. Hence, they are useful for comparison of sequences across species. For example, translated DNA or translated RNA is useful for comparing mRNA/EST queries to a different species genome. Specifically, translated DNA will be useful for EST queries with unknown/ambiguous originating strand information, since both forward and reverse strand translation comparisons are performed in this mode. The Query type “protein” is useful for finding gene family members in the same species (as demonstrated in Protocol 2) or for finding homologs in a different species (as demonstrated in Protocol 3). Protein BLAT works well for searches within terrestrial vertebrates.
In this protocol using the query type “DNA”, a human cDNA query sequence will be searched against the same (human) genome sequence. The aligning regions will identify the exon locations in the human genome sequence.
-
6
Use the default Sort output (query, score).
Refer to the legend for Figure 1 for other available options.
-
7
Set the default Output type to hyperlink.
Refer to the legend for Figure 1 for other available options.
-
8
Click on the submit button.
Since we opted to sort the results by query, score (Figure 2), the first row shows the match with highest score 1638 (SCORE column). The QUERY NM_000531.5 matches the human genome from its nucleotide 1 to 1647 (START and END columns next to the SCORE column). The query size is 1647 (QSIZE column). The entire query has coverage in the human genome with 100% identity (IDENTITY column). This alignment is on chromosome X (CHRO column), on the plus strand (STRAND column) from nucleotide 38211736 to 38280703 (START and END columns next to the STRAND column), covering a range of 68968 (SPAN column) nucleotides. The BLAT score and percent identity calculations are described in detail in the Commentary section. The higher the score, the better is the alignment. There are other hits of smaller spans on other chromosomes with very small scores.
Figure 1.
Web BLAT search screen for Protocol 1. The interface allows the user to easily specify (from left to right) the genome, assembly, mode of search, the desired sorting of the results, and the output format. The Genome pull-down menu provides a choice of over 50 species from mammals, fish, invertebrates, yeast, and others. Some, such as human, will have more than one choice of genome assembly in the Assembly pull-down menu. The Query type pull-down menu provides an ability to choose the mode of the search. The DNA Query type used in this protocol searches a DNA query against a DNA database. Additional available options are described in the text. The Sort output pull-down menu can be used to sort the results table. The options are “query, score”; “query, start”; “chromosome, start”; “chromosome, score”; and “score”. The “query, score” option first sorts by query ID (if multiple sequences are pasted into the input box) and then by score. Finally, the “Output type” pull-down menu provides 3 options to present the results, hyperlink, psl and psl no header. The choice of “Output type” as hyperlink yields a table with a link (Browser) to display each alignment in the UCSC Genome Browser and a link (details) to the details of the alignment. The psl output type provides details about mismatches, gaps, and blocks in a tabular format and does not provide links to alignments or the genome browser. The PSL output format is described in detail in the text. Finally, the large text box is for the input sequence. The sequence needs to be in FASTA format as shown here for the query NM_000531.5, which is used in Protocol 1. Clicking on the submit button generates the table of alignments. The “I’m feeling lucky button” goes directly to the genome browser to display the genome alignment of the best scoring alignment of the first input sequence. The clear button resets the input text box. The “Browse” and “submit file” buttons are for uploading sequences from a file instead of copying them into the text box.
In this Protocol, the selected options are “Human” genome, “Feb 2009 GRCh37/hg19” assembly, “DNA” as query type, “query, score” for sorting the results and “hyperlink” as the output type.
Figure 2.
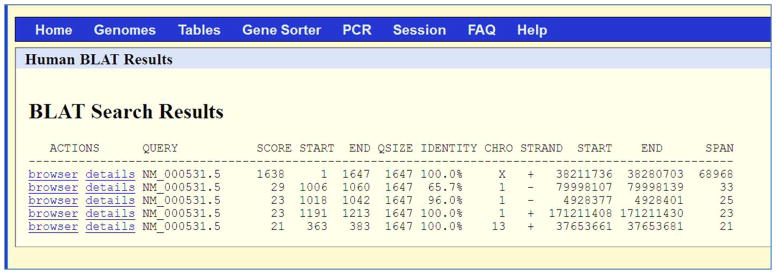
Results table for Protocol 1. The BLAT search results provide the following columns: 1) ACTIONS – links for visualization of the alignment in the UCSC Genome Browser (browser link) and a more detailed alignment text view (details link); 2) QUERY – an identifier for the query sequence; 3) SCORE – the number of matches with a penalty for mismatches and gaps (see subsection “Score calculation” in the Commentary); 4) START – the location of the beginning of the alignment in the query sequence; 5) END – the location of the end of the alignment in the query sequence; 6) QSIZE – the length of the query sequence; 7) IDENTITY – an indication of the number of matching bases and gaps (see subsection “Percent identity calculation” in the Commentary); 8) CHRO – the chromosome; 9) STRAND – both query strands (‘+’ and ‘−’) are checked in the alignment. In the translated alignment mode, a second ‘+’ or ‘−’ for the genomic strand is provided; 10) START – the location of the beginning of the alignment in the genome sequence; 11) END - the location of the end of the alignment in the genome sequence; and 11) SPAN – the number of bases on the genome covered by the alignment. The information in the table – such as score, span and identity – indicates the extent of the match.
The results in this Protocol are sorted by score; the top result has a much higher score than the others. The first row in the results shows that the QUERY NM_000531.5 matches the human genome with a score of 1638 (SCORE column) from its nucleotide 1 to 1647 (START and END columns next to the SCORE column). The query size is 1647 (QSIZE column). Thus, the entire query has coverage in the human genome with 100% identity (IDENTITY column). This alignment is on chromosome X (CHRO column), on the plus/forward strand (STRAND column) from nucleotide 38211736 to 38280703 (START and END columns next to the STRAND column), covering a range of 68968 (SPAN column) nucleotides.
Visualizing details about the sequence alignment
-
9
The ACTIONS column in the search results (Figure 2) provides two links, the details link, leading to the details of the sequence alignment of the query mRNA to the genomic sequence (Figures 3–5), and the browser link to visualize the alignment in a graphical format in the UCSC Genome Browser (Figure 6). It is better to view and investigate the alignments from the details link to determine the quality of the match before visualizing them in the UCSC Genome Browser. Click on the details link (Figure 2).
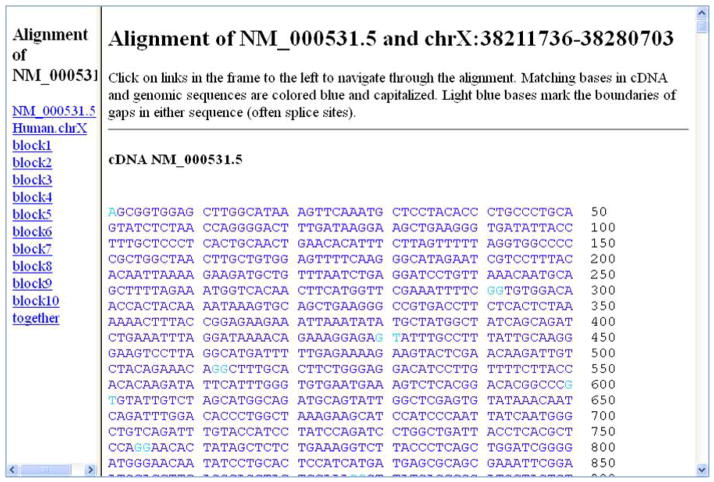
The top of the resulting page lists the query cDNA NM_000531.5 sequence (Figure 3). It can also be obtained by clicking on the NM_000531.5 link on the left side bar. The nucleotides in the cDNA sequence that match the human genomic sequence are shown in capital blue letters. Since, in this alignment, query coverage identity is 100%, each nucleotide in the cDNA is capitalized. The boundaries of gaps in its alignment with the genomic sequence are highlighted in light blue. Thus, these positions indicate the ending of one exon and beginning of the next exon.
-
10
Click on the human chromosome X link on the left side of the page in Figure 3 or scroll down the page.
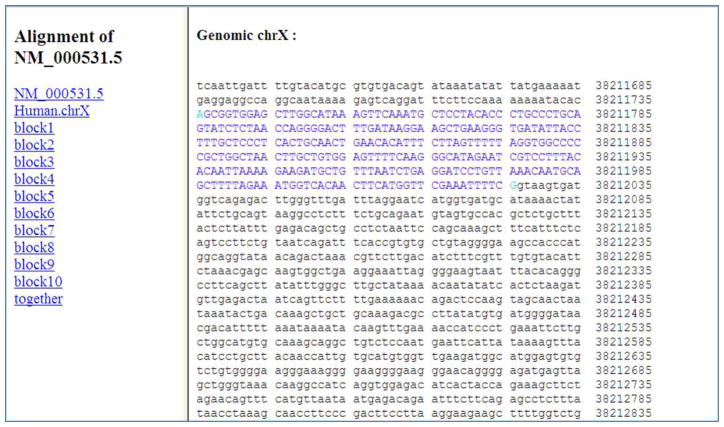
Figure 4 displays the genomic sequence corresponding to the start and end of the aligned query sequence, and it also displays 100 nucleotides upstream and downstream of the aligned sequence. Figure 4 shows the beginning portion of the sequence. The nucleotides aligned to the mRNA/cDNA query (putative exons) are colored in dark blue and are shown in capital letters. The boundaries of gaps in the alignment (often close to the exon-intron splice sites) are marked in light blue capital letters. The unaligned regions (introns or upstream/downstream sequences) are colored in black lowercase letters. There are 10 blocks of aligned sequences between the query and the genome. Since the entire cDNA is aligned to the genomic DNA, it indicates that the cDNA contains 10 exons. These can be visualized by scrolling the page further or by clicking on the block 1 to block 10 links in the left side bar.
-
11
Click on the “together” link on the left side of the page in Figure 3 or 4 (or scroll the page further).
The resulting page provides the side-by-side alignments of the query cDNA and the target genomic sequences in 10 blocks. Each block is separated by a horizontal line. Figure 5 shows the first alignment block. It is divided into sections of 50 coordinates each. In each section, the top line represents the query cDNA and the line beneath it represents the genomic DNA. This display is useful for finding the exact coordinates of the exons in the cDNA and genome. For example, from Figure 5, the first exon coordinates for the NM_000531.5 cDNA sequence are 1 to 291, and the corresponding coordinates for the human chromosome X (in the Feb 2009 GRCh37/hg19 assembly) are 38211736 to 38212026. Coordinates for the remaining 9 exons can be obtained in a similar manner. This display is also useful for identifying sequence variations in the query and genome sequences (as demonstrated in Protocol 3).
Figure 3.
Detailed alignment information for a part of the query cDNA sequence in Protocol 1. Capital blue letters indicate matching nucleotides in the cDNA sequence NM_000531.5 to the human genomic sequence. Since in this alignment, query coverage identity is 100%, each nucleotide in the cDNA is capitalized. Light blue letters indicate where the blocks of the query sequence begin and end on the aligned genomic sequence, thus indicating the start and end positions of exons. The query is aligned to the genome in 10 blocks, as listed on the left bar of the page. Each block represents an exon; thus, there are 10 exons in the cDNA NM_000531.5.
Figure 5.
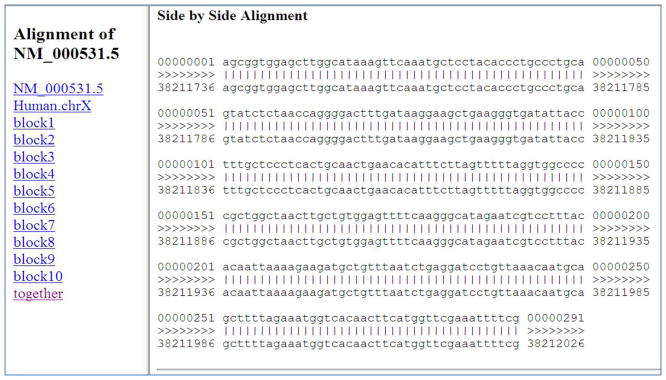
Detailed side-by-side alignment information for the query cDNA and target genome sequence for the first match in Protocol 1. The figure shows the first block of the first alignment between the query and target genome divided in sections of 50 nucleotides. In each section, the top line represents the query cDNA NM_000531.5, and the line beneath it represents the human genomic DNA, chromosome X. In this block, the NM_000531.5 cDNA query nucleotides with coordinates from 1 to 291 align with human chromosome X nucleotides (in the Feb 2009 GRCh37/hg19 assembly) from 38211736 to 38212026. The identity, shown by a vertical bar between the query and genome nucleotides, is 100%. Details can be found in the text.
Figure 6.

UCSC Genome Browser display of the first match in Protocol 1 with the default gene annotation track added. The position/search box lists the displayed region coordinates, chromosome X:38211736 to 38280703, corresponding to the first match. This region is depicted by a red rectangle in the p arm of the chromosome X ideogram. The box below the ideogram displays two tracks. The top track, labeled “Your Sequence from BLAT Search”, shows the alignment of the query NM_000531.5. Each thick bar represents an alignment block identified in the “details” view in Figure 3. The second track is the UCSC gene track (labeled “UCSC Genes Based on RefSeq, UniProt, GenBank, CCDS and Comparative Genomics”). This track identifies the gene, OTC (the symbol written on the left side of the track), associated with the query transcript NM_000531.5. The exons in the gene, indicated by thick bars on the gene line, match the thick bars on the query line above. The gene is annotated on the plus strand as indicated by the ≫> symbols on the line representing it. Information about the gene can be obtained by clicking on the gene name, OTC. Details can be found in the text.
Figure 4.
Detailed alignment information for a part of the aligned target genome sequence (chromosome X) in Protocol 1. Upstream non-aligned bases are shown in lowercase black letters; the first block of aligned sequence (exon) bases are shown in uppercase blue letters, followed by another non-aligned block in lowercase black letters, an intron. The start and end of the exon are shown in light blue. Details can be found in the text.
Viewing the graphical display of the match
-
12
The hyperlink output option as used in this protocol provides a link to the UCSC Genome Browser in the BLAT search results page. In order to access the results page (and to access the browser link), click on the back browser button until the BLAT search results page, as displayed in Figure 2, is obtained.
-
13
Click on the browser link in the first match.
This view (Figure 6) is useful for visualizing the match in a graphical format. Also, it is useful for getting more biological information about the aligned genomic region, for example, the gene, single nucleotide polymorphisms or transcription factor binding sites. Figure 6 shows the region of the X chromosome with coordinates (38211736 to 38280703) corresponding to the first match. These coordinates are listed in the position/search box. Below it is an ideogram of the X chromosome. A red rectangle on the ideogram highlights the location of the region displayed in this view. The box beneath the ideogram displays two tracks in two horizontal rows. The first row (labeled “Your Sequence from Blat Search”) represents the alignment of the query NM_000531.5 to this genomic region. Each block of the alignment identified in the “details view” earlier is shown by a thick bar on the line. The second row (labeled “UCSC Genes Based on RefSeq, UniProt, GenBank, CCDS and Comparative Genomics”) shows the associated gene in this region. Its gene symbol, OTC, is given on the left side of the track. Thus, the query transcript NM_000531.5 is associated with the OTC gene. The exons in the gene, indicated by thick bars on the gene line, match the thick bars in the query transcript alignment. The gene is annotated on the plus strand as indicated by the ≫> symbols on the line representing it. For more information on how to use the UCSC Genome Browser to add/remove information, refer to Karolchik et al., 2007 and http://genome.ucsc.edu/goldenPath/help/hgTracksHelp.html.
This protocol outlines the steps for identifying the exon locations in the transcript NM_000531.5, the gene (OTC) that encoded the transcript, the chromosome on which the gene is placed and the exon-intron coordinates of the OTC gene at the chromosome level.
Basic Protocol 2: Mapping a Protein Sequence to the Genome
BLAT can accept amino acids as input and return the best matches in the selected genomic DNA using the translated database as noted above. This protocol describes how to identify the coding exon locations using a protein sequence for a BLAT search. It also describes how to identify the related gene family members. Since, in this protocol, a query protein sequence is compared to the genomic DNA sequence, the region where the query aligns to the genome will indicate the coding region, the part of the exons that get translated in the protein. This protocol will not identify the untranslated region of the exons (UTR). However, in Protocol 1 the query was mRNA/cDNA; therefore the region it aligned to the genome indicated the transcribed region and thus included UTRs in addition to the coding region. We will use the human hemoglobin subunit beta (HBB) protein with NCBI RefSeq accession number NP_000509.1 as an example.
Necessary Resources
Hardware
Computer with internet access
Software
An up-to-date web browser, such as Firefox, Internet Explorer, or Safari
Files
NP_000509.txt
-
1
Go to the BLAT page http://genome.ucsc.edu/cgi-bin/hgBlat.
-
2
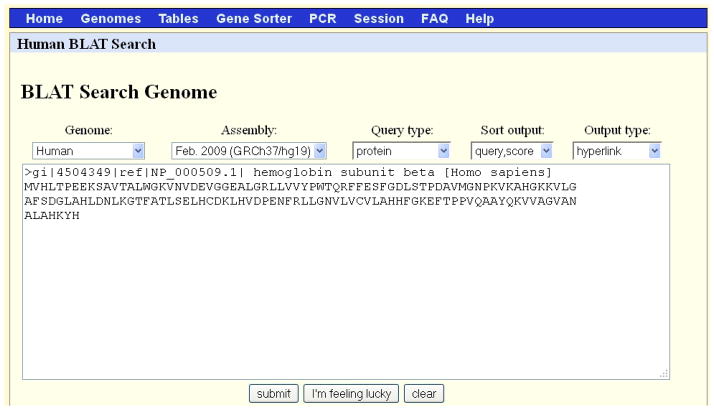
Paste the entire contents of the file NP_000509.txt (the header line beginning with “>“ and the sequence) in the input box (Figure 7).
-
3
Use the default Genome (Human) and Assembly (Feb 2009 GRCh37/hg19).
Please refer to Protocol 1 and the legend for Figure 1 for additional details on different BLAT search options.
-
4
Change the Query type to protein.
This option compares the protein query to the 6 reading frame translation of the genome database.
-
5
Use the default Sort output (query, score), and Output type (hyperlink) (Figure 7).
-
6
Click on the submit button.
In this search, a protein query is searched against the translation of the genome. Thus, the comparison is at the amino acid level. Since the genetic code is redundant, several codons can code for the same amino acid. For this reason, a comparison of a protein query and genome translation can generate more potential matches than using a nucleotide-nucleotide comparison. Also, web BLAT’s default word size for proteins is a 4-mer rather than the 11-mer for nucleotide searches (Kent, 2002). Thus, protein and translated searches are more effective and can find more distant matches.
The results (Figure 8) show several possible matches of the query to the human genome. We will first analyze the topmost scoring match in detail, visualize that in the UCSC Genome Browser and then investigate other matches.
Figure 7.
The BLAT search screen for Protocol 2. Note that the option “protein” is selected for the Query type. Refer to the legend for Figure 1 for additional information on the content of each search menu option.
Figure 8.

The results of the BLAT search, Protocol 2, shown in Figure 7. The first hit has 100% coverage (IDENTITY column) on chromosome 11. Other hits also have high identity and long alignments. All of the hits in this example are on chromosome 11. Refer to the legend for Figure 2 and text for additional information on the content of each column of the display.
Analyzing the first match of the result
The first match, with the highest score 439 (SCORE column), shows that the query NP_000509.1 has complete coverage. The entire 147-amino acid query (QSIZE, 147) from its nucleotide 1 to 147 (START and END columns after the SCORE column) is 100% identical (IDENTITY, 100%) in 1421 (SPAN, 1421) nucleotides on the chromosome 11 (CHRO, 11) from nucleotide 5246831 to 5248251 (START and END columns next to the STRAND column). The strand of this match is listed as +-. In this search, BLAT compares the protein query against 6 reading frame translation of the genome database. The first strand character (+) refers to the query; the second (−) refers to the genome (or database target). This means that the query protein sequence aligns to the (translation of the) reverse-complemented target DNA database or (the translation of) the minus strand of the genome. This indicates that the gene is placed on the reverse strand of chromosome 11. Viewing it in the UCSC Genome Browser, as described later, is more informative.
Visualizing details about the sequence alignment for the first match
-
7
In order to visualize the sequence alignment between the query and genome, click on the “details” link for the first match in Figure 8.
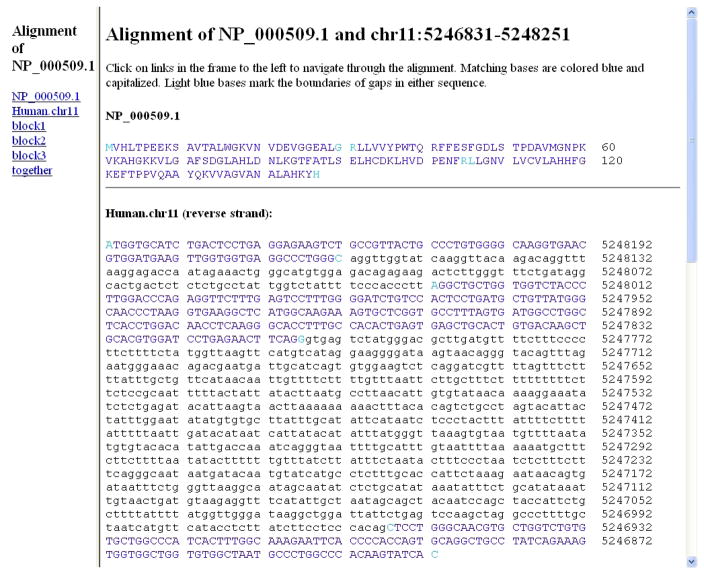
That takes us to a page (Figure 9) displaying the query amino acid sequence followed by the corresponding genomic nucleotide sequence (human chromosome 11 reverse strand) of the BLAT match. Blue uppercase letters indicate the portions of the sequences that match. All amino acids in the query are in uppercase indicating 100% coverage in the genome. In the genomic sequence, uppercase letters represent the nucleotides whose translation matched the query amino acids; thus, they represent the coding exons. Light blue letters mark the boundaries of the aligned regions (indicating the start and end of these exons). The black lowercase letters indicate portions that do not match. Since the complete protein query sequence is matched to the genome, we can infer that the unmatched nucleotides in the genomic DNA are putative introns.
-
8
Click on the “together” link in the left bar (or scroll the page further) in Figure 9.
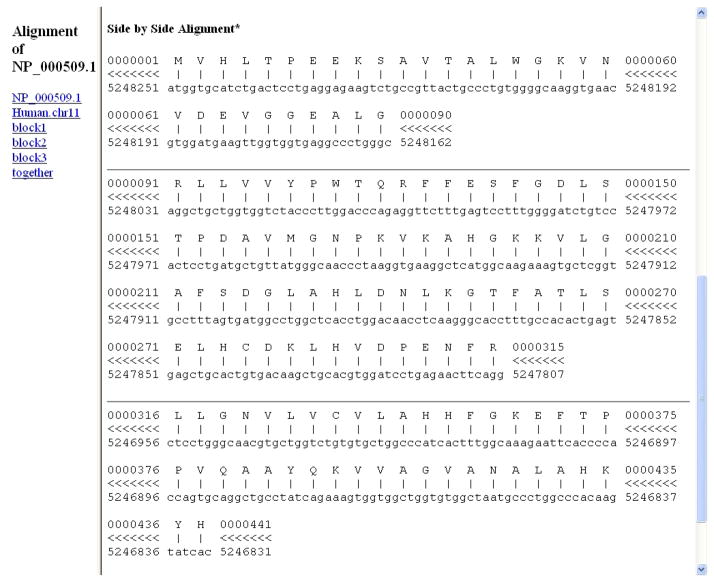
Figure 10 shows the alignment of the amino acids in the query and the corresponding matching genome (nucleotide) sequence. Each block (coding exon) is shown separately. The result shows the alignment is in 3 blocks indicating the gene has 3 coding exons. The page provides their coordinates for both query and genome at the nucleotide level. Each alignment block is presented in several sections of 60 coordinates. In each section, the first sequence line provides the query amino acid sequence, and the second sequence line gives the nucleotide sequence of the aligning genome. For both lines, the starting and ending coordinates are at the nucleotide level. Thus, in the first section of the first block, in the first line, coordinates 1 to 60 correspond to the first 20 amino acids in the query, and in the second sequence line, coordinates 5248251 to 5248192 correspond to the starting and ending coordinates on the aligning chromosome, 11. In the second section, in the first line, coordinates 61 to 90, correspond to the amino acids 21 to 30 in the query, and in the second sequence line, coordinates 5248251 to 5248192, correspond to the starting and ending coordinates on the aligning chromosome, 11. Thus, the first block provides the coordinates for the first coding exon. In the Feb 2009 GRCh37/hg19 assembly used in this search, nucleotides 5248251 to 5248162 on chromosome 11 represent the first coding exon encoding the first 30 amino acids of NP_000509.1. Coordinates for the remaining two exons can be derived in the same way from Figure 10. The symbols “≪<“ between the query and chromosome coordinates (between the first and second lines) indicate the alignment is on the minus strand (of chromosome 11). We will visualize the alignment and the placement of the gene in a graphical format in the UCSC Genome Browser.
Figure 9.
Detailed alignment information for the first match of the query protein and chromosome 11 sequences in Protocol 2. The protein query NP_000509.1 sequence is listed at the top, and the region of the chromosome 11 sequence that aligned to the query is shown below it. In this match, all of the query sequence was aligned to the genome (translation), so all of the letters in the query sequence are capitals and colored blue. In the genomic DNA sequence below, the (translation of the) nucleotides that aligned to the protein sequence are shown in capital letters and colored blue. Refer to the legends for Figures 3 and 4 and to the text for additional information on the content of the display.
Figure 10.
Detailed side-by-side alignment information for the query protein and genome sequences in Protocol 2. The result shows the alignment is in 3 blocks indicating the gene has 3 coding exons. Each alignment block is separated by a horizontal line, and is divided into sections of 60 coordinates. In each section, the first sequence line provides the query amino acid sequence and the second sequence line gives the nucleotide sequence of the aligning genome. For both lines, the starting and ending coordinates are at the nucleotide level. Thus, in the top section of the first block, the first line shows the sequence of the first 20 amino acids in the query. The coordinates for this line are 1 to 60 corresponding to the codons for the first 20 amino acids. The second sequence line shows the nucleotides with starting and ending coordinates (5248251 to 5248192) on the aligning chromosome, 11. The second section of this block shows alignment of query amino acids 21 to 30 (again the coordinates for the top line, 61–90, are for the nucleotides in the codons) to the nucleotides 5248191 to 5248162 on chromosome 11. See the text for details.
Viewing the graphical display of the first match
-
9
The browser link provided in the hyperlink format of the BLAT search results gives access to the view of the match in the UCSC Genome Browser. Access the BLAT results page as shown in Figure 8 by using the back button of the web browser.
-
10
Click on the “browser” link for the first result.
This takes us to the UCSC Genome Browser display of the aligned genome region with default annotation track added (Figure 11). This view displays the human genome region corresponding to the first hit, as written in the position/search box, chromosome 11 from nucleotide 5246831 to 5248251. We will adjust this location later as described in the “Support Protocol” to include all matches obtained in this search. The location of the currently displayed region on chromosome 11 is shown by a red rectangle bar on the chromosome 11 ideogram. Below it, two tracks are shown. The top track shows the alignment of the query sequence NP_000509.1. Each alignment block identified in the “details” view earlier is shown by a thick bar (3 thick bars for 3 blocks of alignments). The second track is the UCSC gene track providing a graphical display of the gene annotated in the region. The corresponding gene symbol, HBB, is labeled on the left sidebar of the page. The thick bars on the line representing the gene indicate exons and the lines in between indicate introns. As noted earlier, the protein NP_000509.1 is encoded by three exons represented by three thick bars. As also noted earlier, the gene is placed on the reverse strand indicated by the ≪< symbols on the line representing the gene.
-
11
Information about the gene can be obtained by clicking on the gene name. Click on the gene symbol HBB on the left sidebar.
The description at the top of the page identifies this protein as beta globin, the query protein in this search. Thus, the first match is the self-hit to the query sequence.
Investigation of the top scoring match in the Protocol 2 demonstrates how to identify the coding region locations of a gene in a genome. As noted earlier, there are a number of other matches (Figure 8) in this BLAT search.
Figure 11.

UCSC Genome Browser display of the aligned genome region for the first match in Protocol 2. The region displayed in this view is nucleotides 5246831 to 5248251 of chromosome 11. The query sequence alignment is represented in the top track and the UCSC gene track is represented in the second line. A label to the left of this track indicates the symbol for the gene, HBB, represented in that track. Refer to the legend for Figure 6 and the text for additional information on the content of the display.
Remaining matches of the result
-
12
Use the back button of the web browser to go back to the page shown in Figure 8.
The scores, spans and identity percentages of other matches in this search warrant further investigation. Hence, in contrast to Protocol 1, the other results in this search are potentially interesting. All of these matches are on the same chromosome, 11. These hits possibly indicate homologs of the query beta globin protein in the same genome (human) and thus the globin gene family members. As described above in step 10, the browser link for each match can be used to identify the gene associated with that match. However, instead of viewing only one match at a time as displayed in Figure 11, all of these matches can be visualized together in one view of the UCSC Genome Browser. This will make the task of identifying the genes corresponding to all the matches much easier. The following support protocol demonstrates how to perform this task.
Support Protocol: Viewing all BLAT Matches on the Same Chromosome Simultaneously in the UCSC Genome Browser
We will use the same protein, NP_000509.1, used in Protocol 2 as the query for this protocol.
The matches obtained in a BLAT search, which are on the same chromosome, can be displayed in one UCSC Genome Browser view by adjusting its chromosome coordinate range to include all the matches. In order to get the lowest and highest chromosome coordinates of the range, we will set the sort output option to “chrom, start” when setting up a BLAT search.
Necessary Resources
Hardware
Computer with internet access
Software
An up-to-date web browser, such as Firefox, Internet Explorer, or Safari
Files
NP_000509.txt
-
Go to the BLAT page http://genome.ucsc.edu/cgi-bin/hgBlat.
Please refer to Protocol 1 and legend for Figure 1 for additional details on different BLAT search options.
Paste the entire contents of the file NP_000509.txt (the header line beginning with “>“ and the sequence) in the input box (Figure 12).
Use the default Genome (Human) and Assembly (Feb 2009 GRCh37/hg19).
Use the Query type protein.
Change the Sort output option to “chrom, start”.
Use the default Output type (hyperlink).
-
Click on submit button (Figure 12).
The matches are the same as Protocol 2 in Figure 8 but are sorted by their order on the chromosome (Figure 13). Note that all hits are on the same chromosome, 11. The STRAND is +- for each match. As seen the previous protocol, this means that the query protein aligned to (the translation of) the minus strand of the genome and thus all the matching genes are on the minus strand of chromosome 11. Note that the chromosome coordinates for the START of the first match and end of the last match are 5246831-5290908 (START column for the first match and END column for the last match, near the STRAND column).
Click on the browser link for the first match in Figure 13 to go to the UCSC Genome Browser.
Change the contents of the position/search box from “chr11:5,246,831-5,248,251” to “chr11:5,246,831-5,290,908”.
-
Click on the jump button.
In the resulting display (Figure 14), the first track called “Your Sequence from Blat Search” shows all alignments for all the matches to the query NP_000509.1. The second track shows the annotated genes in the displayed genomic region. From left to right, these are HBB, HBD, HBBP1, HBG1, HBG2 and HBE1. Information about these genes can be obtained by clicking on the gene name.
-
Click on the gene symbol HBD.
The description at the top of the page lists this gene as delta globin.
-
Similarly information about other genes can be obtained by clicking on the respective gene names.
These genes are beta globin (HBB), delta globin (HBD), HBB beta pseudogene 1 non-coding RNA (HBBP1), A-gamma globin (HBG1), G-gamma globin (HBG2) and epsilon globin (HBE1). As noted earlier these genes are placed on the reverse strand, also shown in this display by the “≪<“ on each of the lines representing the genes (Figure 14). Thus, HBE1 gene is on the 5′ end and HBB on the 3′ end.
This protocol demonstrates how to visualize all matches for a BLAT search that are on the same chromosome in one view of the UCSC Genome Browser. The view helped identify the genes associated with each of the matches in an easier manner instead of clicking on one match at a time as seen in Protocol 2. This view thus identified the globin gene cluster members and their order on the human chromosome 11. The order is epsilon globin –> G-gamma globin —> A-gamma globin —> delta globin –> beta globin. A non-coding gene HBBP1 is also within the cluster.
Protocol 2 demonstrates how to use a protein sequence to compare the genome sequence of the same organism to identify the genomic coordinates of the protein coding regions and the gene family members. This “Support Protocol” makes the task of identifying the gene family members much easier.
Figure 12.
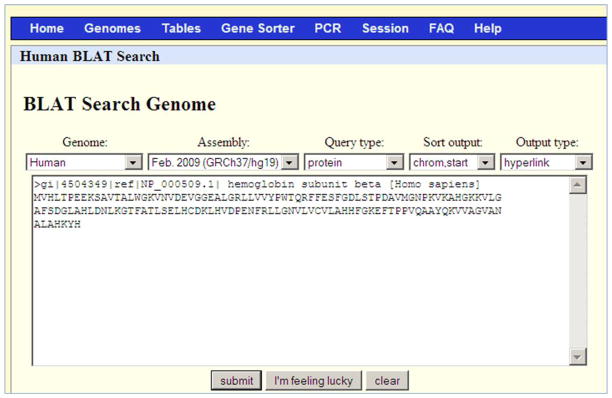
The BLAT search screen for the “Support Protocol” section. Note that the “Sort output” selection is “chrom, start”. Refer to the legend for Figure 1 for additional information on the content of each search menu option.
Figure 13.

Results of the BLAT search in Figure 12. Since the sorting option “chrom, start” was used, the results are sorted by their position on the chromosome as opposed to the “query, score” sorting in Figure 8. In this case, “start” refers to the column START after the STRAND column. Note that the hits are on chromosome 11 between positions 5246831 and 5290908. Refer to the legend for Figure 2 and the text for additional information on the content of each column of the display.
Figure 14.

UCSC Genome Browser display of the aligned genome region in the search described in the “Support Protocol”. After changing the view in the genome browser to include positions 5246831 and 5290908, the range identified in the previous figure, the browser shows genes corresponding to all six matches: HBB, HBD, HBBP1, HBG1, HBG2, and HBE1. Refer to the legend for Figure 6 and the text for additional information on the content of the display.
Basic Protocol 3: Finding a Gene Homolog in the Genome of Another Organism
In the first two protocols, our query sequence and genome were of the same species (human). In this protocol, we will search for chimp homologs of the human ornithine carbamoyltransferase (OTC) gene using its protein sequence. BLAT, in protein mode, can be best used to search across terrestrial vertebrates. As described above, protein and translated searches can find more distant matches and are thus useful for comparison across species. This protocol uses a human protein (RefSeq accession number NP_000522.3) as a query. It is the protein encoded by the mRNA, NM_000531.5, used in Protocol 1. The protocol demonstrates the identification of the chimp homologous region and the amino acid difference(s) between the chimp and human homologs.
Necessary Resources
Hardware
Computer with internet access
Software
An up-to-date web browser, such as Firefox, Internet Explorer, or Safari
Files
NP_000522.txt
-
1
Go to the BLAT page http://genome.ucsc.edu/cgi-bin/hgBlat.
Please refer to Protocol 1 and legend for Figure 1 for additional details on different BLAT search options.
-
2
Paste the entire contents of the file NP_000522.txt (the header line beginning with “>“ and the sequence) in the input box (Figure 15).
-
3
Change the genome to “chimp”.
Note that the genome assembly is changed to Oct 2010 (CGSC 2.1.3 panTro3). When the genome is changed, the Assembly menu automatically changes to the available choices.
-
4
Use the Oct 2010 (CGSC 2.1.3 panTro3) assembly.
-
5
Use the Query type “protein”.
-
6
Change the Sort output to “query, score”.
Note that the BLAT page does not show the default options but retains the options selected for previous search, such as sort output chromosome, start. The user needs to change these, if necessary.
-
7
Use the Output type “hyperlink”.
-
8
Click on the “submit” button (Figure 15).
The results (Figure 16) show that the first match for the query NP_000522.3 has a score 837 (SCORE column). It is on chromosome X (CHRO column) of the chimp genome in the Oct 2010 (CGSC 2.1.3 panTro3) assembly between nucleotides 38694212 and 38778403 (START and END columns next to the STRAND column) over the span of 84192 nucleotides. The STRAND ++ indicates that the protein query aligned to the (translation of the) forward strand of the chromosome X. The percent identity (IDENTITY column) indicates a high but imperfect match (see the subsection Percent Identity Calculation in the Commentary).
Figure 15.
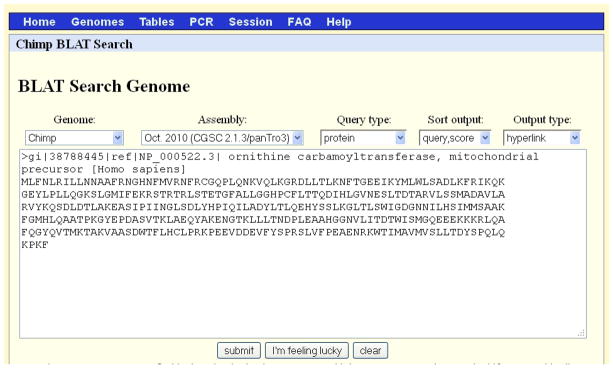
The BLAT search screen for Protocol 3. When the Genome was changed to Chimp, the Assembly changed automatically. Refer to the legend for Figure 1 for additional information on the content of each search menu option.
Figure 16.

The results of the BLAT search shown in Figure 15. The first match has a much higher score than the second, and it matches over a longer span. Based on the columns CHRO, STRAND, START and END, the second match lies entirely within the span of the first. Refer to the legend for Figure 2 and the text for additional information on the content of each column of the display.
Visualizing the details about the sequence alignment
-
9
Click on the “details” link for the first match in Figure 16.
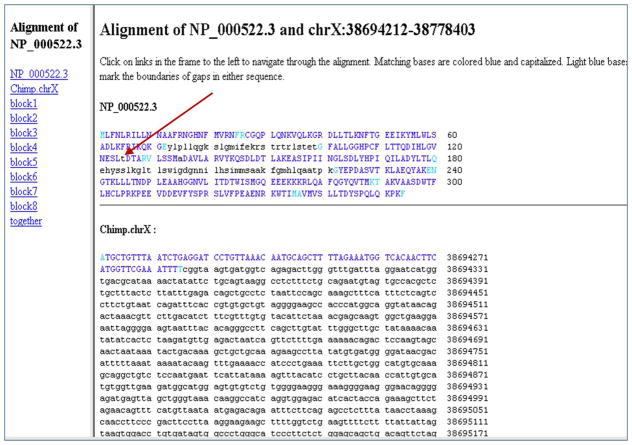
The resulting page (Figure 17) shows the query protein sequence NP_000522.3 and a part of the region of the chimp chromosome X sequence whose translation was matched by BLAT to the query. The sequences that match in the query and the genome are highlighted in capital blue letter; the start and end of the aligning regions are marked in light blue. The sequence that does not match is shown in lowercase black letters. There are two long stretches of sequences in the query protein sequence in lowercase black letters. Either these amino acids are not present in the chimp homolog, or it is possible that there are some portions of the chimp genome that are not yet available in the sequence assembly used. Also, note that the lowercase t at position 125 for threonine, representing a mismatch with the chimp sequence, is indicated by a red arrow in Figure 17. The percent identity score takes into account this mismatch, another mismatch at position 135, and the two gaps mentioned above. Calculation of the identity score is described in detail in the percent identity section.
Note that the left bar in Figure 17 lists alignments between the human protein and chimp genome in 8 blocks labeled as block 1—block 8. This indicates that there are possibly eight exons in the chimp OTC gene represented in this alignment. The query protein in this protocol is the protein encoded by the mRNA, NM_000531.5, used in Protocol 1. The results of Protocol 1 showed that there are ten exons in the query mRNA. Either the chimp gene lacks the two exons; those two exons may be in the untranslated region; or they may be in the not yet sequenced region in the chimp genome Oct 2010 assembly.
-
10
Click on the “together” link in the left bar (or scroll the page further) in Figure 17.
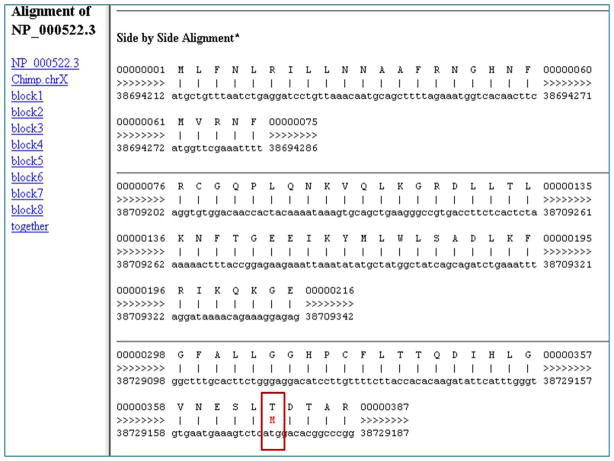
Figure 18 shows the side-by-side alignment of the human protein query and the chimp chromosome X sequences. As described for Protocol 2, the top row in each section represents the amino acid sequence of the query (the human OTC protein), and the bottom row represents the matching chimp chromosome 11 sequence found by BLAT. The numbering for the top row is based on the corresponding nucleotides even though the visible sequence is amino acids. The first block shows first 25 amino acids of the query (numbered as 1 to 75 in nucleotides in the top lines) aligning to the nucleotides 3869412 to 38694286 (coordinates on the bottom lines). The gene is placed on the forward strand indicated by the “≫>“ symbols between the query and genome coordinates. Thus, the chimp OTC gene is present on the forward strand of chromosome X, and the coding exon, corresponding to the first 25 amino acids in the human OTC protein, is between nucleotides 3869412 to 38694286 in the Oct 2010 (CGSC 2.1.3 panTro3) chimp genome assembly. Locations of other exons found by BLAT can be obtained in a similar manner.
As previously noted in Figure 17, there is a mismatch between the human OTC protein at amino acid 125 and (the translation of) the chimp chromosome 11. Since the alignment numbering in this figure is in nucleotides, this mismatch would be around 375 in the top line representing the query. This region is highlighted by a red rectangle in Figure 18 in the third block of the alignment. The human protein has threonine at this position; however, a red M (Figure 18) between the two sequences indicates that the chimp gene codes for a methionine at this position. In fact, the human SNP rs72554356 that causes the change in the amino acid from threonine to menthionine at the 125th position of the human protein is reported to be associated with ornithine hyperammonemia disease.
This protocol demonstrates the use of BLAT to find homologs in other terrestrial vertebrate species using a protein sequence. We not only identified the chimp genomic sequence for the human OTC protein, but further showed that the 125th amino acid in the human OTC protein is threonine, and the corresponding amino acid in the chimp protein is methionine, an amino acid change in human causing a disease phenotype.
Note that BLAT was originally designed and optimized for mapping sequences within a single species or similar species (Kent, 2002). It is not ideal for finding distant homologs, particularly when using nucleotide sequences (Kent, 2002; Yavatkar et al., 2008). BLAT is optimized for alignments to closely matched genomic sequences (95% identity or higher) and amino acid sequences with 80% identity or higher. For remote matches, BLAST is more suitable as described below (Altschul, 1990).
Figure 17.
Detailed alignment information for the first match of the query protein and the chimp genome sequences in Protocol 3. The top section of the details page shows, in capital blue letters, the portion of the queried human protein that matched the chimp genome. Below that is shown the section for the chimp chromosome X sequence, again showing the aligning sequence in capital blue letters. The lowercase black letters indicate regions which are not aligned. The red arrow points to the amino acid threonine, shown in a lowercase black letter t, at the 125th position of the query NP_000531.1indicating a mismatch at that position with respect to the (translation of the) genome sequence. Refer to the legend for Figures 3 and 4 and to the text for additional information on the content of the display.
Figure 18.
Detailed side-by-side alignment information for a portion of the first match of the query protein and chimp genome sequences in Protocol 3. Exact matches between the query and genome sequences are shown by a vertical line. Mismatches are shown by the letter code for the amino acid encoded by the aligned genomic sequence. To illustrate, the mismatch between the 125th amino acid threonine in the human query protein and methionine encoded by the chimp genome at the corresponding position is highlighted by a red rectangle. Refer to the legend for Figure 10 and the text for additional information on the content of the display.
Commentary
Background Information
BLAT details
In the previous century, a common exercise for elementary school students was a contest to see who could find words in a dictionary quickly. Computers are very efficient at this exercise, and it is an integral part of the approach BLAT takes to sequence alignment. In the case of BLAT, the dictionary is usually an indexed genome sequence, where the index is a list of non-overlapping subsequences, 11 bases long (Kent, 2002). Such a subsequence is called an 11-mer. More generally, a K-mer defines a subsequence K bases long.
Search phase
When one enters a nucleic acid sequence into the web version of BLAT (http://genome.ucsc.edu/cgi-bin/hgBlat), the program looks up every overlapping 11-mer in the query sequence in the database index of non-overlapping 11-mers. In this phase, nucleotide BLAT uses a “two perfect 11-mer match criteria” within 300 nucleotides (bases), and web BLAT uses three perfect 4-mer matches within 100 amino acids for the protein queries (Kent, 2002). BLAT then checks for hits within 300 nucleotides (bases) or 100 amino acids of each other in the database index. These near neighbors are merged together (Kent, 2002), and an additional 500 bases are added to each side to give a homologous region as a product of the search phase. In this way, regions most likely to align are found, but the conservative match criteria may miss some of the alignments. For this reason a more detailed alignment phase follows.
Alignment phase
The next phase, the alignment phase, involves detailed alignments between the query sequence and the homologous regions. As in the search phase, it begins with looking up subsequences of the query sequence. However, the target is now the homologous region instead of the genome. Since the homologous regions are much smaller than the genome, looking up K-mers of the query sequence in these regions requires considerably smaller computer resources. For this reason, smaller K-mers can be used which are more likely to align to the region. For nucleic acid sequences, these matches then undergo various types of extensions, beginning with the simplest extension of finding exact matches and, if necessary, continuing with extensions that allow gaps, extensions through bases coded with “N’s” (where N represents any nucleotide), and extensions which allow insertions and deletions. When large gaps are found, an effort is made to define intron-like boundaries by checking for GT/AG exon-intron splicing site consensus at the ends (Kent, 2002).
BLAT protein sequence alignments use a different algorithm for the extension function of the alignment phase. It is a combination of a graphical and dynamic programming approach. The graph depicts locations of matching subsequences on both the query and the homologous region. The dynamic programming algorithm then finds the best path through the matches to define the detailed alignment with the maximal score. In general, in comparing nucleic acid and amino acid alignments, the number of alignments found is several orders of magnitude higher when working with amino acid residues than with nucleic acid bases (Kent, 2002).
Stitching and filling in the alignments
For genes/mRNAs that match to multiple homologous regions, a similar graph can be created and dynamic programming algorithm applied to stitch the matches together. For any remaining gaps, the nucleotide alignment algorithm is applied to fill in additional sequence matches to look for small internal exons.
Score calculation
The BLAT score s (http://genome.ucsc.edu/FAQ/FAQblat.html#blat4) is the number of matches m with a penalty for mismatches m′ and gaps, both in the query (gq) and the homologous genome region (gt):
where y is 1 for nucleic acid alignments and 3 for proteins. f(r) is related to the parameter “rep. match” which determines the number of multiple matches allowed for the K-mer before it is marked as overused.
For example, for Protocol 3, choosing the psl output option before running the search and keeping the default sorting option “query, score”, we get the following values from the first row of the results table:
y = 3, as defined above.
m = 284 from the psl column labeled “match”.
f(r) = 0 from the psl column “rep. match”.
m′ = 2 from the psl column “mismatch”.
gq = 2 from the psl column “Q gap count”.
gt = 7 from the psl column “T gap count”.
s = 3 × 284 − 3 × 2 − 2 − 7 = 837.
The result can be checked by comparison with the hyperlink format output in Figure 16.
Percent identity calculation
BLAT also provides a percent identity score, p, to indicate differences between sequences preventing a perfect match of 100% (http://genome.ucsc.edu/FAQ/FAQblat.html#blat4). The differences include mismatches and gaps. The score also includes a term for large inserts: for example when aligning a transcript to the genome, inserts for introns would be necessary.
where
d = 1000(ym′ + gq + round(3log(1 + z)))/t.
As defined in the algorithm, y is 1 for nucleic acid alignments and 3 for proteins; m′ is the number of mismatches; g is the number of inserts; z is set to zero unless the breadth zq of the query alignment is larger than the breadth zt of the target (genome) alignment; and t is the total size of the alignment.
where
zq = eq − bq
and
zt = et − bt
Here, bq is the starting coordinate of the query alignment; eq is the end coordinate of the query alignment; bt is the start coordinate of the target (genome) alignment; and et is the end coordinate of the target (genome) alignment.
If z < 0, z = 0.
where r is the number of matching bases which are part of repeats.
For example, for Protocol 3 with the psl output type chosen and keeping the default sorting option, “query,score”, we get the following values from the first row of the results table.
y = 3, as defined above.
m = 284 from the psl column “match”.
r = 0 from the psl column “rep. match”.
m′ = 2 from the psl column “mismatch” which allows the calculation of t:
t = 3(284 + 0 +2) = 858.
eq = 354 from the psl column “Q end”.
bq = 0 from the psl column “Q start”, yielding
zq = 354 − 0 = 354.
et = 38778403 from the psl column “T end”.
bt = 38694211 from the psl column “T start”, yielding
zt = 38778403 − 38694211 = 84192.
This yields z = 354 − 84192 = −83838. If z is less than zero, the algorithm sets z = 0.
gq = 2 from the psl column “Q gap count”, yielding (rounding to one decimal place)
d = 1000(3 × 2 + 2 + 0)/858 = 9.3;
and
p = 100 − 0.1 × 9.3 = 99.1.
The result can be checked by comparison with the hyperlink format output column IDENTITY in Figure 16.
Different output types
Comparing the output options, psl and hyperlink, available on the web, the “hyperlink” output type is useful for looking at the alignment in the browser (“browser” link) and for looking at the details of the alignment (“details” link). It also provides a score and a percent identity. As seen above, the PSL output provides details about mismatches, gaps, and blocks. The blocks usually refer to the exon structure. Details about how the bases are numbered in the PSL output are given in the “Troubleshooting” section below. Alignments in the PSL format can also be uploaded as custom tracks in the UCSC Genome Browser (see http://genome.ucsc.edu/goldenPath/help/customTrack.html and http://genome.ucsc.edu/FAQ/FAQformat.html#format2 for more information). For example, Figure 19 shows the custom track added using the psl output type in Protocol 1. (Use the provided file protocol_1_psl.xlsx which contains results of Protocol 1 in the PSL format; copy the first line below the header; paste it in http://genome.ucsc.edu/cgi-bin/hgCustom?clade=mammal&org=Human&db=hg19; click on the submit button; and then click on the “go to the genome browser” button.) Custom tracks are useful for researchers to add their own data to the browser and derive biological information from the aligned data available in the different tracks of the browser.
Figure 19.

Results of the first match of Protocol 1 displayed as a custom track in the UCSC Genome Browser. The track is labeled “User Supplied Track”. Instructions to generate a custom track using the PSL output format are described in the text.
Stand-alone BLAT
Some of the limitations of web BLAT mentioned above can be overcome by using stand-alone BLAT which allows users to calculate sequence alignments in a batch mode. The stand-alone version of BLAT runs more efficiently, because it can keep the genome in memory. It also uses a more sensitive protein alignment setting, because it can easily handle the increased number of false positives. Conversely, the web version of BLAT would have to load a portion of the genome from the disk for each false positive (Kent, 2002). Another advantage of the stand-alone version is that it allows the user to set parameters or options.
The -fastmap option is particularly useful for very large query sequences. Another example is the -out parameter. It is useful for additional output formats such as the BLAST output or wublast output. The following output options are available:
psl - default, tab separated format with no sequence
pslx - tab separated format with sequence
axt - blastz-associated axt format
maf - multiz-associated maf format
sim4 - similar to sim4 format
wublast - similar to wublast format
blast - similar to NCBI blast format
blast8- NCBI blast tabular format
blast9 - NCBI blast tabular format with comments
Finally, the parameter -fine is useful for high quality mRNA queries to look in detail for small initial and terminal exons. This parameter is not recommended for ESTs.
Additional parameters are available at http://genome.ucsc.edu/goldenPath/help/blatSpec.html.
Comparison with BLAST
BLAT (BLAST-like Alignment Tool) and BLAST (basic local alignment tool; UNIT 3.3) are both local alignment tools (Kent, 2002; Altschul, 1990). A major focus of BLAT is locating a sequence on its genome. Therefore, the assumption is that the query sequences will have high similarity to the genome sequence database. In this case, high similarity is 95% identity or higher for nucleotide sequence searches and 80% or higher for amino acid sequence searches. The focus of BLAST is general local alignments both to genomes and a variety of other databases: nucleotide, reference RNA, expressed sequence tags, patented sequences, proteins, human alu repeat elements, and sequence tagged sites. It is appropriate for finding both similar and remote matches.
Both tools use the local alignment approach of indexing sequences for finding very short high scoring alignments and extending these alignments until no further improvement in score is found (Altschul, 1990, Kent, 2002). BLAT indexes the genome database. Initially, BLAST indexed the query sequences; however, it now indexes the following databases for use with the MegaBLAST module of BLAST: human genomic + transcript, mouse genomic + transcript, human genome, and mouse genome (Morgulis, 2008). Indexing the genome database yields much faster alignments in most situations (Morgulis, 2008).
The query format must be FASTA in BLAT, but BLAST accepts both FASTA and accession numbers. BLAT recommends a DNA query sequence of at least 40 nucleotides. For BLAST nucleotide sequence similarity searches, the recommendation is 20 (blastn) or 28 (megablast) nucleotides and above. If the user submits a shorter query to BLAST (7 – 20 bp), the web application automatically changes the parameters to those appropriate for short nucleotide query sequences. For protein query sequence lengths, BLAT recommends a lower limit of 20. The BLAST recommendation for protein similarity searches is a sequence length of at least 15 residues. For queries of 5 – 15 amino acids, the BLAST web application will automatically change the parameters to be more appropriate for short protein sequence input.
The tools also differ in the presentation of search results. BLAST provides a statistical significance of matches in addition to a score and identity. BLAT provides only a score and identity; the assumption is that the sequences are already highly similar. By default, BLAST shows the side-by-side alignment details, whereas BLAT provides a table of locations on the genome. Both types of information are available in both tools via different links. The details link in the BLAT table leads to the side-by-side alignments, and the Download link in the BLAST results, from the indexed genome databases mentioned above, provides locations on the contig sequences. To find the chromosome locations with BLAST (via the Download link of the results page), the chromosome database [NCBI Genomes (chromosome)] should be used. However, this database is not indexed. Thus, for the common task of finding chromosomal coordinates for a list of gene sequences, BLAT is much more efficient.
Importantly, for an mRNA query, BLAT finds exon-intron boundaries for the aligned regions (which are often exons) and joins them together to provide a model of the gene. In the PSL output format, BLAT provides details of the gene model in a single row with a list of mRNA-DNA alignments as blocks representing exons.
Troubleshooting
-
Discrepancy in the start position in the PSL and hyperlink outputs: As mentioned above, the web version of BLAT (http://genome.ucsc.edu/cgi-bin/hgBlat) provides a choice of outputs: hyperlink or psl. The output in PSL format is useful for generating custom tracks in the UCSC Genome Browser. As described above, custom tracks are useful for adding researchers’ own data to the browser and deriving meaningful biological information from the aligned data available in the different tracks of the browser. Careful examination of the hyperlink and PSL outputs shows that the start position for the genome coordinate in the PSL output is less by one base than the start position in the hyperlink output, even though the end positions are the same. Compare Figure 16 (Protocol 3 hyperlink output) and file protocol_3_psl.xlsx (Protocol 3 psl output) provided in the Supplementary materials. In Figure 16, the chromosome X start position is 38694212 (START column next to the STRAND column), and in the file protocol_3_psl.xlsx, it is 38694211 (T start column). In both Figure 16 and file protocol_3_psl.xlsx, the chromosome X end position is 38778403 (END column next to the STRAND column and T end column, respectively). This discrepancy is best understood from a description of the difference in numbering the start and end positions of the sequence in the hyperlink and PSL outputs and in the database itself.
The PSL output directly reflects the database. The database stores the start coordinate using a 0-based coordinate system and the end coordinate using a 1-based system. In the 0-based system, the first base in a sequence is labeled 0, the second 1, and the last n-1 where n is the total number of bases in the sequence. In the 1-based coordinate system, the more familiar way of counting, the first base is number 1, the second base is number 2 and the last base is number n, where n is the total number of bases. The style to number the starting coordinate using a 0-based system and ending coordinate using a 1-based system is computer friendly. Calculating the length of the sequence is easy: it is the difference in the end and start coordinates. If the 1-based system is used for both the start and end, the computer must use the additional operation of adding one to the difference to get the length of the sequence. The hyperlink output uses the 1-based system for both the start and the end coordinates. In this output, the computer program adds a one to the start coordinate from the database before it produces the output. Additionally, BLAT users who select the PSL output option should note that the negative strand in PSL coordinates is in the frame of reference of a query matching the forward strand, except in the qStarts column, where the coordinates are reversed. More information about the PSL format is available at http://genome.ucsc.edu/goldenPath/help/hgTracksHelp.html#PSL.
Error when the accession number is included in the search box: BLAST users, who are accustomed to entering sequence identifiers into the alignment tool search box, should note that BLAT requires the FASTA sequence as input.
Some other sequence similarity search tools
EvoPrinterHD: http://evoprinter.ninds.nih.gov/evoprintprogramHD/evphd.html is an online tool for finding more distant homologs. It uses a modified version of BLAT called enhanced-BLAT (eBLAT) (Yavatkar, et al., 2008).
FASTA: http://fasta.bioch.virginia.edu/fasta_www2/fasta_list2.shtml is a local and recently added global alignment program for protein and/or nucleotide sequences.
SIBsim4: http://sibsim4.sourceforge.net/ aligns expressed sequences (EST, cDNA, mRNA) to genomic sequences and finds splices sites, poly A sites, and chimeras. This program is based on sim4 http://globin.cse.psu.edu/html/docs/sim4.html.
SSAHA: http://www.sanger.ac.uk/resources/software/ssaha/ is a very fast program suitable for highly similar sequences, hence, for sequence assembly or SNP detection.
Acknowledgments
The authors are grateful to Doug Joubert of the NIH Library and Wayne Matten of the National Center for Biotechnology Information (NCBI) for their careful reading of the manuscript and helpful suggestions.
Footnotes
Informationist/Bioinformatics Specialist, National Institutes of Health Library, National Institutes of Health, Office of Research Services, Building 10, Room 1L13F, 10 Center Drive, Bethesda, Maryland 20892-1150, T. 301-496-2185, F. 301-402-0254, bhagwat@mail.nih.gov, http://nihlibrary.nih.gov, http://nihlibrary.nih.gov/bioinformatics
Internet resources
http://genome.ucsc.edu/goldenPath/help/hgTracksHelp.html#BLATAlign
UCSC online documentation for BLAThttp://genome.ucsc.edu/goldenPath/help/blatSpec.html
BLAT program specifications and user guidehttp://genome.ucsc.edu/FAQ/FAQblat.html
FAQ about BLAThttp://www.genome.gov/EdKit/pdfs/glossary_final-linked.pdf
A glossary of useful terms for understanding genomic researchhttp://blast.ncbi.nlm.nih.gov/Blast.cgi BLAST web site
Literature Cited
- Altschul SF, Gish W, Miller W, Myers EW, Lipman DJ. Basic local alignment search tool. Journal of Molecular Biology. 1990;215:403–410. doi: 10.1016/S0022-2836(05)80360-2. [DOI] [PubMed] [Google Scholar]
- Bina M. Identification and mapping of paralogous genes on a known genomic DNA sequence. In: Bina M, editor. Methods in Molecular Biology, Vol. 338: Gene Mapping, Discovery, and Expression. Humana Press; Totowa, NJ: 2006. pp. 21–29. [DOI] [PubMed] [Google Scholar]
- Harper C, Huang C, Stryke D, Kawamoto M, Ferrin T, Babbitt P. Comparison of methods for genomic localization of gene trap sequences. BMC Genomics. 2006;7:236. doi: 10.1186/1471-2164-7-236. [DOI] [PMC free article] [PubMed] [Google Scholar]
- Karolchik D, Hinrichs AS, Kent WJ. The UCSC Genome Browser. Curr Protoc Bioinformatics. 2009;Chapter 1(Unit 1.4) doi: 10.1002/0471250953.bi0104s17. [DOI] [PubMed] [Google Scholar]
- Kent WJ. BLAT -- The BLAST-like alignment tool. Genome Research. 2002;12:656–664. doi: 10.1101/gr.229202. The original article by the author of BLAT discusses the rationale and algorithms used in its development. [DOI] [PMC free article] [PubMed] [Google Scholar]
- Morgulis A, Coulouris G, Raytselis Y, Madden TL, Agarwala R, Schäffer AA. Database indexing for production MegaBLAST searches. Bioinformatics. 2008;24:1757–1764. doi: 10.1093/bioinformatics/btn322. [DOI] [PMC free article] [PubMed] [Google Scholar]
- Yavatkar A, Lin Y, Ross J, Fann Y, Brody T, Odenwald W. Rapid detection and curation of conserved DNA via enhanced-BLAT and EvoPrinterHD analysis. BMC Genomics. 2008;9:106. doi: 10.1186/1471-2164-9-106. [DOI] [PMC free article] [PubMed] [Google Scholar]


