

Abstract
The use of multi-scale mathematical and computational models to study complex biological processes is becoming increasingly productive. Multi-scale models span a range of spatial and/or temporal scales and can encompass multi-compartment (e.g., multi-organ) models. Modeling advances are enabling virtual experiments to explore and answer questions that are problematic to address in the wet-lab. Wet-lab experimental technologies now allow scientists to observe, measure, record, and analyze experiments focusing on different system aspects at a variety of biological scales. We need the technical ability to mirror that same flexibility in virtual experiments using multi-scale models. Here we present a new approach, tuneable resolution, which can begin providing that flexibility. Tuneable resolution involves fine- or coarse-graining existing multi-scale models at the user's discretion, allowing adjustment of the level of resolution specific to a question, an experiment, or a scale of interest. Tuneable resolution expands options for revising and validating mechanistic multi-scale models, can extend the longevity of multi-scale models, and may increase computational efficiency. The tuneable resolution approach can be applied to many model types, including differential equation, agent-based, and hybrid models. We demonstrate our tuneable resolution ideas with examples relevant to infectious disease modeling, illustrating key principles at work. WIREs Syst Biol Med 2014, 6:225–245. doi:10.1002/wsbm.1270
How to cite this article: WIREs Syst Biol Med 2014, 6:289–309. doi:10.1002/wsbm.1270
INTRODUCTION
Continued advances in biomedical science will require more explanatory mathematical and computational models.1–9 Increasingly these models are multi-scale, encompassing processes operating at a range of temporal and spatial scales and perhaps also between multiple compartments (e.g., organs). The key goal of multi-scale modeling in medically focused systems biology is the generation of models that can be used to better understand hypothesized mechanisms, make predictions, interpret data, suggest new approaches for therapy, and offer new explanations for observed phenomena.
Advances in multi-scale modeling are enabling virtual experiments to answer questions that can be problematic to address in a wet-lab.10–15 In wet-lab experiments, advances in technology now allow scientists the flexibility to observe, measure, record, and analyze experiments at a variety of scales. We need the same capability in our virtual experiments (Figure 1). While virtual experiments cannot replace experimentation on living systems, they can be used to create new knowledge and improve explanatory insight. To do so, we develop, explore, and challenge alternative, plausible mechanistic scenarios, including hypotheses within and across scales. As progress is made, we can increase the synergy between virtual and wet-lab experiments. Such synergy is expected to be most productive as our multi-scale models become increasingly analogous to their animal model and human counterparts at multiple scales, under an expanding variety of intervention scenarios.
Figure 1.
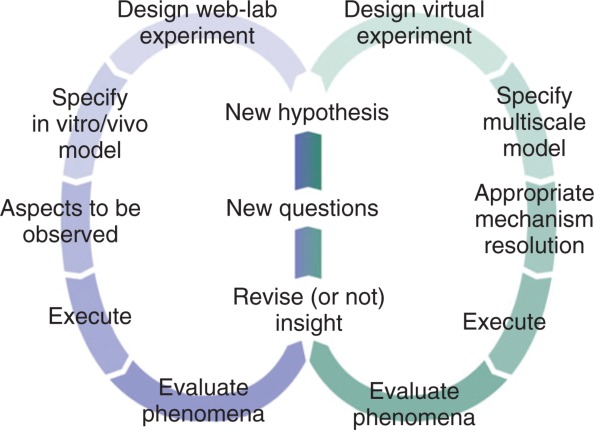
Coupled use of wet-lab and virtual experiments. Left side: Scientific flow of wet-lab experiments from design through interpretation. Right side: Scientific flow of virtual experiments from design through interpretation. Two cycles intersect to generate hypotheses to pose and address new questions. Iteration is a key component of this process and involves multiple cycles on either or both sides.
One strategy to achieving such flexibility and increasing the useability of multi-scale models is an approach we term tuneable resolution. Tuneable resolution proposes that multi-scale models should be built with multiple levels of resolution, so that a fine-grained or coarse-grained version can be employed with user discretion, allowing adjustment of the level(s) of resolution specific to a question, an experiment, a particular use, or a change in perspective or scale of interest. In addition to providing this flexibility of level of resolution, we argue that a tuneable resolution approach expands options for revising and validating models and increases model usability and portability.
We describe our tuneable resolution approach starting with arguments for, and evolving principles guiding, its use. We then demonstrate resolution tuning in models of the immune response to infection with Mycobacterium tuberculosis, the pathogen that causes tuberculosis (TB) (Examples 1–3). Despite many different and insightful experimental approaches taken over the years, fundamental questions remain about TB. In the TB context, virtual experiments provide means and strategies for generating and testing hypotheses about the disease, its mechanisms, and potential treatments.16
THE ARGUMENT FOR TUNEABLE RESOLUTION
Tuneable Resolution Provides Flexibility Required to Span Varying Aspects and Scales of Interest
Experiments on living systems often focus on a single aspect (or feature) and a single scale. Multiple types of experiments allow access to information at different scales. For example, images of diseased lungs provide information about the spread of TB, whereas immune responses developing in draining lymph nodes (LNs) determine how well infection can be controlled. We need the flexibility and technical ability to change an aspect of a multi-scale model on which a new virtual experiment focuses and, when needed, the observation interval and frequency (Figure 2). We also need to retain essential knowledge when the aspect of interest changes, e.g., from signaling networks within an immune cell to immune cells interacting with each other. Models built with tuneable resolution can achieve this.
Figure 2.
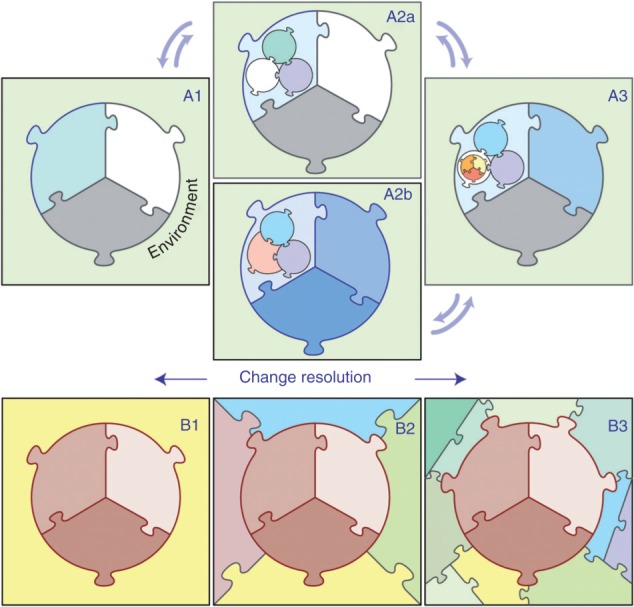
Tuneable resolution approach. Top: An initial model (shown as 3 puzzle pieces) functions within an environment (A1). Fine-graining a portion of the initial model to generate A2a, and subsequently a portion of that latter model to generate A3, adds additional scales of relevance. Progression from A3 to A2b demonstrates re-engineering of the previous scale model (A2a) to reflect knowledge gained at A3. Bottom: An initial model is refined to include additional scales of interest in the environment as model development progresses from B1 through B3. Depending on the question or aspect, the user choses the appropriate level of resolution.
Tuneable Resolution Enables More Comprehensive Model Validation
We can improve both explanatory and predictive usefulness by improving phenotypic overlap between phenomena generated by multi-scale models and their real world counterparts. To do so we must increase the variety of ways that results from virtual experiments can either be validated against corresponding wet-lab experiments or be objectively compared to available knowledge. We improve the scientific usefulness of multi-scale models by building trust into simulated mechanisms using a tuneable resolution approach and multiple validation targets. Trust increases in two ways: improving in silico-to-wet-lab similarities and identifying when, why, and where dissimilarities occur. We provide examples supporting our case that both activities require a tuneable resolution approach.
Fine-Graining May Present Strategies for Re-engineering to Obtain an Improved Coarse-grained Model
There are many computational and mathematical considerations that emphasize caution when adding fine-grain information to multi-scale models. A tuneable resolution approach argues not only for gradually and systematically building in additional detail into a model (as warranted by available data and questions being asked) but also for informing the formulation of a more biologically accurate coarse-grained version by using information from the fine-grained model. For example, an original coarse-grained model is developed and, because of further biological questions or additional validation targets, a finer-grained version is created (Figure 2, A1 -> A2a -> A3; Figure 2, B1 -> B2 -> B3). Once those questions are answered, the user wishes to return to a simpler representation but that preserves the biological integrity of the system (although not necessarily the mathematical integrity): a tuneable resolution approach provides a coarse-grained model that has been improved by insights gained during virtual experiments on the fine-grained model. This process helps one discover what mechanisms must appear in the model, and at what level of detail, to explain corresponding biological data (Figure 2, A3 -> A2b). Put another way, the re-engineered coarse-grained model can be thought of as a ‘model of a model’, i.e., a version that retains some, but not all, finer-grained model behaviors.
Tuneable Resolution Can Help Identify Model Flaws
Models are perpetual works in progress. New insights, from either virtual or wet-lab experiments, can falsify one or more mechanistic model features, requiring model revision. The multiple perspectives offered by models capable of tuneable resolution may reduce bias and enable identifying the location of a model flaw, and thus can reduce reengineering required to produce and validate resulting revised and improved models.
Tuneable Resolution May Help Identify the Scale Location of a ‘Tipping Point’
An overarching goal for biomedical research is discovery of new intervention strategies that improve health outcomes. For TB, diabetes, cardiovascular diseases, and others that are still shrouded in considerable uncertainty, the scale location of the tipping point for a therapeutic intervention under study can be unknown and may even vary between individuals. For example, should a therapy target a specific receptor–ligand interaction in a specific biological organ, the expansion of a class of T cells, or are both required but following a coordinated strategy? We envision that virtual experiments using tuneable resolution provide new options for expediting and narrowing the search. This would arise, e.g., when creating a new coarse-grained sub-model to replace a fine-grained sub-model (Figure 2). Key model mechanisms that are required to preserve the behavior obtained with the fine-grained are likely tipping points for the combined multi-scale model behavior. In a nonlinear ordinary differential equation (ODE) system, e.g., those necessary preserved behaviors may identify bifurcation parameters that are targets for therapeutic interventions.
Tuneable Resolution Approaches Can Increase Computational Speed, Model Usefulness, and Portability
Most multi-scale models grow in complexity and scope as researchers add mechanisms and detail to improve agreement and usefulness in interpreting experimental data. Consequently, the model can become increasingly difficult to work with—more difficult to debug, to port to other platforms and other users—and the results of virtual experiments may become more difficult to interpret. Simulations may require significantly longer runtimes. Indeed, some models essentially ‘die’ under their own weight, becoming too complex to be passed on to the next user. Tuneable resolution approaches, particularly those emphasizing modularity, model linking, and re-engineering of coarse-grained model versions, can assist in avoiding or reducing these problems.
EVOLVING PRINCIPLES FOR BUILDING TUNEABLE RESOLUTION MODELS
Resolution Tuning Requires Coupled Use of Coarse- and Fine-Graining Methods
Our model development typically proceeds by first including well-studied and characterized processes known to have major or first-order effects on system behavior. Given specific questions to be addressed in virtual experiments, some biological processes may not require great detail in their description, and so can be represented in a coarse-grained fashion, e.g., using a parameter or a simple phenomenological expression. New biological questions or data might later require virtual experiments that have a new focus and new multi-scale model uses, and that, in turn, may require increased model resolution, or fine-graining, e.g., replacing the parameter or simple phenomenological expression with a sub-model that simulates relevant biological processes in greater detail. Adding information from multiple length and time scales, while important for simulating phenomena, significantly increases the complexity of analyses and execution time. Thus it is important to be able to selectively (and possibly automatically) coarse-grain model components and/or features when needed. Coarse-graining can be achieved by replacing a sub-model consisting of several biologically based equations or rules with wisely chosen phenomenological expressions (e.g., a parameter, a function, or a simplified model). These choices may be guided by temporal considerations (e.g., pseudo steady-state assumption), by validation targets, and/or by information obtained during building and execution of the fine-grained model. Note that there is no single method for coarse- or fine-graining, and strategies vary by field. Various model structures will require different methods and a review of these methods is beyond the scope of this article.
Tuneable Resolution Can Be Used with Different Multi-Scale Model Constructs
Multi-scale models with similar uses can have different constructs, including ODE, partial differential equation (PDE), stochastic, object- and agent-based, and hybrid (i.e., models combining different constructs).17–26 Consequently there is no single strategy for achieving tuneable resolution. Regardless of construct type, it is important to have the ability to shift the aspect and/or scale of focus at will. In Examples 1 and 2, we demonstrate tuneable resolution using hybrid models that combine nonlinear systems of ODEs as sub-models that fine-grain mechanisms of an agent-based model (ABM). In addition, organ compartments of interest can be represented using either coarse- or fine-grained versions as appropriate for the particular virtual experiment (Example 3).
Model Linking Is Central to Tuneable Resolution
Resolution tuning and established multi-resolution modeling methods face several similar technical, implementation, computational, and mathematical issues. Interfacing or linking independent model components that operate at different temporal or spatial granularities is a prominent example.27–29 Interfacing or linking independent model components that use different modes of computation (e.g., agent-based and continuous mathematics) is another. Adjusting the resolution in a model requires explicit consideration of model linking issues. There are no standard linking methods. Although details are beyond the scope of this communication, we note that several groups are developing frameworks to modularize models to improve model linking with an eye toward efficient modeling.7–9,30–38 For example, the multi-scale modeling platforms CompuCell 3D (www.compucell3d.org), Simmune, and Virtual Cell (http://www.ibiblio.org/virtualcell/) all provide approaches for model linking.39–41
Modularity Becomes Necessary, Even Essential
Another impediment in the quest for improved multi-scale models is that they can become so complicated that scientific utility is jeopardized. The cost to copy, verify, and maintain their operation can be prohibitive. In addition, considerable specialized expertise and training is needed to conduct virtual experiments using current multi-scale models. Finally, the barrier to independent virtual experiment replication (as distinct from repetition) becomes too great.42–47 Our experience is that because model variants identified during virtual experiments employing tuneable resolution are somewhat specialized, they can be easier to share and have shorter learning curves. There is value to moving in the direction of multi-scale models designed intentionally to be modular at all scales, where module variants having the same biological counterpart but different mechanistic granularities can be exchanged with biomimetic fidelity and confidence both within and between experiments. As these modules become more long-lived, our expectation is that it will become increasingly easy to replicate virtual experiments (a standard in science), and that barriers to more widespread use of virtual experiments will be lowered. Research to improve model modularity is an actively expanding activity (http://www.imagwiki.nibib.nih.gov/mediawiki/index.php?title=Main_Page).
Uncertainty and Sensitivity Analyses Play Important, and Multiple, Roles in Tuneable Resolution
When data are not available to determine some model parameter values, uncertainty and sensitivity analyses can be used to investigate, narrow and define parameter spaces. Key generalized features of the process are illustrated in Figure 3. The first role for uncertainty analysis is to assess the uncertainty in model output that results from uncertainty in parameter values. Common techniques include generalized Monte Carlo methods (e.g., simple random sampling, Latin hypercube sampling).48 Sensitivity analysis is then used to quantify how parameter uncertainty impacts model outcomes and to identify critical model parameters. Common techniques include generalized correlation (e.g., partial rank correlation coefficients) and variance decomposition methods (e.g., ANOVA, fast Fourier transform).48 The second role for uncertainty and sensitivity analyses in tuneable resolution is to identify key mechanism features to guide fine-graining and sub-model development. For example, we can fine-grain a model by adding detail to processes suggested by sensitivity analysis as significant or we can coarse-grain by conflating sets of parameters that do not have a large impact on model outcome. Most sensitivity analysis techniques supply indices that are time-dependent; key regulatory mechanisms can be important only during certain—sometimes narrow—time intervals. Such time-dependency can also be exploited to guide when to change resolution in an automated fashion. For example, if sensitivity analysis suggests that a certain mechanism is only important early, then we can use the fine-grain model version early during the virtual experiment and, based on set criteria, switch to a coarse-grain version thereafter.49 That illustration highlights that tuneable resolution can be applied temporally as well as spatially. Finally, we use uncertainty and sensitivity analyses for estimating new parameter values when toggling between coarse- and fine-grained model versions (i.e., tuneable resolution) to maintain biological fidelity and model congruency with regard to key biological features (Figure 3).
Figure 3.
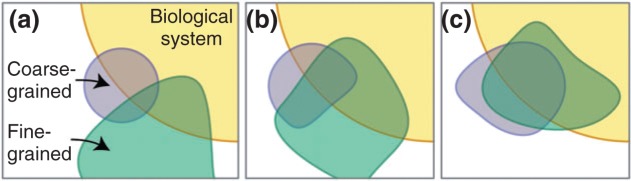
Comparing the behavior of multi-scale models (determined with virtual experiments) and the behavior of a biological system (determined with wet-lab experiments). The degree to which a model captures the biological system is represented by overlap between the model and biological system shapes (purple and yellow, or green and yellow). The degree to which the fine- and coarse-grained models predict the same behavior is represented by overlap between the purple and green shapes. In order to toggle between the two models to simulate resolution tuning, acceptable similarities (sufficient congruency) for the same set of phenomena must be observed. After initial sensitivity and uncertainty analyses, phenomena overlap between the sibling models is typically inadequate, indicating that further refinements are needed, possibly in both models, providing a degree of cross-model validation (panels a–c). Because the two model versions are not the same, we should not expect complete overlap across their full range of realizations. Hayenga et al.106 provide an instructive demonstration of achieving congruency between an agent-based and a continuum-based biomechanical model.
Tuneable Resolution Is Distinguishable from Multi-Resolution Modeling
Multi-resolution modeling refers to building a single model, a family of models, or both to describe the same phenomena at different levels of resolution, across multiple scales. Multi-resolution modeling has a rich history in other domains, most notably conflict and combat modeling50–54 and ecology.55–58 However, two important characteristics distinguish many of those models from the tuneable resolution approach described here. First, multi-resolution modeling efforts typically adopt a reductionist, bottom-up approach, assuming that knowledge, measurements, and data are available to achieve an acceptable degree of biological validation at the finest grain (Figure 4, right side)59,60; modeling typically begins with mathematical descriptions of multi-level mechanisms that are physics-based. Yet, for TB and many other medical fields, the fine grain, explanatory, mechanistic knowledge needed to build a classical multi-resolution model is still not available, placing us toward the aqua area of Figure 4. In fact, a primary goal in our research has been to use virtual experiments to facilitate acquiring this knowledge. We have begun with rather coarse-grained models, refining them to generate biomimetic phenomena, and then focused ‘downward’ to discover plausible, finer-grained mechanistic generators to improve insight into the mechanisms operating at the level above. This process is what Brenner and Noble describe as the ‘middle out’ approach.61
Figure 4.
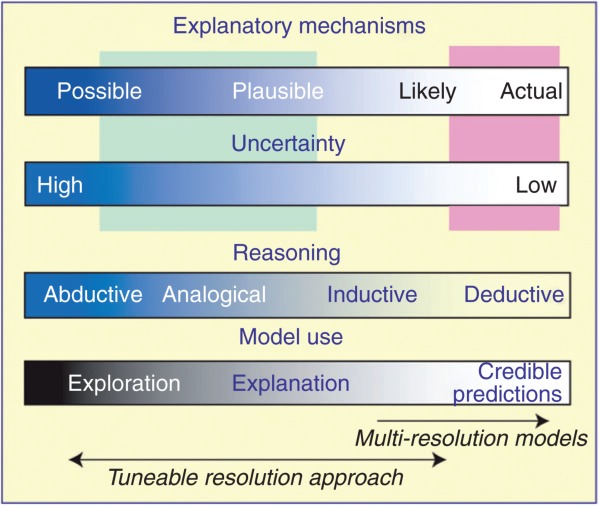
These four spectra inform modeling approaches, characterize how multi-scale models can be used within the larger biomedical context, and help distinguish our tuneable resolution approach from multi-resolution modeling. Locations on the top two spectra characterize the current state of knowledge about biological systems and phenomena of interest. For immune responses to tuberculosis (TB) and other diseases, the locations selected typically fall within the aqua box. The pink area characterizes systems for which trusted, fine-grained explanatory mechanisms are available at the highest level of resolution needed.
Second, a key use for multi-resolution modeling is generating fast and accurate predictions, and the focus is on inductive and deductive reasoning. Our interest is different: models and methods were needed to enable mechanistic exploration and subsequent development of improved explanations of phenomena7,62–64 including improved phenotype overlap (Figure 3). Improving insight requires shifting the aspect of focus of new virtual experiments, i.e., resolution tuning, in ways not easily anticipated. Those activities require expanding the range of reasoning methods used to include analogical65 and abductive reasoning.7,63,64 (Figure 4).
Model Reduction Is Distinguishable from Tuneable Resolution
Model reduction is an approach that has been used for coarse-graining models. Although some theoretical and ad-hoc methods have been used to reduce differential equation models,66–68 there is no standard method yet available, particularly when dealing with multi-scale or multiple linked models of different types (e.g., hybrid models). Model reduction is guided primarily by mathematical considerations (e.g., singular perturbation analysis, nondimensionalization), while resolution tuning is guided primarily by biological considerations and questions (e.g., a need to consider as yet unexplored molecular events, or an interest in focusing on another aspect of the system). That said, model reduction and a tuneable resolution approach may in some cases lead to a similar outcome, even if motivated by very different objectives.
EXAMPLE 1: TUNEABLE RESOLUTION IMPLEMENTED FOR A KEY CYTOKINE IN A MODEL OF A LUNG GRANULOMA IN TB
The key pathologic feature of TB is the formation of granulomas, self-organizing aggregates of immune cells and M. tuberculosis within lungs (Figure 5(a)). Most granulomas are capable of containing bacterial infection, leading to (in humans) a clinically latent infection that may last for years. If, however, granulomas are impaired in function, infection can progress, granulomas enlarge, and bacteria seed new granulomas; this sequence causes progressive pathology, i.e., active TB disease. How the interplay between various biological processes results in different infection outcomes is not known, but it is clear that granulomas play a central role. Myriad host factors operating within and across length and time scales influence granuloma formation and function and thus infection outcome. Improved understanding of mechanisms responsible for granuloma dynamics is expected to lead to new therapeutic strategies. Because multi-scale models can simultaneously incorporate host–pathogen interactions occurring over molecular, cellular, and tissue scales, they are well-suited for exploration of the immune response to M. tuberculosis infection.
Figure 5.
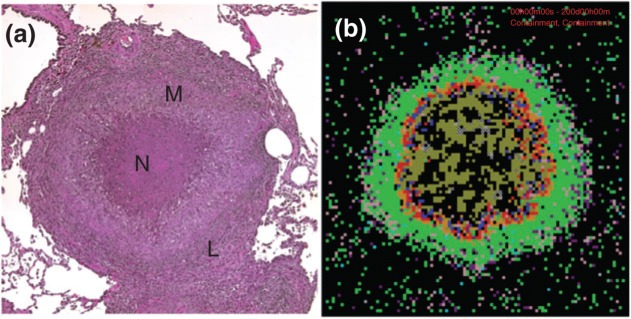
Nonhuman primate and simulated granulomas. (a) Histopathology of a granuloma in a primate infected with Mycobacterium tuberculosis at ∼30 weeks post-infection (courtesy of JoAnne Flynn, University of Pittsburgh). This typical caseous granuloma shows central necrosis (N) surrounded by macrophages (M) and an outer cuff of lymphocytes (T cells) (L). (b) Snapshot of a simulated TB granuloma at 200 days post-infection. Cell types: macrophages (resting-green, activated-blue, infected-orange, and chronically infected-red), effector lymphocytes pro-inflammatory interferon-γ (IFN-γ) producing T cells-Tγ in pink, cytotoxic T cell-Tc in purple, regulatory T cell-Treg in light blue, extracellular bacteria (olive green), vascular sources-gray, necrotic spots (x). The granuloma shown in (b) has a total bacterial load of ∼2 × 10⁵ M. tuberculosis, mostly extracellular, proliferating and located in the necrotic core.
In this example, we demonstrate tuneable resolution by introducing a multi-scale model of granuloma formation and function, fine-graining that model to include molecular-level detail, and then re-engineering the original model guided by insights ‘learned’ from experiments using the fine-grained version.
GRANSIM is our ABM describing granuloma formation and function in lungs during M. tuberculosis infection and focusing on cellular and tissue scale dynamics69,70 (Figures 5(b) and 6(a)). Immune cells (resting, infected, chronically infected, and activated macrophages; regulatory, cytotoxic, and interferon-γ (IFN-γ)-producing T cells) are represented as discrete agents. Effector molecules [such as IFN-γ and bacteria (extracellular, intracellular, and nonreplicating bacteria)] are represented using continuous variables. Each simulation follows granuloma formation and function over several hundred days, building over time to track thousands of individual cells (agents). GRANSIM (and the related models described here) were developed and achieved degrees of validation utilizing extensive data from mice and primates. Simulated granuloma features map to the wide spectrum of those observed in primates, including bacterial containment, clearance (sometimes with extensive inflammation), and dissemination.
Figure 6.

Schematic representation of the multi-scale multi-compartment model of the immune response to Mycobacterium tuberculosis infection. (a) An overview of selected agent-based model (ABM) rules of interaction between host cells, bacteria and lung environment as implemented in GRANSIM69,70 which focuses on cellular and tissue scale dynamics. (b–d) Molecular-scale tumor necrosis factor (TNF) sub-model that can be embedded at three levels of resolution [coarse (b), intermediate (c), fine (d)] in GRANSIM. The molecular-scale model for TNF (c) is described in Ref 11 and when implemented in the granuloma model is termed GRANSIMTNF (Example 1). The molecular-scale model for NF-κB (d) is described in Ref 82 and when implemented in the granuloma model is termed GRANSIMTNF-NFKB (Example 2). (e and f) The lymph node (LN) dynamics are described as in Ref 94 at two levels of resolution [coarse (e), fine (f)] (Example 3). Abbreviations: Mycobacterium tuberculosis (Mtb), macrophage (mac), antigen (Ag), chronically infected macrophage (Mci), activated macrophage (Ma), pro-inflammatory IFN-γ producing T cell (Tγ) cytotoxic T cell (Tc), regulatory T cell (Treg), TNF-α converting enzyme (TACE), TNF receptor types 1 and 2 (TNFR1, TNFR2), membrane and soluble forms of TNF (mTNF, sTNF).
GRANSIM includes only minimal information regarding an important pro-inflammatory cytokine, tumor necrosis factor-α (TNF). TNF is produced by infected and activated macrophages as a membrane-bound precursor (mTNF) that can be cleaved and released as a soluble protein (sTNF).71,72 TNF binding to membrane receptors (TNFR1 and TNFR2) affects the immune response to bacteria through several mechanisms, including activation of macrophages to more effectively kill bacteria, induction of chemokine and cytokine expression, and modulation of apoptosis.73–75 In humans and nonhuman primates, TNF neutralization leads to reactivation TB, i.e., the appearance of active disease where it was once latent, due to a failure of granulomas to control bacterial replication.76–79 Therefore, TNF availability and activities within granulomas are essential for restricting bacterial growth80 and maintaining a latent infection.
Availability of TNF within granulomas is controlled not only by the rate of TNF secretion from macrophages and TNF degradation in tissue, but also by receptor binding and trafficking (i.e., receptor internalization, degradation, recycling, and shedding) processes. Results of uncertainty and sensitivity analyses demonstrated the significance of changes in TNF availability in granuloma function during GRANSIM simulations, highlighting the likely key role of TNF-related processes in controlling actual infections. GRANSIM, however, does not include a representation of the receptor-level processes believed to control cellular responses and TNF availability. To improve insight into current theories of TNF-related mechanisms and discover new options for targeting granulomas therapeutically, we incorporated TNF-related molecular-scale details and mechanisms within GRANSIM, terming the resulting fine-grained version GRANSIMTNF. (Figure 6(c)).11,81 Molecular-scale dynamics of TNF/receptor binding and trafficking processes were represented as a sub-model with a nine nonlinear ODE system solved individually for each cell agent (i.e., macrophage or T cell), with several thousand agents per simulation. Simultaneously, the solution to the PDE describing TNF diffusion at the cellular scale on the grid is computed, thus linking soluble TNF concentrations at the cellular/tissue scales to TNF binding and trafficking events within individual cells.
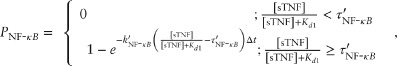
TNF activates two major signaling pathways, the caspase-mediated apoptotic and the NF-κB pathways. In GRANSIMTNF we coarse-grain both these pathways, linking the outputs solely to bound TNF receptors (see Example 2 for an option that includes detail in one of the pathways).11 TNF-induced NF-κB activation for each individual macrophage is described as a Poisson process with a probability that is a function of the NF-κB activation rate constant (kNF-κB), the concentration of TNF-bound cell surface TNFR1 complexes [C], and a threshold for those complexes (τNF-κB):
| (1) |
An NF-κB-activated macrophage secretes chemokines and TNF, and can be activated to kill bacteria. The probability of TNF-induced apoptosis for each individual cell is specified by:
| (2) |
Papopt is a function of the apoptosis rate constant (kapopt), internalized TNF-bound TNFR1 complexes [Ci], and a threshold for those complexes (τapopt). Equations 1 and 2 link TNF/receptor binding and interactions to cellular scale processes.
A key GRANSIMTNF prediction is that soluble TNF gradients form within granulomas. High concentrations of soluble TNF near the center of the granuloma give way to lower peripheral concentrations. Although the prediction cannot yet be validated against wet-lab data, the consequences are provocative. High central levels of TNF should trigger apoptosis of infected macrophages, whereas lower levels at the periphery should trigger survival pathways for T cells, which are needed to fight infection.81 Uncertainty and sensitivity analyses allowed us to identify how TNF/TNFR binding and trafficking dynamics may control the soluble TNF gradient.11 GRANSIMTNF can also be used to explore effects of potential pharmacological manipulation of TNF receptor binding and trafficking.82 For example, the TNFR1 internalization rate constant controls the spatial range of TNF action in a simulated granuloma11; TNFR1 internalization kinetics represent a tipping point identified by varying model resolution. Small internalization rates lead to a greater chance of clearance of the infection, but at the expense of excessive inflammation due to high TNF concentrations (Figure 7). Virtual experiments suggest that latent TB represents a physiological compromise that avoids more destructive outcomes.83
Figure 7.
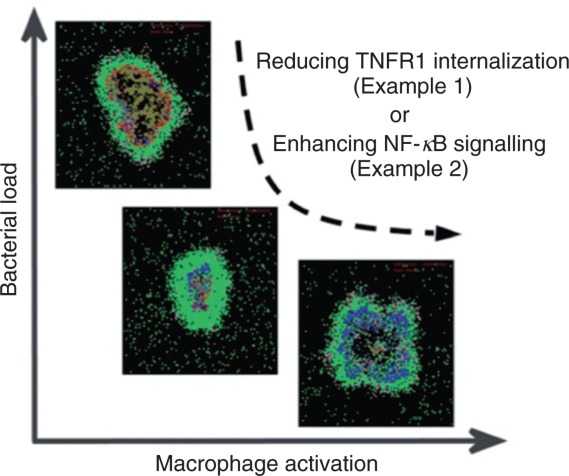
Congruent behaviors achieved from two model resolutions. The predicted roles of TNF R1 internalization and NF-κB signaling in determining granuloma outcomes are shown. Simulations with GRANSIMTNF (Example 1) show that reducing TNFR1 internalization enhances bacterial killing and increases the probability of bacterial clearance. However, the increased TNF concentrations that result give rise to excessive macrophage activation and increased tissue inflammation. Simulations with GRANSIMTNF-NFKB (Example 2) show that containment of bacteria is achieved when a balance exists between the NF-κB-mediated bacterial killing activities and the NF-κB-mediated inflammation. These levels of model resolution are well-suited to exploring potential pharmacological interventions of the signaling pathway. Snapshots of granulomas follow the same color mapping for cells as in Figure 5. The range of behaviors simulated with the two resolutions shows model congruency (see Figure 3).
The fine-graining of our base model to include TNF/TNF receptor binding and trafficking and TNF-driven cell behavior was well-motivated by a desire to understand the important roles that TNF plays in granuloma formation and function. However, when the focus of our virtual experiments shifts to a new system aspect, e.g., the role of a different cytokine or cell type, or the effect of a TNF knockout, the model may not need extensive detail regarding TNF. Yet we would like to retain what we learned during the fine-graining to create GRANSIMTNF. Thus we used a tuneable resolution approach, learning from GRANSIMTNF to re-engineer GRANSIM (Figure 6(b)), at least with respect to TNF. Because our analyses demonstrated the importance of the TNFR1 internalization to the fine-grained model outcomes, we replaced the nine ODEs describing TNF receptor binding and trafficking11 with this single ODE:
| (3) |
Equation 3 describes the change of soluble TNF concentration within an ABM compartment that contains a macrophage or T cell;  is the rate of sTNF secretion by the immune cell, and kconsumption is the apparent rate constant for sTNF consumption (i.e., by internalization). The factor
  represents the sTNF-bound fraction of TNFR1s on membranes of immune cells (assuming a pseudo steady-state). Kd1 is TNFR1 affinity for sTNF. Because the ODEs are being solved for each of the thousands of agents (cells) during simulation, replacing nine ODEs with a single ODE yields significant computational savings (simulation times, on the order of tens of minutes, are cut roughly in half). Note that because these are stochastic simulations, and because it is also necessary to run uncertainty and sensitivity analyses, thousands of simulations are required for full analysis of the model.
In addition, Eqs 1 and 2 are replaced with equations that rely on the extracellular sTNF concentration rather than bound TNFR1 receptors for probability computations:
 |
4 |
 |
5 |
where  ,
,  ,
,  , and
, and  are modified rate constants and thresholds for TNF-induced NF-κB activation and apoptosis, respectively. Because TNF-induced responses (NF-κB activation and apoptosis) in immune cells actually result from sTNF binding to TNFRs on the cell membrane, TNF concentration thresholds
  and
and  in Eqs 4 and 5 are defined based on [sTNF]/([sTNF] + Kd1). Initial estimates of the values of the new model parameters (
 , kconsumption,
  ,
,  ,
,  , and
, and  ) are based on related parameters from GRANSIMTNF. For example, knowing the rate constant for TNFR internalization and the average number of cell surface TNFRs, we estimated a suitable range of values for kconsumption to be on the order of kint 1[TNFR1], where kint1 is the TNFR1 internalization rate constant.
The resulting re-engineered GRANSIM now also predicts TNF concentration gradients within a granuloma and lower levels of macrophage activation and inflammation at the periphery of granuloma, improving similarities with experimental data. Depending on the focus of a virtual experiment, we can now toggle between GRANSIMTNF and the re-engineered GRANSIM (BOX 1), exercising resolution tuning and, in the case of GRANSIM, incorporating information regarding molecular-level TNF without the computational expense and complexity of the full model.
EXAMPLE TUNEABLE RESOLUTION ALGORITHM.
An overview of the algorithm used in simulations of the tuneable resolution multi-scale granuloma model with options for including TNF and NF-κB sub-models (GRANSIMTNF and GRANSIMTNF-NFKB) (Examples 1 and 2). Rules and parameters for cell and bacteria processes (e.g., cell movement, cell recruitment, bacterial growth—Figure 6(a)) are the same for different resolutions of the model.

EXAMPLE 2: TUNEABLE RESOLUTION IMPLEMENTED FOR NF-κB SIGNALING IN A MODEL OF A LUNG GRANULOMA IN TB
In Example 1, we introduced GRANSIMTNF, a hybrid multi-scale model (consisting of agent-based, ODE, and PDE models) that simulates the immune responses—specifically, granuloma formation and function—during infection with M. tuberculosis (Figure 6(a) and (c)). Although this model captures receptor binding and trafficking processes that in part control TNF availability, it contains limited detail regarding the biological mechanisms that determine the relationship between TNF-bound receptors and cellular responses (Eq. 1). In this example, we demonstrate tunable resolution, fine-graining GRANSIMTNF by incorporating additional molecular detail describing one of the intracellular signaling pathways elicited by TNF binding and then re-engineering GRANSIMTNF to increase biomimetic fidelity.
TNF binding initiates a signaling pathway leading to translocation of NF-κB into the nucleus and ultimately transcription of target inflammatory genes. Activation of the NF-κB pathway affects the immune response to M. tuberculosis through (at least) four mechanisms in macrophages: activation to efficiently kill bacteria, induction of chemokine secretion, induction of cytokine (TNF) expression, and inhibition of apoptosis.73–75,84–87 We wanted to use virtual experiments to explore answers to questions that would require TNF signaling granularity greater than that in GRANSIMTNF. For example, how do the dynamics of the TNF-induced NF-κB pathway influence the long-term immune response to bacteria? Could targeting the TNF-induced NF-κB pathway affect granuloma formation and function? To undertake those virtual experiments we developed a new (and finer-grained) version of GRANSIMTNF, termed GRANSIMTNF-NFKB, containing the enhanced intracellular component details illustrated in Figure 6(d).82
Recent cell culture experiments, including those in88, have identified important molecular mechanisms controlling the dynamics of NF-κB signaling at the single-cell level. To explore possible influences of this pathway in the context of host infection, we incorporated a representation of these dynamics into our model. Equation 1 was replaced by a set of 50 nonlinear ODEs that determine NF-κB signaling dynamics following TNF binding to cell surface TNF receptors.82,88 Those NF-κB dynamics were then linked to the four NF-κB-mediated cell responses in macrophages listed above. NF-κB-induced expression of genes corresponding to TNF, different chemokines, a generic inhibitor of apoptosis protein (IAP),89 and a generic macrophage-activating molecule (ACT; representing, for example, proteins involved in maturation of phago-lysosomes essential for killing bacteria84) as well as translation of their mRNA transcripts were represented using ODEs. For TNF and chemokines, ODEs also describe secretion to extracellular spaces. For macrophage activation and inhibition of apoptosis, because these processes are discrete at the single-cell level, cell behavior was described by a Poisson process with a probability determined within each time-step in part by the intracellular concentration of ACT and IAP, similar to Eqs 1 and 2.82 Fine-graining NF-κB dynamics has two major effects on how TNF signaling is implemented. First, the higher resolution model (Figure 6(a) and (d)) is able to capture the dynamics of TNF-induced responses, for example, oscillatory expression of chemokines, as explored in.82 It also mathematically uncouples the four different NF-κB mediated responses, which is appropriate as these processes are regulated by separate mechanisms (transcription and translation of distinct genes and mRNA transcripts). Virtual experiments using GRANSIMTNF-NFKB documented that the dynamics of TNF-induced NF-κB-mediated responses are critical to controlling bacterial load, inflammation levels, and granuloma size82 (Figure 7).
The three model versions, GRANSIM, GRANSIMTNF, and GRANSIMTNF-NFKB, correspond to the coarse-, intermediate-, and fine-grained multi-scale model versions shown schematically in Figure 2 (panels A1, A2a, and A3, respectively) and our tuneable resolution implementation is described in BOX 1. Model congruency between two of those versions in terms of key biological outcomes is shown schematically in Figure 7 and was obtained using uncertainty and sensitivity analysis (Figure 3). Although GRANSIMTNF-NFKB is the most detailed model, not all our questions regarding TB granuloma formation and function require this level of detail in the NF-κB pathway. Thus, our next goal was to re-engineer and improve scientific usefulness of GRANSIMTNF by drawing on insights gained from GRANSIMTNF-NFKB (Figure 2, panel A2b).
Analysis of GRANSIMTNF-NFKB simulations showed that the timing of NF-κB induced macrophage activation has a more significant effect on granuloma function than the timing of other responses, so we modified GRANSIMTNF to capture the timing effects for different NF-κB mediated responses in a coarse-grained manner without solving for all reactions. The timing of all NF-κB mediated responses in GRANSIMTNF is controlled by a single parameter kNF-κB, the NF-κB activation rate constant, as described in Eq. 1. We replaced this parameter with three independent parameters, kactivation, kchemokine, and kTNF, controlling the timing of each individual NF-κB mediated response separately (kapopt, controlling the rate of apoptosis, already exists in GRANSIMTNF). These parameters control the probability of each NF-κB associated response within a simulation time-step. For example, Eq. 1 is modified to describe the probability at which a macrophage becomes capable of secreting chemokines following NF-κB activation:
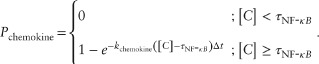 |
(6) |
Similar to Example 1, because the ODEs are being solved for each of the thousands of agents (cells) in the simulation, replacing 50 ODEs determining NF-κB signaling dynamics with three ODEs yields significant computational savings (simulation times, on the order of several hours, are cut to tens of minutes). Because these too are stochastic simulations, thousands of simulations are required for uncertainty and sensitivity analyses.
Simulation results from the re-engineered GRANSIMTNF (Figure 8) show the importance of kactivation and less significant effects of kchemokine and kTNF on controlling bacteria numbers and the level of inflammation in tissue. These results also show model congruency between GRANSIMTNF and GRANSIMTNF-NFKB regarding the importance of the timing of macrophage activation in control of granuloma formation and functioning. Depending on the focus of our virtual experiments regarding TNF and its influence on granuloma dynamics, we can now toggle between a re-engineered GRANSIMTNF and GRANSIMTNF-NFKB (BOX 1), exercising resolution tuning and, in the case of GRANSIMTNF, incorporating information from molecular-level NF-κB simulations without the computational expense and complexity of simulating the full model.
Figure 8.
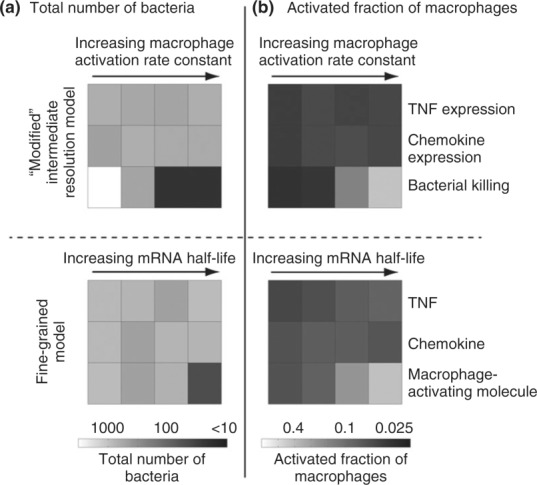
Refinement of GRANSIMTNF. Using uncertainty and sensitivity analyses and knowledge gained from GRANSIMTNF-NFKB, the intermediate resolution model GRANSIMTNF was improved (top panels). Simulation results are shown for the timing of NF-κB-mediated responses, including macrophage activation to efficiently kill bacteria, TNF expression, and chemokine expression, and their effects on (a) bacteria numbers 200 days post-infection and (b) activated fraction of macrophages 50 days post-infection. Bottom panels show results from GRANSIMTNF-NFKB in which the timing of NF-κB-mediated responses is regulated by their corresponding mRNA stabilities (half-lives). Simulations are run varying the stability of mRNA transcripts corresponding to macrophage-activating molecules, chemokines, and TNF while maintaining the average extent of the responses at containment baseline levels.82 To maintain the average extent of each response as its corresponding mRNA stability is varied, we simultaneously vary another parameter associated with a process downstream of mRNA translation. Parameters varied to adjust the extent of the three NF-κB mediated responses are: TNF secretion rate, chemokine secretion rate, ACT concentration threshold for macrophage activation, and macrophage activation rate constant. Four values of mRNA half-life were tested in fine-grain simulations: 12 min, 30 min, 1 h, and 3 h. Top panels show results from the modified GRANSIMTNF in which the timing of NF-κB-mediated responses is regulated by new parameters kactivation, kchemokine, and kTNF. Four values tested for each of these three parameters in intermediate resolution simulations are: 1.26 × 10⁻⁸, 3.97 × 10⁻⁸, and 1.26 × 10⁻⁷ and 3.97 × 10⁻⁷ (#/cell)−1 s−1. All other parameters are kept at their containment (baseline) levels. Simulation results are averaged over 10 repetitions.
EXAMPLE 3: TUNEABLE RESOLUTION IMPLEMENTED FOR A MULTI-ORGAN MODEL OF LUNG GRANULOMA FORMATION AND FUNCTION IN TB
In Examples 1 and 2, the multi-scale models created added molecular-scale dynamics to a cellular/tissue scale model. In this example, we highlight a tuneable resolution approach when fine-graining at the same scale as the original model. Another way to describe this is that we add an additional compartment (organ) to the original model.
Recruitment of immune cells to the lung to participate in control of infection is a critical event in granuloma formation during infection with M. tuberculosis. Recruited cells include T cells, macrophages, and dendritic cells. Effector immune cells such as CD4+ and CD8+ T cells are generated in LNs and must travel to lungs. The process can take anywhere from a few days to weeks for persistent pathogens like M. tuberculosis. Some studies show that an effective protective response to M. tuberculosis can be impacted by this slow or delayed induction or function of effector cells.90 For example, host–bacteria interactions can result in a delayed cell migratory activity or reduced antigen-presenting cell function, at least in macrophages.91–93 In addition, timing of initiation of granuloma formation (which is dependent on the recruitment of these effector cells from LNs) can affect capabilities of antigen-presenting cells (such as macrophages and dendritic cells) to find bacteria and migrate to draining LNs in a timely manner. Effector T cells are generated, but in most cases it is too late to allow infection to be cleared. Instead, there is either a ‘stand-off’ leading to latency or an active infection. Clearly, LN dynamics can have a huge impact on the immune response to M. tuberculosis infection, and that is the focus of Example 3.
GRANSIM is low-resolution with respect to LN mechanisms and processes (Figure 6(a) and (e); Examples 1 and 2).11,69,70,83 It captures effector T cell recruitment into the lung in a simplified way, by specifying a forcing function with a parameter representing the time of arrival of those cells to the lung. Decisions to recruit cells and what T cell phenotypes to recruit are based on events unfolding during simulations. Effector T cell phenotypes are defined based on their immunological functions: interferon-γ (IFN-γ)-producing T cells (Tγ), cytotoxic T cells (TC), and regulatory T cells (Treg). T cell recruitment from LN to lung is a stochastic event, and occurs at specific sites (vascular sources) on the grid. To mimic the biological delay in adaptive immunity development in LNs, effector T cell recruitment is enabled only after ∼20 days post-infection, which reflects the typical 2–4 week post-infection ‘delay’ in mounting adaptive immunity. Uncertainty and sensitivity analyses show that simulated granuloma formation is highly dependent on the value of this delay parameter,69,70 motivating a more physiologically realistic treatment of immune cell recruitment to the lung.
To better represent mechanisms occurring within a LN during granuloma formation, we fine-grained recruitment of immune cells from the LN by replacing parameters with an entire physiological compartment representing a LN94 (Figure 6(f), and schematically shown in Figure 2 panels B1 to B2). Doing so allowed us to address questions related to modulation and timing of T cell responses as a function of infection progression within the lung. We mapped a single virtual LN to a collection of several (∼5) lung-draining LNs, the sites of generation of effector T cells. The resulting multi-organ model, GRANSIM-LN, is hybrid: an ABM for the lung compartment (Figure 6(a)) and a nonlinear system of ODEs representing phenomena within the LN compartment (Figure 6(f)).94 The LN model includes mechanisms that represent antigen presentation and T cell priming and differentiation and consists of 13 ODEs tracking APCs, naïve T cells, and precursor, and effector CD4+ and CD8+ T cells. Effector T cells can leave the LN to migrate to lungs. This LN model was developed and calibrated using data from M. tuberculosis-infected mice.95
Linking the LN and lung granuloma models to form GRANSIM-LN requires specifying how cells traffic between the compartments. To represent T cell recruitment that is based on the level of infection in the lung, we used the scaled sum of infected and chronically infected macrophage populations in the lung to represent the pool of antigen-presenting cells that have potential to migrate to draining LNs. The biological behavior to which this maps captures bacteria in lung causing more antigen-presenting cells to ingest them and traffic to LNs. Mathematical scaling is necessary because GRANSIM represents only a portion of the lung, and our LN model represents only a single draining LN. We also account for delays that an antigen-presenting cell can encounter during uptake, maturation, and migration processes between physiological compartments. The scaled sum of all infected macrophages in the lung at each time-step is used as the initial condition for the ‘mature dendritic cell’ (the key antigen-presenting cell in our model) equation within the LN. After the dynamics simulate for that time-step in the LN model, T cells generated return to the lung via blood to participate in the lung infection model (GRANSIM). T cell fluxes generated by the LN model are converted into integers and cells are placed on a queue to enter the lung when a source location becomes available. A T cell in the queue has a fixed lifespan. Its ‘age’ is preserved when it enters the grid. The process is intended to mimic the effect of effector T cells circulating through the blood and waiting for signals to extravasate into the tissue.96 The only recruitment parameter shared between coarse- and fine-grained model versions, GRANSIM and GRANSIM-LN, respectively, is a fixed threshold for recruitment of T cells that is based on the concentration of cytokines and chemokines at the blood sources, where cells can enter.
Using our fine-grained model, GRANSIM-LN, we can explore possible changes in the efficiency and magnitude of T cell priming, differentiation, and migration to the lung. We can also capture the contraction phase of effector T cell fluxes due to a reduction of antigen-presenting cells migrating to LNs.
GRANSIM-LN experiments demonstrated that detectable levels of effector T cells at the site of infection occur only above a threshold number of bacteria in the lung. On the basis of that observation, we re-engineered the original GRANSIM by introducing a new threshold parameter. When total bacteria counts in the lung ABM are greater than this threshold, T cell recruitment is enabled. To create this re-engineered GRANSIM, we focused on one of the most informative proxies for infection in the lung, the total bacteria count. We used measures from GRANSIM-LN to create a proxy function of total bacteria versus T cell fluxes from LN to lung. In order to simulate a large spectrum of granuloma outcomes ranging from clearance to dissemination, we varied 12 GRANSIM parameters (while fixing the LN model parameters) and generated 900 different temporal bacteria profiles. We plotted daily bacteria counts versus T cell flux (Figure 9; only Tγ fluxes are displayed). Figure 9(a) shows a clear separation of fluxes as infection progresses. We then fit time-adjusted functions to the data (Figure 9(b)) and generated an improved GRANSIM (Figure 9(c)).
Figure 9.
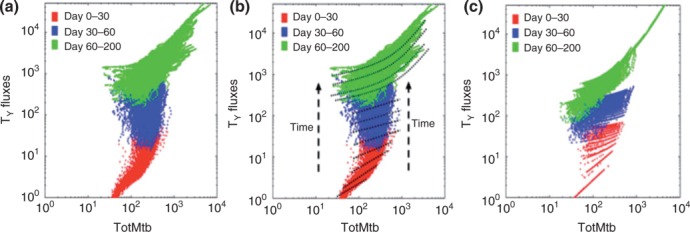
Comparisons of Tγ cell fluxes across different model resolutions. T cells that make the cytokine IFN-γ (Tγ) are shown on the y-axis. The x-axis represents total bacteria count. Each plot displays a total of 900 × 200 points. Each point is the combination of total bacteria count and Tγ cell fluxes at a certain day during a simulated 200-day infection. Different colors correspond to different time intervals. (a) Results using the fine-grained version of T cell recruitment (GRANSIM-LN). (b) The data from (a) with examples of linear and quadratic functions superimposed to fit the data. (c) Results using the improved coarse-grained model in which the fine-grained fluxes in (a) are approximated using the linear and quadratic functions illustrated in (b). For days 0–60, we use linear approximations. For days 60–200 we use quadratic functions. We fit simulated Tγ and TC fluxes separately. In order to cross-validate with fine-grained LN outcome distributions, we truncated the approximations at a certain level of total bacteria, below which the flux becomes 0. For example after day 30, if bacteria <35, fluxes are set to 0.
Thus we have two model versions, in terms of incorporation of LN dynamics, the re-engineered GRANSIM and the fine-grained GRANSIM-LN; we can choose the appropriate version for the biological aspect of interest. (When needed, we also have a LN ABM that tracks individual cell movements and generation of effector T cells within a LN, but its details are beyond the scope of this example.49,97–99
Our tuneable resolution approach gives us the ability to toggle easily between different model versions to continually improve explanatory mechanistic insights and expand the scope of those insights. That process is illustrated by the data in Figure 10. Results from the re-engineered GRANSIM differ from the other resolutions: using the same set of parameter values shared across versions, it returns more total bacteria in the range of 0–1000 (Figure 10(a)). This demonstrates that the original GRANSIM formulation of T cell recruitment skews the results towards a more likely resolution of the infection by superimposing a fixed time for enabling T cell recruitment, as well as continuous unlimited availability of effector T cells, regardless of the level of infection in the lung. This highlights the use of tuneable resolution to identify a model flaw. Although the re-engineered GRANSIM (Figure 10(c)) gives more accurate predictions, computational efficiency is not affected (we are solving a single ODE that only occurs in one step of the model). In other work with a multi-organ model, however, tuneable resolution allowed a 17-fold increase in computational efficiency.49
Figure 10.
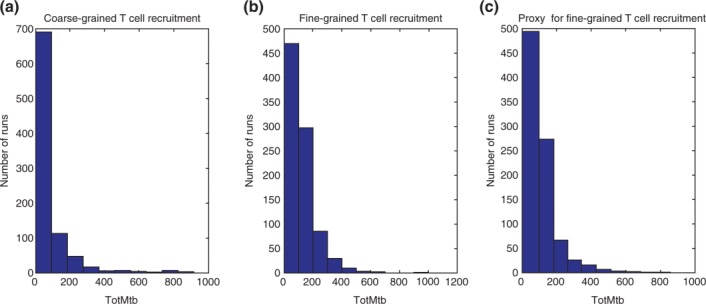
Outcome distributions across different model resolutions describing T cell recruitment. Total bacteria count at day 200 is used as proxy for TB outcome (x-axis). Each plot displays the outcome from 900 different parameter combinations resulting from the virtual experiments described in the text. Each point is the combination of total bacterial count and Tγ cell fluxes at 200 days post infection. (a) GRANSIM. (b) GRANSIM-LN. (c) re-engineered GRANSIM.
DISCUSSION
Systems biologists are leveraging multi-scale modeling methods to study important biomedical problems in new ways. These models are exciting and we need new approaches to help with analyses, expand scientific and medical relevance, and promote sharing capabilities. We argue that developing and building models with tuneable resolution is a step in that direction. Tuneable resolution begins with a multi-scale model in place and strives to make model mechanisms more explanatory and thus more biomedically relevant, while simultaneously making them more useable and understandable. Our approach is applicable not only for systems that are multi-scale in space (including multi-organ) and time, but also for models that are multi-dimensional. In Ref 97, e.g., we develop an ABM of the LN that can be used in 2 or 3 dimensions.
Different features of the tuneable resolution approach that we describe here have been employed recently in other contexts. As examples, Gary An uses variable resolution components within a multi-scale model to explore and study the pathogenesis of multiple organ failure.100 An additional model use is enabling dynamic knowledge representation within the multi-scale model's modular architecture. Lam and Hunt38 used sequential changes in micro-mechanism resolution to improve explanatory insight into the paradoxical roles of P-glycoprotein, Cyp3A4 enzymes, and sub-cellular microenvironments in determining temporal patterns of transport and metabolism of saquinavir (an antiretroviral drug) in Caco-2 cell cultures. Focusing on explanatory cell-level mechanisms of epithelial cell cystogenesis in cultures, Kim and Hunt101 used resolution tuning to evolve fully rule-based cell agents into composite counterparts that achieved quantitative cross-model validation targets under normal and dysregulated conditions. Ruiz-Herrero et al. developed a coarse-grained model of receptor–ligand binding, allowing computationally efficient consideration of some spatial aspects of interactions.102 Tang et al.14,103,104 altered the resolution of different multi-scale model components in order to enable dynamic simulation results to achieve quantitative validation targets drawn from a variety of different experimental conditions. It is useful to view all of these from within the framework of tuneable resolution provided here.
A current weakness of the tuneable resolution approach is that it is relatively new and in use in only a few laboratories. It is not yet clear how established good modeling and simulation practices will need to be expanded to cover the new methods. Figure 2 serves to highlight an issue for which additional best practice guidelines may be needed. During each tuning exercise, there are frequent opportunities to introduce bias, artifacts, and/or seed an inscription error7,105 (http://furm.org/glossary.html), which—if unnoticed—will jeopardize the scientific usefulness of subsequent model refinements. The risks are somewhat amplified because we are working in the aqua area of Figure 4, striving to move rightward. Consequently, the models are perpetual works in progress. The best strategy is to reinforce adherence to good modeling and simulation practices, and that includes keeping records of tuning protocols, consequences, inferences, decisions, and evidence of feature falsification. The ideal course for model improvement (Figure 3) anticipates incremental tuning to expand both coarse- and fine-grain model overlap. However, tuning to improve overlap in one ‘direction’ may come at the cost of reduced consistency in areas previously covered. A mitigating strategy is to expand the variety of qualitative (and, later, quantitative) validation targets and/or increase the variety of biomimetic constraints, and confirm through in silico experimentation that those targets are still achieved. Doing so, however, places an additional demand on modeler efforts. Because tuning is currently a hands-on activity, considerable time and effort may be required to successfully complete several tuning cycles, and that can be considered a shortcoming. A mitigating strategy is to increase modularity at both mechanism description and software levels so that refactoring decreases as explanatory power increases. The technical challenges faced when switching between coarse and fine-grain components are common to all multi-scale modeling efforts and are well understood.7–9,30–38,59,60 Consequently, efficient resolution tuning should be a priority requirement at the beginning of a project because it can influence selection of modeling methods.
We envision that the most efficient and productive path to more effective and eventually curative therapeutic intervention strategies for TB and other diseases will involve many cycles through the right side of Figure 1 coupled with the occasional but essential cycle through the left side. The approach can be extended to and beyond clinical trials. We anticipate new knowledge falsifying some model and/or assumption details, requiring feature revision and inclusion of new features. We do not anticipate those future virtual experiments, even those requiring virtual patients, to utilize a single, grand, unified multi-scale model, however. Because each virtual experiment will be motivated by a specific question or hypothesis, it will, like wet-lab counterparts, focus on just one (or at most a few) aspect of the disease and its context. As was the case for Examples 1–3, we expect the model used to be somewhat individualized (and somewhat optimized, from an execution perspective) for the particular virtual experiment and its uses: easily (ideally automatically) assembled from a family of exchangeable model components, each having achieved aspect-specific validation targets. Because TB phenomena are multi-scale within and across many aspects of the disease, we anticipate that many of those virtual experiments will require a resolution change one or more times during execution. Thus, we argue that having, expanding, and improving that capability is essential to achieving important public health outcomes from computational models.
A multi-scale model that has resolution-tuning capabilities and has earned a degree of credibility provides improved, plausible explanations of how events may coalesce into phenomena within and between biological scales. Such improved insight—improvement in the theory of TB, in our examples—is often infeasible to achieve through wet-lab experimentation alone. The most frequently touted benefit of multi-scale modeling is improved predictions. We have demonstrated how improved scientific value can be derived from exploring and refining plausible, explanatory multi-scale mechanisms using a tuneable resolution approach.
Acknowledgments
This work was supported by NIH R01 HL106804 (DEK), R01 GM096040 (JJL), R01 EB012579 (DEK and JJL) and R01 HL 110811 (DEK and JJL).
REFERENCES
- 1.Bokulich A. How scientific models can explain. Synthese. 2011;180:33–45. [Google Scholar]
- 2.Darden L. Thinking again about biological mechanisms. Philos Sci. 2008;75:958–969. [Google Scholar]
- 3.Weiskopf DA. Models and mechanisms in psychological explanation. Synthese. 2011;183:313–338. [Google Scholar]
- 4.Craver CF. When mechanistic models explain. Synthese. 2006;153:355–376. [Google Scholar]
- 5.Winther RG. Interweaving categories: styles, paradigms, and models. Stud Hist Philos Sci A. 2012;43:628–639. [Google Scholar]
- 6.Weisberg M. Simulation and Similarity: Using Models to Understand the World (Oxford Studies in Philosophy of Science) New York: Oxford University Press; 2013. [Google Scholar]
- 7.Hunt CA, Ropella GP, Lam T, Tang J, Kim SJ, Engelberg J, Sheikh-Bahaei S. At the biological modeling and simulation frontier. Pharm Res. 2009;26:2369–2400. doi: 10.1007/s11095-009-9958-3. [DOI] [PMC free article] [PubMed] [Google Scholar]
- 8.Hunt CA, Ropella GEP. Moving beyond in silico tools to in silico science in support of drug development research. Drug Dev Res. 2011;72:153–161. [Google Scholar]
- 9.Hunt CA, Kennedy RC, Kim SHJ, Ropella GEP. Agent-based modeling: a systematic assessment of use cases and requirements for enhancing pharmaceutical research and development productivity. WIREs Syst Biol Med. 2013;5:461–480. doi: 10.1002/wsbm.1222. doi: 10.1002/wsbm.1222. [DOI] [PMC free article] [PubMed] [Google Scholar]
- 10.de Lara J, Vangheluwe H. AToM(3): a tool for multi-formalism and meta-modelling. Lect Notes Comput Sci. 2002;2306:174–188. [Google Scholar]
- 11.Fallahi-Sichani M, El-Kebir M, Marino S, Kirschner DE, Linderman JJ. Multiscale computational modeling reveals a critical role for TNF-α receptor 1 dynamics in tuberculosis granuloma formation. J Immunol. 2011;186:3472–3483. doi: 10.4049/jimmunol.1003299. [DOI] [PMC free article] [PubMed] [Google Scholar]
- 12.Han LQ, Hanan J, Gresshoff PM. Computational complementation: a modelling approach to study signalling mechanisms during legume autoregulation of nodulation. PLoS Comput Biol. 2010;6:e1000685. doi: 10.1371/journal.pcbi.1000685. [DOI] [PMC free article] [PubMed] [Google Scholar]
- 13.Karalis V, Dokoumetzidis A, Macheras P. A physiologically based approach for the estimation of recirculatory parameters. J Pharmacol Exp Ther. 2004;308:198–205. doi: 10.1124/jpet.103.058941. [DOI] [PubMed] [Google Scholar]
- 14.Tang J, Hunt CA. Identifying the rules of engagement enabling leukocyte rolling, activation, and adhesion. PLoS Comput Biol. 2010;6:e1000681. doi: 10.1371/journal.pcbi.1000681. [DOI] [PMC free article] [PubMed] [Google Scholar]
- 15.Park S, Ropella GE, Kim SH, Roberts MS, Hunt CA. Computational strategies unravel and trace how liver disease changes hepatic drug disposition. J Pharmacol Exp Ther. 2009;328:294–305. doi: 10.1124/jpet.108.142497. [DOI] [PubMed] [Google Scholar]
- 16.Fallahi-Sichani M, Marino S, Flynn JL, Linderman JJ, Kirschner DE. A systems biology approach for understanding granuloma formation and function in tuberculosis. In: McFadden J, Beste DJV, Kierzek AM, editors. Systems Biology of Tuberculosis. New York, NY: Springer; 2012. [Google Scholar]
- 17.Bassingthwaighte JB, Beard DA, Carlson BE, Dash RK, Vinnakota K. Modeling to link regional myocardial work, metabolism and blood flows. Ann Biomed Eng. 2012;40:2379–2398. doi: 10.1007/s10439-012-0613-5. [DOI] [PMC free article] [PubMed] [Google Scholar]
- 18.Beard DA, Neal ML, Tabesh-Saleki N, Thompson CT, Bassingthwaighte JB, Shimoyama M, Carlson BE. Multiscale modeling and data integration in the virtual physiological rat project. Ann Biomed Eng. 2012;40:2365–2378. doi: 10.1007/s10439-012-0611-7. [DOI] [PMC free article] [PubMed] [Google Scholar]
- 19.Bolser DC, Pitts TE, Morris KF. The use of multiscale systems biology approaches to facilitate understanding of complex control systems for airway protection. Curr Opin Pharmacol. 2011;11:272–277. doi: 10.1016/j.coph.2011.06.002. [DOI] [PMC free article] [PubMed] [Google Scholar]
- 20.Campbell SG, McCulloch AD. Multi-scale computational models of familial hypertrophic cardiomyopathy: genotype to phenotype. J R Soc Interface. 2011;8:1550–1561. doi: 10.1098/rsif.2011.0184. [DOI] [PMC free article] [PubMed] [Google Scholar]
- 21.Flamm MH, Diamond SL. Multiscale systems biology and physics of thrombosis under flow. Ann Biomed Eng. 2012;40:2355–2364. doi: 10.1007/s10439-012-0557-9. [DOI] [PMC free article] [PubMed] [Google Scholar]
- 22.Kim E, Stamatelos S, Cebulla J, Bhujwalla ZM, Popel AS, Pathak AP. Multiscale imaging and computational modeling of blood flow in the tumor vasculature. Ann Biomed Eng. 2012;40:2425–2441. doi: 10.1007/s10439-012-0585-5. [DOI] [PMC free article] [PubMed] [Google Scholar]
- 23.Politi AZ, Donovan GM, Tawhai MH, Sanderson MJ, Lauzon AM, Bates JH, Sneyd J. A multiscale, spatially distributed model of asthmatic airway hyper-responsiveness. J Theor Biol. 2010;266:614–624. doi: 10.1016/j.jtbi.2010.07.032. [DOI] [PMC free article] [PubMed] [Google Scholar]
- 24.Vodovotz Y, Csete M, Bartels J, Chang S, An G. Translational systems biology of inflammation. PLoS Comput Biol. 2008;4:e1000014. doi: 10.1371/journal.pcbi.1000014. [DOI] [PMC free article] [PubMed] [Google Scholar]
- 25.Walpole J, Papin JA, Peirce SM. Multiscale computational models of complex biological systems. Annu Rev Biomed Eng. 2013;15:137–154. doi: 10.1146/annurev-bioeng-071811-150104. [DOI] [PMC free article] [PubMed] [Google Scholar]
- 26.Wang W, King MR. Multiscale modeling of platelet adhesion and thrombus growth. Ann Biomed Eng. 2012;40:2345–2354. doi: 10.1007/s10439-012-0558-8. [DOI] [PubMed] [Google Scholar]
- 27.Coveney PV, Fowler PW. Modelling biological complexity: a physical scientist's perspective. J R Soc Interface. 2005;2:267–280. doi: 10.1098/rsif.2005.0045. [DOI] [PMC free article] [PubMed] [Google Scholar]
- 28.Kirschner D. The multi-scale immune response to pathogens: M. tuberculosis as an example. In: Flower D, Timmis J, editors. In Silico Immunology. New York: Springer; 2007. pp. 289–311. [Google Scholar]
- 29.Vlachos DG. A review of multiscale analysis: examples from systems biology, materials engineering, and other fluid-surface interacting systems. Adv Chem Eng. 2005;30:1–61. [Google Scholar]
- 30.Alden K, Read M, Timmis J, Andrews PS, Veiga-Fernandes H, Coles M. Spartan: a comprehensive tool for understanding uncertainty in simulations of biological systems. PLoS Comput Biol. 2013;9:e1002916. doi: 10.1371/journal.pcbi.1002916. [DOI] [PMC free article] [PubMed] [Google Scholar]
- 31.Bhalla US, Iyengar R. Emergent properties of networks of biological signaling pathways. Science. 1999;283:381–387. doi: 10.1126/science.283.5400.381. [DOI] [PubMed] [Google Scholar]
- 32.Chylek LA, Harris LA, Tung CS, Faeder JR, Lopez CF, Hlavacek WS. Rule-based modeling: a computational approach for studying biomolecular site dynamics in cell signaling systems. WIREs Syst Biol Med. 2014;6:13–36. doi: 10.1002/wsbm.1245. doi: 10.1002/wsbm.1245. [DOI] [PMC free article] [PubMed] [Google Scholar]
- 33.Hlavacek WS, Faeder JR, Blinov ML, Perelson AS, Goldstein B. The complexity of complexes in signal transduction. Biotechnol Bioeng. 2003;84:783–794. doi: 10.1002/bit.10842. [DOI] [PubMed] [Google Scholar]
- 34.Hlavacek WS, Faeder JR, Blinov ML, Posner RG, Hucka M, Fontana W. Rules for modeling signal-transduction systems. Sci STKE. 2006:re6. doi: 10.1126/stke.3442006re6. [DOI] [PubMed] [Google Scholar]
- 35.Kholodenko B, Yaffe MB, Kolch W. Computational approaches for analyzing information flow in biological networks. Sci Signal. 2012;5:re1. doi: 10.1126/scisignal.2002961. [DOI] [PubMed] [Google Scholar]
- 36.Marchisio MA, Colaiacovo M, Whitehead E, Stelling J. Modular, rule-based modeling for the design of eukaryotic synthetic gene circuits. BMC Syst Biol. 2013;7:42. doi: 10.1186/1752-0509-7-42. [DOI] [PMC free article] [PubMed] [Google Scholar]
- 37.Vilar JM, Saiz L. Reliable prediction of complex phenotypes from a modular design in free energy space: an extensive exploration of the lac operon. ACS Synth Biol. 2013;2:576–586. doi: 10.1021/sb400013w. [DOI] [PubMed] [Google Scholar]
- 38.Lam TN, Hunt CA. Mechanistic insight from in silico pharmacokinetic experiments: roles of P-glycoprotein, Cyp3A4 enzymes, and microenvironments. J Pharmacol Exp Ther. 2010;332:398–412. doi: 10.1124/jpet.109.160739. [DOI] [PubMed] [Google Scholar]
- 39.Angermann BR, Klauschen F, Garcia AD, Prustel T, Zhang F, Germain RN, Meier-Schellersheim M. Computational modeling of cellular signaling processes embedded into dynamic spatial contexts. Nat Methods. 2012;9:283–289. doi: 10.1038/nmeth.1861. [DOI] [PMC free article] [PubMed] [Google Scholar]
- 40.Andasari V, Roper RT, Swat MH, Chaplain MA. Integrating intracellular dynamics using CompuCell3D and Bionetsolver: applications to multiscale modelling of cancer cell growth and invasion. PLoS One. 2012;7:e33726. doi: 10.1371/journal.pone.0033726. [DOI] [PMC free article] [PubMed] [Google Scholar]
- 41.Meier-Schellersheim M, Xu X, Angermann B, Kunkel EJ, Jin T, Germain RN. Key role of local regulation in chemosensing revealed by a new molecular interaction-based modeling method. PLoS Comput Biol. 2006;2:e82. doi: 10.1371/journal.pcbi.0020082. [DOI] [PMC free article] [PubMed] [Google Scholar]
- 42.Donoho DL, Maleki A, Shahram M, Rahman IU, Stodden V. Reproducible research in computational harmonic analysis. Comput Sci Eng. 2009;11:8–18. [Google Scholar]
- 43.Fomel S, Hennenfent G. Reproducible computational experiments using SCons. International Conference on Acoustics, Speech; 2007. pp. 1257–1260. [Google Scholar]
- 44.Mesirov JP. Accessible reproducible research. Science. 2010;327:415–416. doi: 10.1126/science.1179653. [DOI] [PMC free article] [PubMed] [Google Scholar]
- 45.Morin A, Urban J, Adams PD, Foster I, Sali A, Baker D, Sliz P. Shining Light into Black Boxes. Science. 2012;336:159–160. doi: 10.1126/science.1218263. [DOI] [PMC free article] [PubMed] [Google Scholar]
- 46.Peng RD. Reproducible research and biostatistics. Biostatistics. 2009;10:405–408. doi: 10.1093/biostatistics/kxp014. [DOI] [PubMed] [Google Scholar]
- 47.Stodden V. The scientific method in practice: reproducibility in the computational sciences; MIT Sloan Research Paper; 2010. p. 4773. [Google Scholar]
- 48.Marino S, Hogue IB, Ray CJ, Kirschner DE. A methodology for performing global uncertainty and sensitivity analysis in systems biology. J Theor Biol. 2008;254:178–196. doi: 10.1016/j.jtbi.2008.04.011. [DOI] [PMC free article] [PubMed] [Google Scholar]
- 49.Gong C, Linderman JJ, Kirschner DE. Harnessing the heterogeneity of T cell differentiation fate to fine-tune generation of effector and memory T cells. Front Immunol. 2013;5:57. doi: 10.3389/fimmu.2014.00057. [DOI] [PMC free article] [PubMed] [Google Scholar]
- 50.Davis PK, Hillestad R. Families of models that cross levels of resolution – issues for design, calibration and management. 1993 Winter Simulation Conference Proceedings; 1993. pp. 1003–1012. [Google Scholar]
- 51.Natrajan A, Reynolds PF, Srinivasan S. MRE: a flexible approach to multi-resolution modeling. 11th Workshop on Parallel and Distributed Simulation, Proceedings; 1997. pp. 156–163. [Google Scholar]
- 52.Bigelow JH, Davis PK. Developing improved metamodels by combining phenomenological reasoning with statistical methods. Proc Soc Photo Opt Ins. 2002;4716:167–180. [Google Scholar]
- 53.Davis PK. Exploratory analysis enabled by multiresolultion, multiperspective modeling. Proceedings of the 2000 Winter Simulation Conference; 2000. pp. 293–302. [Google Scholar]
- 54.Kasputis S, Ng HC. Composable simulations. Proceedings of the 2000 Winter Simulation Conference; 2000. pp. 1577–1584. [Google Scholar]
- 55.Aumann CA. A methodology for developing simulation models of complex systems. Ecol Model. 2007;202:385–396. [Google Scholar]
- 56.Kimmins JP, Blanco JA, Seely B, Welham C, Scoullar K. Complexity in modelling forest ecosystems: How much is enough? Forest Ecol Manage. 2008;256:1646–1658. [Google Scholar]
- 57.Ratze C, Gillet F, Muller JP, Stoffel K. Simulation modelling of ecological hierarchies in constructive dynamical systems. Ecol Complex. 2007;4:13–25. [Google Scholar]
- 58.Wu JG, David JL. A spatially explicit hierarchical approach to modeling complex ecological systems: theory and applications. Ecol Model. 2002;153:7–26. [Google Scholar]
- 59.Bassingthwaighte JB, Chizeck HJ, Atlas LE. Strategies and tactics in multiscale modeling of cell-to-organ systems. Proc IEEE. 2006;94:819–831. doi: 10.1109/JPROC.2006.871775. [DOI] [PMC free article] [PubMed] [Google Scholar]
- 60.Hernandez AI, Le Rolle V, Defontaine A, Carrault G. A multiformalism and multiresolution modelling environment: application to the cardiovascular system and its regulation. Philos Trans R Soc A. 2009;367:4923–4940. doi: 10.1098/rsta.2009.0163. [DOI] [PMC free article] [PubMed] [Google Scholar]
- 61.Brenner S, Noble D, Sejnowski TJ, Fields RD, Laughlin S, Berridge M, Segel ML, Prank K, Dolmetsch RE. Understanding complex systems: top-down, bottom-up or middleout? In: Bock GG, editor. Novartis Foundation Symposium 239: Complexity in Biological Information Processing. Chichester, England: John Wiley & Sons; 2001. pp. 150–159. [Google Scholar]
- 62.Bokulich A. Explanatory models versus predictive models: reduced complexity modeling in geomorphology. In: Vassilios Karakostos DD, editor. EPSA11 Perspectives and Foundational Problems in Philosophy of Science. New York, NY: Springer International Publishing; 2013. pp. 115–128. [Google Scholar]
- 63.Viceconti M. A tentative taxonomy for predictive models in relation to their falsifiability. Philos Trans A Math Phys Eng Sci. 2011;369:4149–4161. doi: 10.1098/rsta.2011.0227. [DOI] [PubMed] [Google Scholar]
- 64.Hunt CA, Ropella GE, Lam T, Gewitz AD. Relational grounding facilitates development of scientifically useful multiscale models. Theor Biol Med Model. 2011;8:35. doi: 10.1186/1742-4682-8-35. [DOI] [PMC free article] [PubMed] [Google Scholar]
- 65.Bartha P. Analogy and analogical reasoning. In: Zalta EN, Fall, editors. The Stanford Encyclopedia of Philosophy. Standford: The Metaphysics Research Lab, Center for the Study of Language and Information; 2013. Available at: http://plato.stanford.edu/archives/fall2013/entries/reasoning-analogy/ [Google Scholar]
- 66.Conzelmann H, Saez-Rodriguez J, Sauter T, Bullinger E, Allgower F, Gilles ED. Reduction of mathematical models of signal transduction networks: simulation-based approach applied to EGF receptor signalling. Syst Biol (Stevenage) 2004;1:159–169. doi: 10.1049/sb:20045011. [DOI] [PubMed] [Google Scholar]
- 67.Maurya MR, Bornheimer SJ, Venkatasubramanian V, Subramaniam S. Reduced-order modelling of biochemical networks: application to the GTPase-cycle signalling module. Syst Biol (Stevenage) 2005;152:229–242. doi: 10.1049/ip-syb:20050014. [DOI] [PMC free article] [PubMed] [Google Scholar]
- 68.Maurya MR, Katare S, Patkar PR, Rundell AE, Venkatasubramanian V. A systematic framework for the design of reduced-order models for signal transduction pathways from a control theoretic perspective. Comput Chem Eng. 2006;30:437–452. [Google Scholar]
- 69.Segovia-Juarez JL, Ganguli S, Kirschner D. Identifying control mechanisms of granuloma formation during M. tuberculosis infection using an agent-based model. J Theor Biol. 2004;231:357–376. doi: 10.1016/j.jtbi.2004.06.031. [DOI] [PubMed] [Google Scholar]
- 70.Ray JC, Flynn JL, Kirschner DE. Synergy between individual TNF-dependent functions determines granuloma performance for controlling Mycobacterium tuberculosis infection. J Immunol. 2009;182:3706–3717. doi: 10.4049/jimmunol.0802297. [DOI] [PMC free article] [PubMed] [Google Scholar]
- 71.Flynn JL, Goldstein MM, Chan J, Triebold KJ, Pfeffer K, Lowenstein CJ, Schreiber R, Mak TW, Bloom BR. Tumor necrosis factor-α is required in the protective immune response against Mycobacterium tuberculosis in mice. Immunity. 1995;2:561–572. doi: 10.1016/1074-7613(95)90001-2. [DOI] [PubMed] [Google Scholar]
- 72.Saunders BM, Briscoe H, Britton WJ. T cell-derived tumour necrosis factor is essential, but not sufficient, for protection against Mycobacterium tuberculosis infection. Clin Exp Immunol. 2004;137:279–287. doi: 10.1111/j.1365-2249.2004.02518.x. [DOI] [PMC free article] [PubMed] [Google Scholar]
- 73.Algood HM, Lin PL, Yankura D, Jones A, Chan J, Flynn JL. TNF influences chemokine expression of macrophages in vitro and that of CD11b + cells in vivo during Mycobacterium tuberculosis infection. J Immunol. 2004;172:6846–6857. doi: 10.4049/jimmunol.172.11.6846. [DOI] [PubMed] [Google Scholar]
- 74.Keane J, Balcewicz-Sablinska MK, Remold HG, Chupp GL, Meek BB, Fenton MJ, Kornfeld H. Infection by Mycobacterium tuberculosis promotes human alveolar macrophage apoptosis. Infect Immun. 1997;65:298–304. doi: 10.1128/iai.65.1.298-304.1997. [DOI] [PMC free article] [PubMed] [Google Scholar]
- 75.Harris J, Hope JC, Keane J. Tumor necrosis factor blockers influence macrophage responses to Mycobacterium tuberculosis. J Infect Dis. 2008;198:1842–1850. doi: 10.1086/593174. [DOI] [PubMed] [Google Scholar]
- 76.Lin PL, Myers A, Smith L, Bigbee C, Bigbee M, Fuhrman C, Grieser H, Chiosea I, Voitenek NN, Capuano SV, et al. Tumor necrosis factor neutralization results in disseminated disease in acute and latent Mycobacterium tuberculosis infection with normal granuloma structure in a cynomolgus macaque model. Arthritis Rheum. 2010;62:340–350. doi: 10.1002/art.27271. [DOI] [PMC free article] [PubMed] [Google Scholar]
- 77.Wallis RS. Infectious complications of tumor necrosis factor blockade. Curr Opin Infect Dis. 2009;22:403–409. doi: 10.1097/QCO.0b013e32832dda55. [DOI] [PubMed] [Google Scholar]
- 78.Wallis RS, Broder MS, Wong JY, Hanson ME, Beenhouwer DO. Granulomatous infectious diseases associated with tumor necrosis factor antagonists. Clin Infect Dis. 2004;38:1261–1265. doi: 10.1086/383317. [DOI] [PubMed] [Google Scholar]
- 79.Tubach F, Salmon D, Ravaud P, Allanore Y, Goupille P, Breban M, Pallot-Prades B, Pouplin S, Sacchi A, Chichemanian RM, et al. Risk of tuberculosis is higher with anti-tumor necrosis factor monoclonal antibody therapy than with soluble tumor necrosis factor receptor therapy: the three-year prospective French research axed on tolerance of biotherapies registry. Arthritis Rheum. 2009;60:1884–1894. doi: 10.1002/art.24632. [DOI] [PMC free article] [PubMed] [Google Scholar]
- 80.Lin PL, Plessner HL, Voitenok NN, Flynn JL. Tumor necrosis factor and tuberculosis. J Investig Dermatol Symp Proc. 2007;12:22–25. doi: 10.1038/sj.jidsymp.5650027. [DOI] [PubMed] [Google Scholar]
- 81.Fallahi-Sichani M, Schaller MA, Kirschner DE, Kunkel SL, Linderman JJ. Identification of key processes that control tumor necrosis factor availability in a tuberculosis granuloma. PLoS Comput Biol. 2010;6:e1000778. doi: 10.1371/journal.pcbi.1000778. [DOI] [PMC free article] [PubMed] [Google Scholar]
- 82.Fallahi-Sichani M, Flynn JL, Linderman JJ, Kirschner DE. Differential risk of tuberculosis reactivation among anti-TNF therapies is due to drug binding kinetics and permeability. J Immunol. 2012;188:3169–3178. doi: 10.4049/jimmunol.1103298. [DOI] [PMC free article] [PubMed] [Google Scholar]
- 83.Cilfone NA, Perry CR, Kirschner DE, Linderman JJ. Multi-scale modeling predicts a balance of tumor necrosis factor-α and interleukin-10 controls the granuloma environment during Mycobacterium tuberculosis infection. PLoS One. 2013;8:e68680. doi: 10.1371/journal.pone.0068680. [DOI] [PMC free article] [PubMed] [Google Scholar]
- 84.Gutierrez MG, Mishra BB, Jordao L, Elliott E, Anes E, Griffiths G. NF-kappa B activation controls phagolysosome fusion-mediated killing of mycobacteria by macrophages. J Immunol. 2008;181:2651–2663. doi: 10.4049/jimmunol.181.4.2651. [DOI] [PubMed] [Google Scholar]
- 85.Mosser DM, Edwards JP. Exploring the full spectrum of macrophage activation. Nat Rev Immunol. 2008;8:958–969. doi: 10.1038/nri2448. [DOI] [PMC free article] [PubMed] [Google Scholar]
- 86.Beg AA, Baltimore D. An essential role for NF-kappaB in preventing TNF-α-induced cell death. Science. 1996;274:782–784. doi: 10.1126/science.274.5288.782. [DOI] [PubMed] [Google Scholar]
- 87.Van Antwerp DJ, Martin SJ, Kafri T, Green DR, Verma IM. Suppression of TNF-α-induced apoptosis by NF-κB. Science. 1996;274:787–789. doi: 10.1126/science.274.5288.787. [DOI] [PubMed] [Google Scholar]
- 88.Tay S, Hughey JJ, Lee TK, Lipniacki T, Quake SR, Covert MW. Single-cell NF-κB dynamics reveal digital activation and analogue information processing. Nature. 2010;466:267–271. doi: 10.1038/nature09145. [DOI] [PMC free article] [PubMed] [Google Scholar]
- 89.Karin M, Lin A. NF-kappaB at the crossroads of life and death. Nat Immunol. 2002;3:221–227. doi: 10.1038/ni0302-221. [DOI] [PubMed] [Google Scholar]
- 90.Chackerian AA, Alt JM, Perera TV, Dascher CC, Behar SM. Dissemination of Mycobacterium tuberculosis is influenced by host factors and precedes the initiation of T-cell immunity. Infect Immun. 2002;70:4501–4509. doi: 10.1128/IAI.70.8.4501-4509.2002. [DOI] [PMC free article] [PubMed] [Google Scholar]
- 91.Chang ST, Linderman JJ, Kirschner DE. Multiple mechanisms allow Mycobacterium tuberculosis to continuously inhibit MHC class II-mediated antigen presentation by macrophages. Proc Natl Acad Sci USA. 2005;102:4530–4535. doi: 10.1073/pnas.0500362102. [DOI] [PMC free article] [PubMed] [Google Scholar]
- 92.Giacomini E, Iona E, Ferroni L, Miettinen M, Fattorini L, Orefici G, Julkunen I, Coccia EM. Infection of human macrophages and dendritic cells with Mycobacterium tuberculosis induces a differential cytokine gene expression that modulates T cell response. J Immunol. 2001;166:7033–7041. doi: 10.4049/jimmunol.166.12.7033. [DOI] [PubMed] [Google Scholar]
- 93.Hickman SP, Chan J, Salgame P. Mycobacterium tuberculosis induces differential cytokine production from dendritic cells and macrophages with divergent effects on naive T cell polarization. J Immunol. 2002;168:4636–4642. doi: 10.4049/jimmunol.168.9.4636. [DOI] [PubMed] [Google Scholar]
- 94.Marino S, El-Kebir M, Kirschner D. A hybrid multi-compartment model of granuloma formation and T cell priming in tuberculosis. J Theor Biol. 2011;280:50–62. doi: 10.1016/j.jtbi.2011.03.022. [DOI] [PMC free article] [PubMed] [Google Scholar]
- 95.Marino S, Myers A, Flynn JL, Kirschner DE. TNF and IL-10 are major factors in modulation of the phagocytic cell environment in lung and lymph node in tuberculosis: a next-generation two-compartmental model. J Theor Biol. 2010;265:586–598. doi: 10.1016/j.jtbi.2010.05.012. [DOI] [PMC free article] [PubMed] [Google Scholar]
- 96.Garcia-Ramallo E, Marques T, Prats N, Beleta J, Kunkel SL, Godessart N. Resident cell chemokine expression serves as the major mechanism for leukocyte recruitment during local inflammation. J Immunol. 2002;169:6467–6473. doi: 10.4049/jimmunol.169.11.6467. [DOI] [PubMed] [Google Scholar]
- 97.Gong C, Mattila JT, Miller M, Flynn JL, Linderman JJ, Kirschner D. Predicting lymph node output efficiency using systems biology. J Theor Biol. 2013;335C:169–184. doi: 10.1016/j.jtbi.2013.06.016. [DOI] [PMC free article] [PubMed] [Google Scholar]
- 98.Linderman JJ, Riggs T, Pande M, Miller M, Marino S, Kirschner DE. Characterizing the dynamics of CD4+ T cell priming within a lymph node. J Immunol. 2010;184:2873–2885. doi: 10.4049/jimmunol.0903117. [DOI] [PMC free article] [PubMed] [Google Scholar]
- 99.Riggs T, Walts A, Perry N, Bickle L, Lynch JN, Myers A, Flynn J, Linderman JJ, Miller MJ, Kirschner DE. A comparison of random vs. chemotaxis-driven contacts of T cells with dendritic cells during repertoire scanning. J Theor Biol. 2008;250:732–751. doi: 10.1016/j.jtbi.2007.10.015. [DOI] [PMC free article] [PubMed] [Google Scholar]
- 100.An G. Introduction of an agent-based multi-scale modular architecture for dynamic knowledge representation of acute inflammation. Theor Biol Med Model. 2008;5:11. doi: 10.1186/1742-4682-5-11. [DOI] [PMC free article] [PubMed] [Google Scholar]
- 101.Kim SH, Hunt CA. Composite cell agent model of epithelial culture in vitro. Proceedings of the 2011 Workshop on Agent-Directed Simulation. Society for Computer Simulation International; 2011. pp. 45–51. [Google Scholar]
- 102.Ruiz-Herrero T, Estrada J, Guantes R, Miguez DG. A tunable coarse-grained model for ligand-receptor interaction. PLoS Comput Biol. 2013;9:e1003274. doi: 10.1371/journal.pcbi.1003274. [DOI] [PMC free article] [PubMed] [Google Scholar]
- 103.Tang J, Ley KF, Hunt CA. Dynamics of in silico leukocyte rolling, activation, and adhesion. BMC Syst Biol. 2007;1:14. doi: 10.1186/1752-0509-1-14. [DOI] [PMC free article] [PubMed] [Google Scholar]
- 104.Tang J, Fernandez-Garcia I, Vijayakumar S, Martinez-Ruis H, Illa-Bochaca I, Nguyen DH, Mao JH, Costes SV, Barcellos-Hoff MH. Irradiation of juvenile, but not adult, mammary gland increases stem cell self-renewal and estrogen receptor negative tumors. Stem Cells. 2014;32:649–661. doi: 10.1002/stem.1533. [DOI] [PubMed] [Google Scholar]
- 105.Smith BC. On the Origin of Objects. Cambridge: MIT Press; 1996. [Google Scholar]
- 106.Hayenga H, Thorne B, Peirce S, Humphrey J. Ensuring congruency in multiscale modeling: towards linking agent based and continuum biomechanical models of arterial adaptation. Ann Biomed Eng. 2011;39:2669–2682. doi: 10.1007/s10439-011-0363-9. [DOI] [PMC free article] [PubMed] [Google Scholar]