

Abstract
Theoretical models of alcoholism emphasize the acute reinforcing properties of alcohol as chief determinants of drinking, and animal research suggests adolescents are uniquely sensitive to these effects. Human studies of these phenomena, however, are virtually nonexistent. We used ecological momentary assessment methods to capture adolescents' subjective responses to alcohol in real time in their natural environments. Adolescent participants were 22 problem drinkers, ages 15 to 19 years (M = 18.3, SD = 0.09; 55% female; 55% alcohol dependent). Participants consumed alcohol on 38% of days during a one-week monitoring period, with an average of 5 drinks per occasion. Momentary data revealed that adolescents experience decreased stimulation and increased sedation and ‘high’ across the ascending limb of the blood alcohol curve. Notably, greater craving predicted higher volumes of subsequent alcohol consumption during the episode, whereas greater ‘high’ attenuated use. To test for developmental differences in these effects, we pooled these data with data from a similarly ascertained sample of 36 adult heavy drinkers, ages 24 to 64 years (M = 38.1, SD = 11.8; 50% female; 61% alcohol dependent). Adolescents were more sensitive to the stimulant effects of alcohol than adults. This study provides novel data on how adolescent problem drinkers experience alcohol in their natural contexts and illustrates how these effects, which appear to differ from adult problem drinkers, confer liability for future drinking.
Keywords: alcohol, drinking, adolescents, subjective responses, EMA
Drinking alcohol produces a host of pharmacological effects that cause acute changes in affect and cognition. These experiences predict future drinking and are important targets for clinical interventions (Heilig et al., 2010). On the whole, alcohol produces stimulant effects early in the course of intoxication, when blood alcohol concentration (BAC) levels first rise, and causes pronounced sedative effects when BAC levels decline (Ray, MacKillop, & Monti, 2010). There is considerable heterogeneity, however, in alcohol response patterns across individuals (Morean & Corbin, 2010; Quinn & Fromme, 2011). Heavy drinkers typically show more pronounced stimulation and less sedation than light drinkers, and this unique pattern of sensitivity prospectively predicts hazardous drinking (King, de Wit, McNamara, & Cao, 2011). Distinct response patterns are also observed in adults with a family history of alcoholism (Schuckit, Smith, Kalmijn, & Danko, 2005) as well as carriers of certain genotypes (Ray, Miranda, et al., 2010). Taken together, research demonstrates that subjective responses to alcohol are clinically meaningful endophenotypes that mark acquired or heritable pharmacological vulnerability to alcohol's effects.
Despite progress characterizing alcohol response patterns in adults, our understanding of how alcohol affects adolescents is based almost entirely on animal models due to restrictions on administering alcohol to underage drinkers. This gap in knowledge is critical because adolescence is a key period in the development of alcohol use disorders. Teenagers use alcohol more than any other psychoactive substance, with 15% of youth meeting criteria for an alcohol use disorder (AUD) by 18 years of age (Eaton et al., 2012; Swendsen et al., 2012). By comparison with adults, adolescents are disproportionately affected by pathological drinking, with past-year AUD prevalence rates highest during adolescence (Grant et al., 2004). Furthermore, beyond the acute health risks linked to underage drinking (Hingson & Kenkel, 2004), alcohol misuse during adolescence predicts future alcohol dependence in adulthood (Buu et al., 2012). Advancing our understanding of the mechanisms that underlie pathological drinking during adolescence would inform theoretical models of alcohol dependence and elucidate important targets for clinical intervention.
Animal research suggests that adolescents respond differently to alcohol than adults in ways that may explain why youth are especially susceptible to hazardous drinking. Compared to adult animals, adolescent animals are hypersensitive to alcohol's stimulant effects and less sensitive to its sedative effects (Spear, 2011). These findings are not due to differences in BAC levels or rates of alcohol metabolism, and may be more pronounced following chronic alcohol exposure (Spear & Varlinskaya, 2010). Human data evaluating these effects are scant, however, leaving unanswered questions about how these findings apply to humans. One study (N = 22) examined alcohol's effects on boys, ages 8 to 15 years (Behar et al., 1983). This was participants' first intoxicating experience, with a mean peak BAC of 0.04 mg/ml. Participants showed no behavioral signs of intoxication. Yet alcohol increased participants' self-reported sedation and decreased stimulation while BAC levels ascended. Although this study provides initial data on how alcohol affects alcohol-naïve youth, the clinical significance of these findings is unclear inasmuch as adolescents' alcohol response profile may differ in the natural environment or vary depending on their drinking histories. Furthermore, it remains unknown whether adolescents' responses to alcohol influence future drinking levels or whether their drinking is driven chiefly by other factors, and human studies have not compared adolescents and adults on their subjective responses to alcohol.
In this study, our primary objective was to capture the real-time occurrence of adolescents' subjective responses to alcohol in their natural environments using ecological momentary assessment (EMA) methods. Our group and others have successfully used this approach to study affective and cognitive correlates of alcohol use in adults (Piasecki, Wood, Shiffman, Sher, & Heath, 2012; Ray, Miranda, et al., 2010; Shiffman, 2009; Tidey et al., 2008). The current study is the first to extend this line of investigation to adolescents. Based on findings from Behar et al. (1983), we hypothesized that self-reported stimulation, as assessed immediately following each of the first three drinks of the day would show a negative relationship with estimated BAC (eBAC) levels, whereas sedation and eBAC would be positively related. In addition, we examined whether adolescents' subjective responses to alcohol predict an outcome with direct clinical significance, namely subsequent alcohol consumption. For exploratory purposes, we examined the association between eBAC levels and alcohol craving (i.e., urge to drink) and subjective ‘high,’ as well as the effects of craving and ‘high’ on subsequent drinking. Alcohol potentiates craving and ‘high’ in adults (Ray, MacKillop, et al., 2010) and craving is associated with loss of control over drinking (Bohn, Krahn, & Staehler, 1995).
As a secondary aim, we examined whether findings from animal research generalize to humans by comparing data gathered from adolescents with data from a similarly ascertained adult sample. We hypothesized that the magnitudes of adolescent's subjective stimulation would be greater than those reported by adults across eBAC levels. We also explored whether adolescents and adults are affected differently by alcohol in terms of craving.
Method
Participants
We enrolled 29 adolescents who consumed alcohol at least twice weekly in the past 30 days. Adolescents were recruited from the community for a study of how a medication affects teenagers' reactions to alcohol. This study focused on data from the 1-week premedication monitoring period. Additional inclusion criteria were: 15-19 years old, able to read simple English, and postpubescent. Exclusion criteria were history of alcohol treatment or treatment seeking; past-month opiate use; current or lifetime opiate use disorder (DSM-IV-TR; American Psychiatric Association, 2000); positive urine toxicology screen for narcotics, amphetamines, sedative hypnotics, or opiates; alcohol withdrawal; suicidal or psychotic; and medical conditions or medications that contraindicated taking the study medication. Females were ineligible if they were pregnant, nursing, or unwilling to use contraception.
The comparison adult sample (n = 36) was comprised of non-treatment-seeking heavy drinkers recruited from the community for a similar medication study. Eligibility criteria for adolescents and adults were essentially identical, except for age and drinking history. Adults were ≥ 21 years of age and reported heavy drinking ≥ 2 days per week in the past 30 days. Based on evidence that adolescence extends to the early twenties (Giedd, 2004), we selected the subset of adults who were ≥ 24 years of age. Detailed methods for the adult sample are reported elsewhere (Tidey et al., 2008).
Materials and Procedure
Adolescent volunteers completed a brief telephone interview to determine provisional eligibility and a comprehensive in-person screening that included a detailed medical and psychiatric history, urine and blood tests, and a physical exam. Written informed consent was obtained from 18- and 19-year-old youth and from the parents of minors; assent was obtained from minors.
In an initial training session, participants were taught to discern standard alcoholic drink volumes using a graphic manual that depicted standard drinks by beverage type. Training sessions were personalized to each participant's typical drinking habits, and all received wallet cards with conversion information. Standard drinks were defined by established parameters (National Institute on Alcohol Abuse and Alcoholism, 2005). Participants then completed a premedication EMA period of approximately one week (M = 6.3 days; SD = 1.5). No instructions were given to reduce or otherwise alter drinking habits. The Brown University institutional review board approved this study.
EMA
Our EMA protocol was implemented with adolescents on handheld wireless devices (Omnia; Samsung Electronics, Ridgefield Park, NJ) running software designed for this study. Instructions were in simple English and participants recorded data by tapping directly on the screen. Response options included visual analog bars (converted to discrete point scales), multiple checkboxes (choose all that apply), and forced choices (choose only one).
Our protocol for capturing alcohol effects is shown in Figure 1. At the first begin-drink report of an episode, participants rated their subjective states and recorded contextual information. Participants were asked whether they started drinking, and if so, how many minutes had elapsed since they began. Drinking episodes where the first begin-drink report was initiated >5 min after drinking onset were excluded from analyses in both the adolescent and adult samples. During end-drink reports, participants recorded how many minutes elapsed since they finished their drink, selected the beverage type (beer, liquor, etc.), recorded the ounces consumed, and rated their subjective states. Time stamps indicated latency between onset of the drinking episode and each assessment. Participants also reported whether they used nicotine or cannabis while drinking.
Figure 1.

Schematic of the ecological momentary assessment battery for capturing estimated blood alcohol concentrations and subjective responses to alcohol among adolescent participants; n = number of drink reports. Intermediate Begin Drink reports were not included in analyses.
To simplify the instructional set, participants were taught to initiate begin- and end-drink reports immediately prior to and directly after each standard drink, respectively. Assessments were delivered only for the first three drinks of an episode, however, to reduce response burden and facilitate compliance. Intermediate begin-drink reports (i.e., second and third drinks) were not included in analyses (see Figure 1). Although our EMA protocols were essentially identical across the adolescent and adult samples, adults recorded drinking data before and after the first two drinks of a drinking episode. As such, the adolescent sample was restricted to these reports in adolescent-adult comparisons.
Measures
Participants
Demographics and AUD diagnoses for adolescents were derived using the Kiddie Schedule for Affective Disorders for School-Age Children (Kaufman et al., 1997). Interviewers received training in diagnostic assessment and achieved high inter-rater reliability (kappa > 0.90). Diagnoses were determined by case consensus. For descriptive purposes, participants also completed the Rutgers Alcohol Problem Index (RAPI; White & Labouvie, 1989), a continuous measure of alcohol-related problems (Cronbach's α = 0.84). For the adult sample, alcohol diagnoses were derived from the Structured Clinical Interview for DSM-IV Axis I Disorders – Patient Version (First, Spitzer, & Gibbon, 1995).
Alcohol use
Drinking prior to participation was assessed using the 90-day timeline follow-back interview (TLFB; Sobell & Sobell, 1992). Alcohol use during the 1-week trial was assessed using TLFB and EMA.
Momentary subjective states
Two items from the stimulation (energized, excited) and sedation (sedated, sluggish) subscales of the Biphasic Alcohol Effects Scale (BAES; Martin et al., 1993) were administered to adolescents. Youths rated items on visual analog scales from 0 (not at all) to 10 (extremely) and items were combined into a mean score for each dimension (Cronbach's α for begin- and end-drink reports, respectively: Stimulation = 0.71, 0.83; Sedation = 0.68, 0.73). Craving and ‘high’ were measured using single items rated from 0 (no urge and not at all, respectively) to 10 (strongest ever and extremely, respectively). The measure of ‘high’ originated from the Subjective High Assessment Scale (SHAS; Schuckit, 1984) and strongly correlates with total SHAS scores across BAC levels (Ray, MacKillop, Leventhal, & Hutchison, 2009). The term ‘high’ was anchored to alcohol effects to preserve common adolescent vernacular. All other items measured affect independent from alcohol-specific effects to avoid psychometric issues involved with asking adolescents to deconstruct the degree to which changes in affect are attributable to alcohol (Rueger, McNamara, & King, 2009). For all items, participants made ratings based on their feelings ‘right now.’
EMA measures common to both the adolescent and adult samples included one item from the BAES (energized), which assessed stimulation, and the single-item measure of craving. Both items were rated on visual analog scales ranging from 0 to 10 and were the focus of adolescent-adult comparisons.
eBAC
Information from end-drink reports was used to calculate eBAC at each end-drink report using a standard formula (Matthews & Miller, 1979) shown to produce high intraclass correlations with actual BACs (Hustad & Carey, 2005; Matthews & Miller, 1979). This formula was used in prior EMA research (Piasecki et al., 2012; Ray, Miranda, et al., 2010).
Data Analytic Strategy
Generalized estimating equation (GEE) models tested study hypotheses (Zegar, Liang, & Albert, 1988). This approach accommodates varying numbers of observations across individuals while controlling for autocorrelation and without biasing results. An independent structure provided the best fit for continuous (subjective responses) and count data (number of standard drinks); models assumed a normal link function unless otherwise noted. Given our primary interest in person-level effects (i.e., change in an individual's subjective responses in accordance with his/her eBAC level), we extricated within-person drink-to-drink variation in eBAC and subjective intoxication from the effects of between-person variability in typical eBAC and subjective intoxication (Palta, 2003). Specifically, we entered both momentary eBAC at each end-drink report and each participant's average eBAC level across the monitoring period in all models predicting subjective responses. The momentary variable reflects the within-person effect while the average variable reflects the between-person effect of typical intoxication. Begin-drink reports were entered as baseline covariates in all models to better isolate alcohol's effects. Models also included person-level covariates (i.e., sex, alcohol dependence, and baseline drinking levels). Analyses were performed using SPSS, version 19.0 (IBM, Armonk, NY).
To examine dose-related changes in adolescents' subjective responses, we estimated separate models to predict each subjective rating from eBAC. This approach is more sensitive than modeling numbers of standard drinks and coincides with laboratory and EMA research (Piasecki et al., 2012; Ray, Miranda, et al., 2010). Analyses were restricted to the first drinking episode of the day to eliminate potential carryover effects; drinking episodes were defined as the period from the start of the first drink to the point where eBAC returned to 0.00g/dl. Days were sorted according to each participant's social schedule (e.g., 8am to 3am) rather than calendar day. We detected outlier values for eBAC (n = 6) from 4 participants. Participant reports indicated these values were artifacts of noncompliance with the EMA protocol and thus were excluded from analyses. Continuous variables were centered then standardized (M = 0, SD = 1); model coefficients represent differences in standard deviation units associated with the predictors.
Our second set of analyses tested whether momentary end-drink ratings influence subsequent drinking levels. For each subjective response, we entered both momentary responses at each end-drink report and each participant's average rating across the monitoring period. The daily total number of standard drinks consumed subsequent to each momentary report served as the dependent variable. Continuous variables were centered and drinking outcomes were analyzed using a Poisson log-linear function. In a set of initial models, subjective ratings were entered separately as predictors of subsequent drinks. Significant effects were then entered simultaneously in a single model to identify the strongest determinant(s) of drinking.
Final analyses compared adolescents' and adults' subjective responses to alcohol. Independent sample t tests and chi-squared analyses compared the samples on demographic and drinking variables. Separate models tested the main and interactive effects of age group and eBAC on each dependent variable. Age group was coded with an orthogonal contrast (− 0.5 for adults versus 0.5 for adolescents) and continuous variables were centered and standardized.
Results
Descriptive Data
Adolescents consumed alcohol on an average of 38% of study days, with average of 4.95 (SD = 4.64) standard drinks per drinking day; 49% were heavy drinking days. EMA and TLFB drinking data were highly correlated (ps < .001) in terms of the total number of drinks consumed during the period (r = 0.89), the number of drinking days (r = 0.71), and the number of heavy drinking days (r = 0.80). For all variables, EMA indicated higher drinking levels than TLFB.
Twenty-six participants had at least one drinking episode (M = 2.1, SD = 1.0) during the assessment period, with a total of 69 drinking episodes recorded. Restricting analyses to the first drinking episode of the day excluded six episodes across six participants. Eliminating episodes that included concurrent cannabis use excluded six episodes across five participants. Finally, restricting begin-drink reports to those initiated ≤ 5 min of drinking onset excluded 17 episodes, leaving a final total of 40 episodes from 22 participants. Of these episodes, the vast majority (85%) had begin-drink reports completed before (40%) or within 2 min (45%) of drinking onset, making it unlikely that the begin-drink reports captured the pharmacological effects of alcohol. During the first begin-drink reports of drinking episodes, adolescents were highly stimulated (M = 7.3, SD = 1.8), had strong urges to drink (M = 6.8, SD = 2.9), and reported low levels of sedation (M = 1.7, SD = 1.6) and ‘high’ (M = 1.2, SD = 2.2), with no significant association between the timing of begin-drink reports (i.e., prior to versus 1 to 5 min post drinking onset) and the intensity of begin-drink responses (ps > .10).
Table 1 presents characteristics of the final adolescent sample (n = 22). Participants were 15 to 19 years old and the majority (73%) met criteria for an AUD; all participants met criteria for one or more symptoms of an AUD in the past 12 months. Table 2 shows intercorrelations among study variables. Alcohol dependence was positively associated with drinking levels, average eBAC, female sex, and end-drink craving and sedation. Conversely, dependence was negatively associated with age and end-drink stimulation. Severity of alcohol-related problems was positively associated with dependence as well as measures of eBAC, end-drink craving, and female sex. End-drink stimulation was positively correlated with drinking levels while end-drink sedation and high were negatively associated with drinking levels.
Table 1. Baseline Adolescent Participant Characteristics by Sex: Percentage or Mean (With Standard Deviation in Parentheses).
| Variable | Males (n = 10) | Females (n = 12) | Overall (N = 22) |
|---|---|---|---|
| Age | 17.9 (1.2) | 18.7 (0.5) | 18.3 (0.9) |
| Caucasian | 70.0 | 75.0 | 72.7 |
| African-American | 0.0 | 8.3 | 4.5 |
| American Indian | 10.0 | 0.0 | 4.5 |
| Asian/Pacific Islander | 10.0 | 16.7 | 13.6 |
| Hispanic | 30.0 | 8.3 | 18.2 |
| Alcohol abuse | 20.0 | 16.7 | 18.2 |
| Alcohol dependence | 50.0 | 58.3 | 54.5 |
| AUD symptom count | 3.8 (2.6) | 4.3 (2.3) | 4.1 (2.4) |
| RAPI | 5.9 (5.6) | 11.0 (8.7) | 8.7 (7.7) |
| Cigarette Smoker | 50.0 | 18.2 | 33.3 |
| Baseline drinking days (%) | 26.3 (11.1) | 28.3 (8.7) | 27.4 (9.7) |
| Baseline drinks per drinking day | 5.1 (1.9) | 3.6 (1.4) | 4.3 (1.8) |
| Baseline heavy drinking days (%) | 12.9 (9.1) | 14.6 (9.6) | 13.8 (9.2) |
Note. AUD = Alcohol Use Disorder; RAPI = Rutgers Alcohol Problem Index
Table 2. Intercorrelations for Adolescent Participant Characteristics, Subjective Alcohol Response Measures, and eBAC After the First Three Alcoholic Drinks of the Day.
| Measure | 1 | 2 | 3 | 4 | 5 | 6 | 7 | 8 | 9 | 10 | 11 | 12 | 13 | |
|---|---|---|---|---|---|---|---|---|---|---|---|---|---|---|
| 1. | Momentary eBAC | |||||||||||||
| 2. | Average eBAC | .54*** | ||||||||||||
| 3. | ED Stimulation | −.23* | −.21 | |||||||||||
| 4. | ED Sedation | .27* | .24* | −.57*** | ||||||||||
| 5. | 5. ED High | .12 | −.10 | −.07 | .26* | |||||||||
| 6. | ED Craving | .06 | .18 | .25* | −.12 | .12 | ||||||||
| 7. | Standard drinks | −.08 | .17 | .26* | −.35** | −.36** | .07 | |||||||
| 8. | Age (years) | −.01 | −.03 | .30** | −.06 | .23* | .003 | −.05 | ||||||
| 9. | Sex (female) | .14 | .26* | .12 | .11 | .48*** | .50*** | −.21 | .27* | |||||
| 10. | Alcohol dependence | .19 | .36** | −.34** | .23* | −.07 | .24* | .27* | −.23* | .24* | ||||
| 11. | RAPI | .25* | .47*** | .01 | .04 | −.03 | .37** | .21 | −.13 | .39*** | .67*** | |||
| 12. | Drinking daysa | .02 | .04 | −.30** | .31** | .21 | .36** | −.22 | .18 | .27* | .34** | .10 | ||
| 13. | Heavy drinking daysa | .20 | .38** | −.17 | .04 | −.18 | .27* | .26* | −.09 | .08 | .47*** | .55*** | .35** | |
Note. eBAC = estimated blood alcohol concentration; Momentary eBAC = person-centered eBAC; Average eBAC = participants' average eBAC across the monitoring period; ED = end drink report; standard drinks = the daily total number of subsequent standard drinks consumed after each end-drink report; RAPI = Rutgers Alcohol Problem Index;
derived from the 90-day Timeline Follow-Back interview conducted at baseline.
p < .05,
p < .01,
p < .001.
We assessed compliance with our standard-drink protocol by converting grams of alcohol consumed at each end-drink report into standard drinks. Nearly all drink reports (94%) were recorded after participants consumed between 0.67 to 1.33 standard drinks (see Figure 2). We accounted for variability in the amount of alcohol consumed, along with variability in person-level factors that influence intoxication (e.g., sex, weight, etc.), by relying on eBAC levels as our primary independent measure. Across the study, the average eBAC was 0.025g/dl (SD = 0.011) at the end of Drink 1, 0.041g/dl (SD = 0.017) at the end of Drink 2, and 0.055g/dl (SD = 0.016) at the end of Drink 3. We evaluated whether reports were recorded during the ascending or descending limb of the blood alcohol curve by computing successive differences in eBAC across end-drink reports within each drinking episode (Piasecki et al., 2012); all end-drink reports were recorded during the ascending limb.
Figure 2.
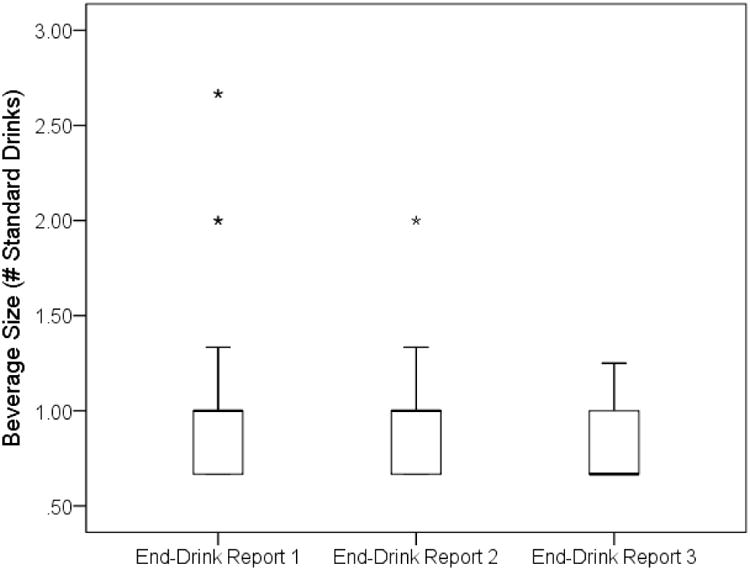
Boxplot illustrating adolescent participants' compliance with our EMA protocol regarding standard drinks across the first three drinks of a drinking episode.
Associations between Alcohol Consumption and Momentary Subjective Responses
As shown in Table 3 and Figure 3, we found a significant positive association between momentary eBAC and subjective reports of sedation and ‘high’ and a significant negative association between momentary eBAC and stimulation. We also found a significant between-person association, such that individuals with higher average eBAC experienced less end-drink ‘high.’ There was no effect of eBAC on craving. To account for the possibility that begin-drink stimulation, which was notably high in this sample, might influence the association between eBAC and end-drink stimulation when included as a covariate in the model, we ran two additional models. First, we excluded this variable from the model and found the negative association between momentary eBAC and end-drink stimulation was essentially unaffected by the exclusion of this covariate (β = − 0.16, SE = 0.07, p = .02). Next, we tested whether findings for stimulation were upheld when analyses were restricted to episodes where begin-drink reports were recorded prior to drinking onset and found the same negative association between eBAC and end-drink stimulation (β = − 0.28, SE = 0.08, p = .001).
Table 3. Summary of GEE Models Predicting Momentary Subjective Responses Among Adolescents Fitting Between- and Within-Individual Effects for eBAC.
| 95% CI | |||||
|---|---|---|---|---|---|
|
|
|||||
| Model and predictor variables | β | SE | LL | UL | p |
| Sedation | |||||
| Sex (female) | − 0.15 | 0.23 | − 0.60 | 0.30 | .501 |
| Alcohol dependence | − 0.03 | 0.30 | − 0.61 | 0.56 | .929 |
| Drinking daysa | 0.20 | 0.17 | − 0.14 | 0.54 | .246 |
| Heavy drinking daysa | 0.01 | 0.19 | − 0.36 | 0.37 | .960 |
| Begin-drink sedation | 0.54 | 0.13 | 0.29 | 0.79 | < .001 |
| Average eBAC | 0.10 | 0.10 | − 0.10 | 0.30 | .330 |
| Momentary eBAC | 0.20 | 0.04 | 0.12 | 0.29 | < .001 |
| Stimulation | |||||
| Sex (female) | 0.34 | 0.18 | − 0.01 | 0.69 | .054 |
| Alcohol dependence | − 0.10 | 0.20 | − 0.51 | 0.30 | .613 |
| Drinking daysa | − 0.25 | 0.08 | − 0.41 | − 0.10 | .001 |
| Heavy drinking daysa | − 0.14 | 0.11 | − 0.35 | 0.08 | .223 |
| Begin-drink stimulation | 0.66 | 0.09 | 0.48 | 0.84 | < .001 |
| Average eBAC | − 0.06 | 0.12 | − 0.29 | 0.18 | .618 |
| Momentary eBAC | − 0.16 | 0.06 | − 0.28 | − 0.04 | .008 |
| High | |||||
| Sex (female) | 0.73 | 0.19 | 0.36 | 1.11 | < .001 |
| Alcohol dependence | − 0.16 | 0.17 | − 0.50 | 0.18 | .355 |
| Drinking daysa | 0.20 | 0.09 | 0.02 | 0.38 | .031 |
| Heavy drinking daysa | 0.01 | 0.11 | − 0.21 | 0.22 | .958 |
| Begin-drink high | 0.44 | 0.10 | 0.25 | 0.64 | < .001 |
| Average eBAC | − 0.38 | 0.08 | − 0.52 | − 0.23 | < .001 |
| Momentary eBAC | 0.21 | 0.07 | 0.08 | 0.34 | .002 |
| Alcohol Craving | |||||
| Sex (female) | 0.41 | 0.19 | 0.05 | 0.77 | .028 |
| Alcohol dependence | − 0.23 | 0.19 | − 0.60 | 0.14 | .226 |
| Drinking daysa | 0.08 | 0.08 | − 0.07 | 0.23 | .302 |
| Heavy drinking daysa | 0.04 | 0.08 | − 0.11 | 0.20 | .585 |
| Begin-drink craving | 0.76 | 0.10 | 0.57 | 0.95 | < .001 |
| Average eBAC | − 0.01 | 0.08 | − 0.16 | 0.14 | .915 |
| Momentary eBAC | − 0.04 | 0.07 | − 0.18 | 0.11 | .609 |
Note: Subjective responses are continuous and standardized variables. GEE = generalized estimating equation; eBAC = estimated blood alcohol concentration; SE = standard error; CI = confidence interval; LL = lower limit; UL = upper limit; Average eBAC = average eBAC across all momentary drink reports during the monitoring period and reflects the between-person effect; Momentary eBAC = person-centered estimated eBAC and reflects the within-person effect;
derived from the 90-day Timeline Follow-Back interview conducted at baseline.
Figure 3.
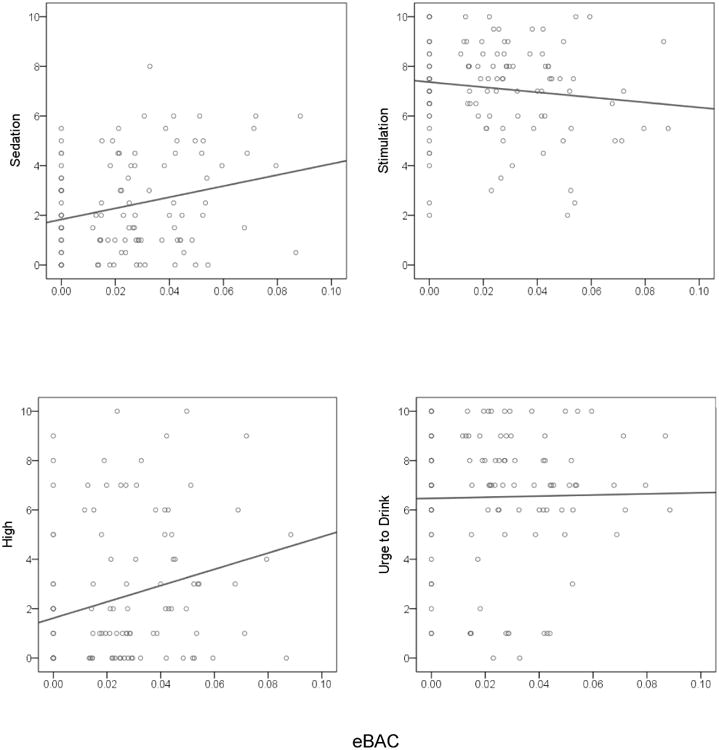
Raw score values and best-fitting trend lines for subjective alcohol responses from estimated blood alcohol concentrations (eBAC) among adolescent participants. Begin-drink baseline values for subjective responses are illustrated at the eBAC level of 0.00.
Effects of Momentary Subjective Responses on Subsequent Alcohol Consumption
As shown in Table 4, greater momentary end-drink craving predicted higher levels of subsequent alcohol consumption that day while greater momentary end-drink ‘high’ predicted lower quantities of subsequent drinking. Neither momentary end-drink stimulation nor momentary end-drink sedation was associated with subsequent drinking levels, and between-person associations were also not significant. When craving and ‘high’ were included in a single model both remained significant predictors of drinking.
Table 4. Summary of GEE Models Predicting Subsequent Alcohol Consumption Among Adolescents Fitting Separate Between- and Within-Individual Effects for Momentary Subjective Responses.
| 95% CI | |||||
|---|---|---|---|---|---|
|
|
|||||
| Model and predictor variables | b | SE | LL | UL | p |
| Sedation | |||||
| Sex (female) | − 0.35 | 0.18 | − 0.70 | 0.00 | .049 |
| Alcohol dependence | 0.68 | 0.24 | 0.21 | 1.16 | .005 |
| Drinking daysa | − 0.02 | 0.01 | − 0.04 | 0.01 | .159 |
| Heavy drinking daysa | 0.02 | 0.01 | − 0.01 | 0.04 | .139 |
| Begin-drink sedation | − 0.14 | 0.09 | − 0.30 | 0.03 | .112 |
| Average end-drink sedationb | − 0.16 | 0.10 | − 0.35 | 0.04 | .119 |
| Momentary end-drink sedationc | − 0.01 | 0.02 | − 0.05 | 0.03 | .678 |
| Stimulation | |||||
| Sex (female) | − 0.58 | 0.20 | − 0.97 | − 0.19 | .003 |
| Alcohol dependence | 0.73 | 0.23 | 0.28 | 1.18 | .001 |
| Drinking daysa | − 0.03 | 0.02 | − 0.07 | 0.01 | .133 |
| Heavy drinking daysa | 0.02 | 0.01 | 0.00 | 0.05 | .062 |
| Begin-drink stimulation | 0.08 | 0.10 | − 0.10 | 0.27 | .389 |
| Average end-drink stimulationb | 0.14 | 0.09 | − 0.04 | 0.32 | .137 |
| Momentary end-drink stimulationc | 0.03 | 0.04 | − 0.06 | 0.11 | .530 |
| High | |||||
| Sex (female) | − 0.17 | 0.24 | − 0.64 | 0.31 | .493 |
| Alcohol dependence | 0.45 | 0.35 | − 0.24 | 1.15 | .201 |
| Drinking daysa | − 0.03 | 0.01 | − 0.06 | − 0.01 | .020 |
| Heavy drinking daysa | 0.02 | 0.02 | − 0.01 | 0.06 | .228 |
| Begin-drink high | − 0.01 | 0.05 | − 0.12 | 0.10 | .832 |
| Average end-drink highb | − 0.02 | 0.09 | − 0.21 | 0.16 | .794 |
| Momentary end-drink highc | − 0.05 | 0.01 | − 0.07 | −0.02 | < .001 |
| Alcohol Craving | |||||
| Sex (female) | − 0.45 | 0.33 | − 1.10 | 0.21 | .180 |
| Alcohol dependence | 0.45 | 0.34 | − 0.23 | 1.12 | .197 |
| Drinking daysa | − 0.04 | 0.02 | − 0.08 | − 0.01 | .009 |
| Heavy drinking daysa | 0.02 | 0.02 | − 0.01 | 0.06 | .152 |
| Begin-drink alcohol craving | 0.01 | 0.10 | − 0.19 | 0.21 | .936 |
| Average end-drink cravingb | 0.00 | 0.13 | − 0.25 | 0.24 | .981 |
| Momentary end-drink cravingc | 0.05 | 0.02 | 0.02 | 0.09 | .006 |
| Multivariate model | |||||
| Sex (female) | − 0.29 | 0.35 | − 0.98 | 0.39 | .397 |
| Alcohol dependence | 0.41 | 0.37 | − 0.31 | 1.12 | .266 |
| Drinking daysa | − 0.04 | 0.02 | − 0.07 | 0.00 | .029 |
| Heavy drinking daysa | 0.02 | 0.02 | − 0.01 | 0.05 | .255 |
| Begin-drink high | − 0.02 | 0.06 | − 0.13 | 0.10 | .783 |
| Begin-drink craving | 0.02 | 0.11 | − 0.19 | 0.23 | .858 |
| Average end-drink highb | − 0.01 | 0.09 | − 0.18 | 0.16 | .901 |
| Average end-drink cravingb | − 0.01 | 0.13 | − 0.25 | 0.24 | .969 |
| Momentary end-drink highc | − 0.04 | 0.01 | − 0.07 | − 0.01 | .008 |
| Momentary end-drink cravingc | 0.04 | 0.02 | 0.00 | 0.07 | .034 |
Note: GEE = generalized estimating equation; SE = standard error; CI = confidence interval; LL = lower limit; UL = upper limit;
derived from the 90-day Timeline Follow-Back interview conducted at baseline;
average subjective response across all momentary end-drink reports during the monitoring period and reflects the between-person effect;
person-centered subjective response and reflects the within-person effect.
Adolescent-Adult Comparisons
Table 5 compares adolescents and adults on demographic and clinical characteristics. The groups were similar, except adults were older (by design) and had higher baseline drinking levels while adolescents had a greater proportion of Hispanic participants. Adults had comparable average eBAC levels to adolescents (Drink 1: M = 0.022g/dl, SD = 0.013; Drink 2: M = 0.031g/dl, SD = 0.018). Table 6 presents intercorrelations among subjective responses and other study variables separately for adolescents and adults. In both samples, baseline heavy drinking was positively associated with average eBAC levels during the trial and dependence was associated with less end-drink stimulation and greater volumes of alcohol consumption per drinking day during the monitoring period. Also consistent across samples was a significant positive association between sex (female) and end-drink craving. The samples differed, however, in the association between end-drink stimulation (energized) and craving; end-drink stimulation and craving were positively associated among adolescents (p = .001) but not adults (p = .23).
Table 5. Comparisons of Participant Characteristics by Age Group: Percentage or Mean (With Standard Deviation in Parentheses).
| Sample | ||||
|---|---|---|---|---|
|
|
||||
| Variable | Adolescent (n = 22) | Adult (n = 36) | t (57) or χ2 | p |
| Age | 18.3 (0.9) | 38.1 (11.8) | 7.79 | < .001 |
| Sex (female) | 54.5 | 50.0 | 0.11 | .737 |
| Race | 5.68 | .128 | ||
| Caucasian | 72.7 | 91.7 | ||
| African-American | 4.5 | 5.6 | ||
| American Indian | 4.5 | 2.8 | ||
| Asian/Pacific Islander | 13.6 | 0.0 | ||
| Other | 4.5 | 0.0 | ||
| Hispanica | 18.2 | 0.0 | 7.03 | .008 |
| Alcohol abuse | 18.2 | 13.9 | 0.19 | .661 |
| Alcohol dependence | 54.5 | 61.1 | 0.24 | .622 |
| Current smoker | 31.8 | 22.2 | 0.84 | .358 |
| Drinking days (%)b | 27.4 (9.7) | 72.0 (18.9) | 10.25 | <.001 |
| Drinks per drinking day | 4.3 (1.8) | 6.0 (2.3) | 2.89 | .005 |
| Heavy drinking days (%)b | 13.5 (9.1) | 44.4 (22.6) | 6.11 | <.001 |
Note.
Ethnicity and race were not mutually exclusive;
derived from the 90-day Timeline Follow-Back interview conducted at baseline.
Table 6. Summary of Intercorrelations for Participant Characteristics, Subjective Alcohol Response Measures, and eBAC After the First Two Alcoholic Drinks of the Day as a Function of Age Group.
| Measure | 1 | 2 | 3 | 4 | 5 | 6 | 7 | 8 | 9 | 10 | |
|---|---|---|---|---|---|---|---|---|---|---|---|
| 1. | Momentary eBAC | — | .71** | −.07 | .13 | .12 | .35** | −.02 | .11 | −.20** | .35** |
| 2. | Average eBAC | .64** | — | −.20** | .11 | .09* | .49** | −.01 | .15* | −.26** | .50*** |
| 3. | ED Energized | −.11 | −.14 | — | .14 | .02 | −.20** | .14 | −.07 | −.06 | −.21 |
| 4. | ED Craving | .09 | .16 | .32** | — | .05 | −.03 | −.03 | −.30** | .03 | .21** |
| 5. | Standard drinks | .01 | .03 | .31* | .14 | — | .16* | −.03 | −.07 | −.17* | −.10 |
| 6. | Alcohol dependence | .12 | .18 | −.29** | .29* | .32* | — | −.20** | .18 | −.31 | .21* |
| 7. | Drinking daysa | .00 | .01 | .01 | .33* | −.16 | .30* | — | .35** | .38* | .07 |
| 8. | Heavy drinking daysa | .22 | .35** | .12 | .29* | .33* | .51** | .37** | — | .19** | .30* |
| 9. | Age (years) | −.17 | −.26* | .24 | −.12 | .04 | −.22 | .19 | −.05 | — | .15* |
| 10. | Sex (female) | .01 | .01 | .08 | .36** | −.15 | .20 | .23 | .08 | .30 | — |
Note. Intercorrelations for adolescents (n = 22) and adults (n = 36) are presented below and above the diagonal, respectively. eBAC = estimated blood alcohol concentration; Momentary eBAC = person-centered estimated eBAC; Average eBAC = average eBAC across all momentary drink reports during the monitoring period; ED = end drink report; standard drinks = the daily total number of subsequent standard drinks consumed after each end-drink report;
derived from the 90-day Timeline Follow-Back interview conducted at baseline;
p < .05,
p < .01,
p < .001.
As shown in Table 7 and Figure 4, the Age Group × Momentary eBAC was significant, such that the effect of age group on end-drink stimulation was greater at lower eBAC levels than at higher eBAC levels, even while controlling for begin-drink stimulation and person-level covariates. In terms of end-drink craving, we found no significant main effect of age group or Age Group × Momentary eBAC. Separate follow-up analyses by age group indicated a positive association between momentary eBAC and end-drink stimulation among adults, while an inverse association of similar magnitude was observed in our adolescent sample (see Table 8).
Table 7. Summary of GEE Models Predicting Momentary Subjective Responses Fitting Between- and Within-Individual Effects for eBAC as a Function of Age Group.
| 95% CI | |||||
|---|---|---|---|---|---|
|
|
|||||
| Model and predictor variables | β | SE | LL | UL | p |
| Stimulation | |||||
| Sex (female) | 0.08 | 0.15 | − 0.21 | 0.36 | .604 |
| Alcohol dependence | − 0.21 | 0.17 | − 0.55 | 0.12 | .214 |
| Drinking daysa | 0.04 | 0.15 | − 0.25 | 0.33 | .777 |
| Heavy drinking daysa | 0.00 | 0.14 | − 0.27 | 0.27 | .990 |
| Begin-drink stimulation | 0.45 | 0.07 | 0.32 | 0.58 | <.001 |
| Average eBAC | − 0.11 | 0.07 | − 0.25 | 0.03 | .116 |
| Momentary eBAC | 0.00 | 0.04 | − 0.08 | 0.09 | .923 |
| Age Group | 0.53 | 0.29 | − 0.03 | 1.09 | .063 |
| Age Group × Average eBAC | 0.11 | 0.13 | − 0.15 | 0.36 | .413 |
| Age Group × Momentary eBAC | − 0.27 | 0.09 | − 0.44 | − 0.09 | .003 |
| Alcohol Craving | |||||
| Sex (female) | 0.29 | 0.11 | 0.07 | 0.51 | .010 |
| Alcohol dependence | − 0.06 | 0.14 | − 0.33 | 0.22 | .679 |
| Drinking daysa | − 0.10 | 0.17 | − 0.43 | 0.24 | .577 |
| Heavy drinking daysa | 0.11 | 0.09 | − 0.08 | 0.29 | .262 |
| Begin-drink craving | 0.61 | 0.07 | 0.48 | 0.73 | <.001 |
| Average eBAC | − 0.01 | 0.09 | − 0.18 | 0.16 | .923 |
| Momentary eBAC | 0.03 | 0.07 | − 0.10 | 0.16 | .610 |
| Age Group | 0.23 | 0.25 | − 0.26 | 0.73 | .359 |
| Age Group × Average eBAC | 0.04 | 0.18 | − 0.31 | 0.40 | .806 |
| Age Group × Momentary eBAC | − 0.11 | 0.13 | − 0.37 | 0.15 | .406 |
Note: Subjective responses are continuous and standardized. In both models, age group was coded with an orthogonal contrast (− 0.5 for adults versus 0.5 for adolescents). The reported coefficients represent standardized effects (effect size d). GEE = generalized estimating equation; eBAC = estimated blood alcohol concentration; SE = standard error; CI = confidence interval; LL = lower limit; UL = upper limit; Average eBAC = average eBAC across all momentary drink reports during the monitoring period and reflects the between-person effect; Momentary eBAC = person-centered estimated eBAC and reflects the within-person effect;
derived from the 90-day Timeline Follow-Back interview conducted at baseline.
Figure 4.
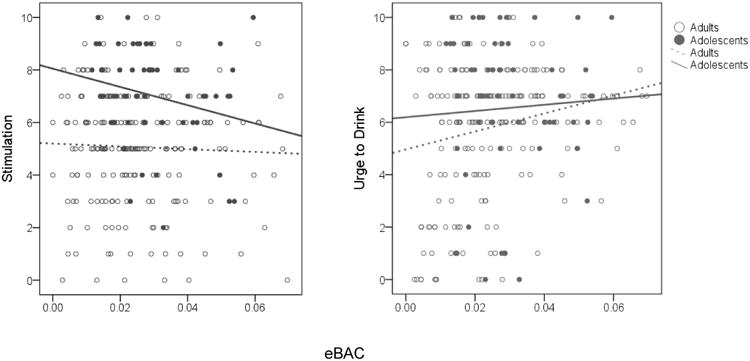
Raw score values and best-fitting trend lines for subjective alcohol responses from estimated blood alcohol concentrations (eBAC) as a function of age group.
Table 8. Summary of GEE Models Predicting Momentary Subjective Responses Fitting Between- and Within-Individual Effects for eBAC Separated by Age Group.
| Adolescent Sample | Adult Sample | |||||||
|---|---|---|---|---|---|---|---|---|
|
|
|
|||||||
| Model and predictor variables | β | SE | 95% CI | p | β | SE | 95% CI | p |
| Stimulation | ||||||||
| Sex (female) | 0.40 | 0.28 | [− 0.16, 0.95] | .162 | 0.00 | 0.21 | [− 0.41, 0.40] | .988 |
| Alcohol dependence | − 0.32 | 0.42 | [− 1.14, 0.49] | .437 | − 0.15 | 0.24 | [− 0.61, 0.31] | .520 |
| Drinking daysa | − 0.17 | 0.17 | [− 0.49, 0.16] | .318 | 0.06 | 0.11 | [− 0.16, 0.27] | .602 |
| Heavy drinking daysa | − 0.04 | 0.24 | [− 0.51, 0.43] | .863 | 0.00 | 0.15 | [− 0.28, 0.29] | .982 |
| Begin-drink stimulation | 0.52 | 0.20 | [0.14, 0.91] | .008 | 0.42 | 0.07 | [0.28, 0.55] | <.001 |
| Average eBAC | − 0.03 | 0.14 | [− 0.31, 0.25] | .835 | − 0.18 | 0.10 | [− 0.37, 0.02] | .075 |
| Momentary eBAC | − 0.14 | 0.07 | [− 0.27, 0.00] | .046 | 0.15 | 0.07 | [0.02, 0.28] | .025 |
| Alcohol Craving | ||||||||
| Sex (female) | 1.52 | 0.48 | [0.57, 2.47] | .002 | 0.19 | 0.16 | [− 0.13, 0.50] | .251 |
| Alcohol dependence | − 1.01 | 0.53 | [− 2.06, 0.04] | .059 | − 0.02 | 0.18 | [− 0.37, 0.34] | .929 |
| Drinking daysa | 0.12 | 0.23 | [− 0.34, 0.58] | .614 | − 0.07 | 0.12 | [− 0.31, 0.17] | .546 |
| Heavy drinking daysa | 0.21 | 0.24 | [− 0.27, 0.69] | .385 | 0.10 | 0.01 | [− 0.09, 0.29] | .309 |
| Begin-drink craving | 0.76 | 0.10 | [0.56, 0.96] | <.001 | 0.54 | 0.08 | [0.38, 0.70] | < .001 |
| Average eBAC | 0.03 | 0.27 | [− 0.51, 0.56] | .921 | − 0.02 | 0.11 | [− 0.23, 0.20] | .887 |
| Momentary eBAC | − 0.04 | 0.26 | [− 0.56, 0.47] | .871 | 0.10 | 0.07 | [− 0.05, 0.25] | .180 |
Note: Subjective responses are continuous and standardized. The reported coefficients represent standardized effects (effect size d). GEE = generalized estimating equation; eBAC = estimated blood alcohol concentration; SE = standard error; CI = confidence interval; Average eBAC = average eBAC across all momentary drink reports during the monitoring period and reflects the between-person effect; Momentary eBAC = person-centered estimated eBAC and reflects the within-person effect;
derived from the 90-day Timeline Follow-Back interview conducted at baseline.
Discussion
This investigation is the first to characterize adolescents' subjective responses to alcohol in their natural environments. Alcohol produced measurable changes in affect among adolescent problem drinkers that were distinct from those observed in adults, and these changes predicted subsequent drinking levels. Specifically, adolescents experienced decreased stimulation and increased sedation and ‘high’ during the ascending limb of the blood alcohol curve. In turn, greater craving predicted increased drinking during the episode while greater ‘high’ attenuated use. Neither stimulation nor sedation predicted drinking levels. Comparison with an adult sample provided a developmental context for these findings. Despite declining stimulation across eBAC levels, adolescents experienced greater stimulation while drinking than adults, especially when eBAC levels were low. These findings are consistent with the extant animal literature, highlight the distinct architecture of alcohol effects during adolescence, and help move the field toward greater consilience between human and animal phenotypes of alcohol intoxication across development (Leeman et al., 2010).
Our finding that alcohol dose-dependently increased sedation and ‘high’ among adolescents is consistent with most adult studies (Ray, MacKillop et al., 2010). Moreover, research with adult samples shows subjective ‘high’ positively correlates with sedation (Ray et al., 2009) and we found this association among adolescents. Our finding that adolescents experience decreased stimulation as eBAC levels rise is consistent with results of the only alcohol administration laboratory study with adolescents (Behar et al., 1983). This negative association is contrary, however, to the pattern observed in many but not all laboratory- and field-based studies with adults. Early studies found greater stimulation in the ascending limb compared to the descending limb (Earleywine, 1995). Others examined alcohol-induced stimulation by comparing post-consumption reports to baseline scores. Using this approach, studies often found an initial transitory spike in stimulation at low BAC levels followed by rapid decline across the ascending limb (King et al., 2011). By contrast, others show steady increases in stimulation across the ascending limb, but this effect is often only seen among certain individuals, such as carriers of certain genotypes and heavy drinkers (Ray & Hutchison, 2004; Rueger et al., 2009).
Our finding that alcohol had negative effects on stimulation among adolescents is inconsistent with the pattern observed in our adult sample as well as with the only two published adult studies that used EMA to characterize acute alcohol effects. Piasecki et al (2012) had cigarette smokers, ages 18 and older, who consumed alcohol at least four times in the past month rate how buzzed, excited, dizzy, and sluggish they felt after the first drink of a drinking episode and again at time-based follow-up assessments. Results showed a positive association between eBAC and all four responses during the ascending limb. In a previous study, we examined the effects of eBAC on subjective vigor (mean score of items: aroused, energetic), negative mood (mean score of items: miserable, sad, discontented), and craving recorded after the second drink of an episode while controlling for begin-drink correlates of each variable (Ray, Miranda et al., 2010). The sample included non-treatment-seeking adult heavy drinkers and provided the data pool from which adults were drawn for our adolescent-adult comparisons. Findings showed a trend-level main effect of eBAC on stimulation among carriers of a certain genotype (p = .06) as well as a significant interaction between eBAC and genotype.
A possible explanation for the differences found between adolescents and adults may be that alcohol exerts distinct effects on stimulation during adolescence. It is noteworthy that while we found a negative association between eBAC and stimulation among adolescents, adolescents had overall higher levels of stimulation than adults across all levels of eBAC and this effect was most pronounced when eBAC levels were relatively low. Animal models offer compelling evidence that maturational brain changes may alter adolescents' sensitivity to alcohol's effects and heighten their vulnerability to alcohol self-administration. In particular, adolescent animals are more sensitive than adults to the stimulatory effects of alcohol but less sensitive alcohol's unpleasant effects (Spear, 2011). Researchers have postulated that this confluence of insensitivity to alcohol's unpleasant effects and heightened sensitivity to its reinforcing effects enhances adolescents' susceptibility for developing alcohol-related problems (Nixon & McClain, 2010; Spear & Varlinskaya, 2005).
Methodological differences across studies may also account for the unique response pattern observed in adolescents. We assessed begin-drink ratings in our study and included these measures as covariates in analyses to help isolate the pharmacological effects of alcohol. By contrast, Piasecki et al. (2012) did not capture begin-drink ratings and thus examined associations between post-drink eBAC levels and subjective responses. Youths in our study reported high levels of stimulation at drinking onset, however, which may have obscured our ability to detect initial alcohol-induced increases in stimulation early in the drinking episode. It is possible that begin-drink stimulation reflected adolescents' anticipatory excitement about imminent alcohol use or other aspects of the drinking environment, or that it was confounded by the fact that some begin-drink reports were recorded shortly after drinking onset. However, the negative association between eBAC and end-drink stimulation among adolescents remained significant even when begin-drink stimulation was excluded from analyses and when we restricted analyses to episodes where begin-drink reports were recorded prior to drinking onset. Moreover, adolescents in the present study exhibited similar alcohol dose-related increases in sedation to those observed in adults on sluggish by Piasecki et al. (2012). Similarly, inasmuch as the assessment items buzzed and high measure analogous constructs, alcohol produced similar effects on this measure in adults and adolescents across these studies.
Our findings underscore the clinical relevance of alcohol sensitivities among adolescent problem drinkers. Higher levels of craving prospectively predicted greater volumes of alcohol consumption during the episode. This finding is consistent with adult studies that show craving predicts higher volumes of ad-libitum alcohol consumption in the laboratory (Leeman, Corbin, & Fromme, 2009; Rose et al., 2010). In addition, these findings complement clinical data that shows a strong association between craving during alcohol treatment and posttreatment drinking outcomes in adults (e.g., Higly et al., 2011; Sinha et al., 2011). Craving is central to most contemporary theoretical models of pathological drinking (Drummond, 2001). Consequently, reducing craving is often a focal point of treatment and may advance clinical detection of pathological drinking along an alcohol use disorder continuum (Keyes, Krueger, & Hasin, 2011). Our findings provide further support for the clinical relevance of craving and extend previous work to adolescent problem drinkers.
Finally, our finding that greater post-drink subjective ‘high’ was positively related to post-drink sedation and predicted consumption of fewer subsequent drinks is consistent with research that shows greater sensitivity to these effects is associated with lower drinking levels (Ray et al., 2009). These results build on previous work that demonstrates individuals who are less responsive to the subjective intoxicating effects of alcohol (i.e., ‘high’) drink more heavily and are more likely to develop alcohol-related problems (Schuckit, 1994; Schuckit and Smith, 2001). Our finding that momentary reports of subjective ‘high’ predict subsequent drinking levels, however, suggests that adolescents experience within-person variability in subjective intoxication and that how ‘high’ they feel early in a drinking episode influences how much alcohol they will consume that day. Notably, this within-person effect of subjective ‘high’ remained significant even after controlling for potent predictors of drinking, including sex, alcohol dependence, and recent drinking history. Thus, on the whole these findings illustrate the importance of understanding adolescents' subjective experience when they drink and highlight two specific subjective responses, namely craving and subjective ‘high,’ that appear especially important targets for intervention efforts.
These results must be interpreted in the context of the study limitations. The low range of eBAC levels examined in this study tempers our findings. Most alcohol administration studies evaluate subjective alcohol effects at peak BAC levels of approximately 0.08g/dl (Quinn & Fromme, 2011), which is higher than the typical level reached in this study. Furthermore, adolescent-adult comparisons were restricted to lower alcohol doses because adults only recorded subjective responses after the first two drinks of each episode. Animal research suggests that adolescents and adults exhibit similar patterns of alcohol reactivity at higher doses of alcohol (Spear, 2011) and our observation that alcohol effects on stimulation begin to converge in adolescents and adults at higher doses suggests this pattern may generalize to humans. Therefore, the possibility that alcohol produces a different response profile among adolescents at higher doses is an important question for future research. Another inherent limitation of our EMA approach is our inability to capture the full spectrum of biphasic alcohol effects. These findings do not characterize adolescents' subjective responses during the descending limb. In addition, adolescent-adult comparisons were limited to stimulation and craving. Whether adolescents differ from adults in other responses to alcohol remains untested.
Other considerations include the lack of a placebo condition, modest sample size, and the fact that participants were recruited for larger pharmacotherapy trials. This selection criterion was designed to generate samples comprised of problem drinkers. Notably, the majority of our adolescent sample met diagnostic criteria for an AUD and all adolescent participants experienced clinically significant alcohol-related problems. We believe this approach afforded the most clinically meaningful test of our hypotheses. The findings of this study may not generalize to the broader population of adolescent drinkers, however, or to social drinkers and alcohol naïve adolescents. It is noteworthy, however, that our findings are consistent with the only alcohol administration study with underage alcohol naïve youths. Additionally, although stimulation and sedation did not predict subsequent drinking levels in our GEE models, drinking levels were positively associated with stimulation in bivariate correlations and negatively associated with sedation (see Table 2). Multicollinearity between begin- and end-drink ratings may have contributed to the lack of significance in GEE models. Finally, there is considerable heterogeneity across individuals in terms of subjective responses to alcohol (Morean & Corbin, 2010; Quinn & Fromme, 2011). In this initial study, our goal was to provide previously unavailable data on subjective responses to alcohol among adolescent problem drinkers in their natural environment. Our sample size, however, was too small and homogeneous to examine individual differences that may moderate alcohol's effects. Further research is needed to identify the characteristics that influence how different subgroups of youths respond to alcohol.
On balance, these findings provide not only novel real-time information on how alcohol affects adolescent problem drinkers but also evidence supporting the feasibility of using this methodology with youth. Notable strengths include participants' high EMA compliance and the strong correlations observed between EMA-based drinking data and data collected using the TLFB interview, the gold standard for measuring alcohol consumption. These findings strengthen the inferences derived from the study. Other strengths include the well-characterized sample, the comparison of alcohol responses across adolescents and adults, and the external validity of the findings. This work demonstrates that EMA methods allow for a rich characterization of adolescents' alcohol use, subjective responses to alcohol, and their reciprocal effects on each other.
Acknowledgments
The National Institute of Alcohol Abuse and Alcoholism at the National Institutes of Health supported this research (AA017273, AA019681, AA07850). We thank Bethany Rallis, Justin Souliere, Jacqueline Lee, and Jason Frezza for their assistance with this project.
References
- American Psychiatric Association. Diagnostic and Statistical Manual of Mental Disorders. 4th, Text Revision. Washington, DC: American Psychiatric Association; 2000. [Google Scholar]
- Behar D, Berg CJ, Rapoport JL, Nelson W, Linnoila M, Cohen M, Bozevich C, Marshall T. Behavioral and physiological effects of ethanol in high-risk and control children: A pilot study. Alcoholism: Clinical and Experimental Research. 1983;7(4):404–410. doi: 10.1111/j.1530-0277.1983.tb05495.x. [DOI] [PubMed] [Google Scholar]
- Bohn MJ, Krahn DD, Staehler BA. Development and initial validation of a measure of drinking urges in abstinent alcoholics. Alcoholism: Clinical and Experimental Research. 1995;19:600–606. doi: 10.1111/j.1530-0277.1995.tb01554.x. [DOI] [PubMed] [Google Scholar]
- Buu A, Wang W, Schroder SA, Kalaida NL, Puttler LI, Zucker RA. Developmental emergence of alcohol use disorder symptoms and their potential as early indicators for progression to alcohol in dependence in a high risk sample: A longitudinal study from childhood to early adulthood. Journal of Abnormal Psychology. 2012;121:897–908. doi: 10.1037/a0024926. [DOI] [PMC free article] [PubMed] [Google Scholar]
- Drummond DC. Theories of drug craving, ancient and modern. Addiction. 2001;96:33–46. doi: 10.1080/09652140020016941. [DOI] [PubMed] [Google Scholar]
- Earleywine M. Measurement issues in the assessment of acute changes in responses to alcohol. Experimental and Clinical Psychopharmacology. 1995;4:382–388. [Google Scholar]
- Eaton DK, Kann L, Kinchen S, Shanklin S, Flint KH, Hawkins J, Harris WA, Lowry R, McManus T, Chyen D, Whittle L, Lim C, Wechler H. Youth risk behavior surveillance – United States, 2011: Surveillance summaries. Morbidity and Mortality Weekly Report. 2012;61:1–162. [PubMed] [Google Scholar]
- First MB, Spitzer RL, Gibbon M. Structured Clinical Interview for DSM-IV Axis I Disorders – Patient Edition (SCID-IV-P, Version 2.0) New York: Biometrics Research Department, New York State Psychiatric Institute; 1995. [Google Scholar]
- Giedd JN. Structural magnetic resonance imaging of the adolescent brain. Annals of the New York Academy of Sciences. 2004;1021:77–85. doi: 10.1196/annals.1308.009. [DOI] [PubMed] [Google Scholar]
- Grant BF, Dawson DA, Stinson FA, Chou SP, Dufour MC, Pickering RP. The 12-month prevalence and trends in DSM-IV alcohol abuse and dependence: United States, 1991-1992 and 2001-2002. Drug and Alcohol Dependence. 2004;74:223–34. doi: 10.1016/j.drugalcdep.2004.02.004. [DOI] [PubMed] [Google Scholar]
- Heilig M, Thorsell A, Sommer WH, Hansson AC, Ramchandani VA, George DT, Hommer D, Barr CS. Translating neuroscience of alcoholism into clinical treatments: From blocking the buzz to curing the blues. Neuroscience and Biobehavioral Reviews. 2010;35:334–344. doi: 10.1016/j.neubiorev.2009.11.018. [DOI] [PMC free article] [PubMed] [Google Scholar]
- Higly AE, Crane NA, Spadoni AD, Quello SB, Goodell V, Mason BJ. Craving in response to stress induction in a human laboratory paradigm predicts treatment outcome in alcohol dependent individuals. Psychopharmacology. 2011;218:121–129. doi: 10.1007/s00213-011-2355-8. [DOI] [PMC free article] [PubMed] [Google Scholar]
- Hingson R, Kenkel D. Social, health, and economic consequences of underage drinking. In: Bonnie RJ, O'Connell ME, editors. National Research Council and Institute of Medicine. Washington, DC: National Academics Press; 2004. [Google Scholar]
- Hustad JT, Carey KB. Using calculations to estimate blood alcohol concentrations for naturally occurring drinking episodes: A validity study. Journal of Studies on Alcohol. 2005;66:130–138. doi: 10.15288/jsa.2005.66.130. [DOI] [PubMed] [Google Scholar]
- Kaufman J, Birmaher B, Brent D, Rao U, Flynn C, Moreci P, Williamson D, Ryan N. Schedule for affective disorders and schizophrenia for school-age children-present version and lifetime version (K-SADS-PL): initial reliability and validity data. Journal of the American Academy of Child and Adolescent Psychiatry. 1997;36:980–988. doi: 10.1097/00004583-199707000-00021. [DOI] [PubMed] [Google Scholar]
- Keyes KM, Krueger RF, Grant BF, Hasin DS. Alcohol craving and the dimensionality of alcohol disorders. Psychological Medicine. 2011;41:629–640. doi: 10.1017/S003329171000053X. [DOI] [PMC free article] [PubMed] [Google Scholar]
- King AC, de Wit H, McNamara PJ, Coa D. Rewarding, stimulant, and sedative alcohol responses and relationship to future binge drinking. Archives of General Psychiatry. 2011;68:389–399. doi: 10.1001/archgenpsychiatry.2011.26. [DOI] [PMC free article] [PubMed] [Google Scholar]
- Leeman RF, Corbin WR, Fromme K. Craving predicts within session drinking behavior following placebo. Personality and Individual Differences. 2009;46:693–698. doi: 10.1016/j.paid.2009.01.024. [DOI] [PMC free article] [PubMed] [Google Scholar]
- Leeman RF, Heilig M, Cunningham CL, Stephens DN, Duka T, O'Malley S. Ethanol consumption: how should we measure it? Achieving consilience between human and animal phenotypes. Addiction Biology. 2010;15:109–124. doi: 10.1111/j.1369-1600.2009.00192.x. [DOI] [PMC free article] [PubMed] [Google Scholar]
- Martin CS, Earleywine M, Musty RE, Perrine MW, Swift RM. Development and validation of the Biphasic Alcohol Effects Scale. Alcoholism: Clinical and Experimental Research. 1993;17:140–146. doi: 10.1111/j.1530-0277.1993.tb00739.x. [DOI] [PubMed] [Google Scholar]
- Matthews DB, Miller WR. Estimating blood alcohol concentration: Two computer programs and their applications in therapy and research. Addictive Behaviors. 1979;4:55–60. doi: 10.1016/0306-4603(79)90021-2. [DOI] [PubMed] [Google Scholar]
- Morean ME, Corbin WR. Subjective response to alcohol: A critical review of the literature. Alcoholism: Clinical and Experimental Research. 2010;34:385–395. doi: 10.1111/j.1530-0277.2009.01103.x. [DOI] [PubMed] [Google Scholar]
- National Institute on Alcohol Abuse and Alcoholism. Helping patients who drink too much: A clinician's guide (NIH Publication No 07-3769) Bethesda, MD: Author; 2005. [Google Scholar]
- Nixon K, McClain JA. Adolescence is a critical window for developing an alcohol use disorder: current findings in neuroscience. Current Opinion in Psychiatry. 2010;23:227–232. doi: 10.1097/YCO.0b0132833864fe. [DOI] [PMC free article] [PubMed] [Google Scholar]
- Palta M. Quantitative methods in population health: Extensions of ordinary regression. Hoboken, NJ: John Wiley & Sons, Inc; 2003. [Google Scholar]
- Piasecki TM, Wood PK, Shiffman S, Sher KJ, Heath AC. Responses to alcohol and cigarette use during ecologically assessed drinking episodes. Psychopharmacology. 2012;223:331–344. doi: 10.1007/s00213-012-2721-1. [DOI] [PMC free article] [PubMed] [Google Scholar]
- Quinn PD, Fromme K. Subjective response to alcohol challenge: A quantitative review. Alcoholism: Clinical and Experimental Research. 2011;35:1759–1770. doi: 10.1111/j.1530.0277.2011.01521.x. [DOI] [PMC free article] [PubMed] [Google Scholar]
- Ray LA, Hutchison KE. A polymorphism of the mu-opioid receptor gene (OPRM1) and sensitivity to the effects of alcohol in humans. Alcoholism: Clinical and Experimental Research. 2004;28:1789–1795. doi: 10.1097/01.ALC.0000148114.34000.B9. [DOI] [PubMed] [Google Scholar]
- Ray LA, MacKillop J, Leventhal A, Hutchison KE. Catching the alcohol buzz: An examination of the latent factor structure of subjective intoxication. Alcoholism: Clinical and Experimental Research. 2009;33:2154–2161. doi: 10.1111/j.1530-0277.2009.01-053.x. [DOI] [PMC free article] [PubMed] [Google Scholar]
- Ray LA, MacKillop J, Monti PM. Subjective responses to alcohol consumption as endophenotypes: Advancing behavioral genetics in etiological and treatment models of alcoholism. Substance Use & Misuse. 2010;45:1742–1765. doi: 10.3109/10826084.2010.482-427. [DOI] [PMC free article] [PubMed] [Google Scholar]
- Ray LA, Miranda R, Jr, Tidey J, McGeary JE, MacKillop J, Gwaltney C, Rohsenow DJ, Swift RM, Monti PM. Polymorphisms of the μ-opioid receptor and dopamine D4 receptor genes and subjective responses to alcohol in the natural environment. Journal of Abnormal Psychology. 2010;119:115–125. doi: 10.1037/a001-7550. [DOI] [PMC free article] [PubMed] [Google Scholar]
- Rose AK, Hobbs M, Klipp L, Bell S, Edwards K, O'Hara P, Drummond C. Monitoring drinking behaviour and motivation to drink over successive doses of alcohol. Behavioural Pharmacology. 2010;21:710–718. doi: 10.1097/FBP.0b013e32833fa72b. [DOI] [PubMed] [Google Scholar]
- Rueger SY, McNamara PJ, King AC. Expanding the utility of the biphasic alcohol effects scale (BAES) and initial psychometric support for the brief-BAES (B- BAES) Alcoholism: Clinical and Experimental Research. 2009;33:916–924. doi: 10.1111/j.1530-0277.2009.00914.x. [DOI] [PMC free article] [PubMed] [Google Scholar]
- Schuckit MA. Subjective responses to alcohol in sons of alcoholics and control subjects. Archives of General Psychiatry. 1984;41:879–884. doi: 10.1001/archpsyc.1984.017-90200061008. [DOI] [PubMed] [Google Scholar]
- Schuckit MA. Low level of response to alcohol as a predictor of future alcoholism. American Journal of Psychiatry. 1994;151:184–189. doi: 10.1176/ajp.151.2.184. [DOI] [PubMed] [Google Scholar]
- Schuckit MA, Smith TL. The clinical course of alcohol dependence associated with a low level of response to alcohol. Addiction. 2001;96:903–910. doi: 10.1046/j.1360-0443.2001.96690311.x. [DOI] [PubMed] [Google Scholar]
- Shiffman S. Ecological momentary assessment (EMA) in studies of substance use. Psychological Assessment. 2009;4:486–497. doi: 10.1037/a0017074. [DOI] [PMC free article] [PubMed] [Google Scholar]
- Sinha R, Fox HC, Hong KA, Hansen J, Tuit K, Kreek MJ. Effects of adrenal sensitivity, stress- and cue-induced craving, and anxiety on subsequent alcohol relapse and treatment outcomes. Archives of General Psychiatry. 2011;68:942–952. doi: 10.1001/archgenpsychiatry.2011.49. [DOI] [PMC free article] [PubMed] [Google Scholar]
- Sobell LD, Sobell MD. Timeline follow-back: A technique for assessing self-reported alcohol consumption. In: Litten R, Allen J, editors. Measuring Alcohol Consumption. Clifton, NJ: Human Press; 1992. pp. 41–65. [DOI] [Google Scholar]
- Spear LP. Adolescent neurobehavioral characteristics, alcohol sensitivities, and intake: Setting the stage for alcohol use disorders? Child Development Perspectives. 2011;5:231–238. doi: 10.1111/j.1750-8606.2011.00182.x. [DOI] [PMC free article] [PubMed] [Google Scholar]
- Spear LP, Varlinskaya EI. Adolescence: Alcohol sensitivity, tolerance, and intake. In: Galanter M, editor. Recent Developments in Alcoholism, Volume 17: Alcohol Problems in Adolescents and Young Adults. Hingham, MA: Kluwer Academic Publishers; 2005. pp. 143–159. [PubMed] [Google Scholar]
- Spear LP, Varlinskaya EI. Sensitivity to ethanol and other hedonic stimuli in an animal model of adolescence: Implications for prevention science? Developmental Psychobiology. 2010;52:236–243. doi: 10.1002/dev.20457. [DOI] [PMC free article] [PubMed] [Google Scholar]
- Swendsen J, Burstein M, Case B, Conway KP, Dierker L, He J, Merikangas KR. Use and abuse of alcohol and illicit drugs in US adolescents: Results of the National Comorbidity Survey – Adolescent supplement. Archives of General Psychiatry. 2012;69:390–398. doi: 10.1001/archgenpsychiatry.2011.1503. [DOI] [PMC free article] [PubMed] [Google Scholar]
- Tidey JW, Monti PM, Rohsenow DJ, Gwaltney CJ, Miranda R, Jr, McGeary JE, MacKillop J, Swift RM, Abrams DB, Shiffman S, Paty JA. Moderators of naltrexone's effects on drinking, urge and alcohol effects in the natural environment. Alcoholism: Clinical and Experimental Research. 2008;32:58–66. doi: 10.1111/j.1530-0277.2007.00545.x. [DOI] [PMC free article] [PubMed] [Google Scholar]
- White HR, Labouvie EW. Towards the assessment of adolescent problem drinking. Journal of Studies on Alcohol. 1989;50:30–37. doi: 10.15288/jsa.1989.50.30. [DOI] [PubMed] [Google Scholar]
- Zeger SL, Liang K, Albert PS. Models for longitudinal data: A generalized estimating equation approach. Biometrics. 1988;44:1049–1060. [PubMed] [Google Scholar]