Abstract
The structural and molecular heterogeneities of biological tissues demand the interrogation of the samples with multiple energy sources and provide visualization capabilities at varying spatial resolution and depth scales for obtaining complementary diagnostic information. A novel multi-modal imaging approach that uses optical and acoustic energies to perform photoacoustic, ultrasound and fluorescence imaging at multiple resolution scales from the tissue surface and depth is proposed in this paper. The system comprises of two distinct forms of hardware level integration so as to have an integrated imaging system under a single instrumentation set-up. The experimental studies show that the system is capable of mapping high resolution fluorescence signatures from the surface, optical absorption and acoustic heterogeneities along the depth (>2cm) of the tissue at multi-scale resolution (<1µm to <0.5mm).
OCIS codes: (110.5120) Photoacoustic imaging, (110.7170) Ultrasound, (170.2520) Fluorescence microscopy, (170.3880) Medical and biological imaging, (170.0110) Imaging systems, (170.3890) Medical optics instrumentation
1. Introduction
Advances in imaging technologies enhance the ability to probe complex and dynamic biological processes and offer capabilities to accelerate basic research and clinical diagnosis. The visualization of structural and molecular behavior of the tissue constituents reveals the specific structural and molecular states of the tissue and often aids in early disease diagnosis. A variety of imaging modalities have been evolved over the years where each of the imaging modalities are operated with a specific type of energy applied into the tissue [1]. Tissues are composed of complex and diverse structures and molecules with varying dimensions and molecular makeup [2]. Further, during energy-tissue interaction, individual tissue constituents respond differently to each specific forms of energy input. Therefore, the visualization capabilities of specific imaging modalities in terms of the achievable penetration depth, resolution and type of derived information are directly linked to the type of input energy. Hence, the most widely used approach is to sequentially interrogate the subject with multiple imaging modalities by moving the sample across the specific lines of imaging machines. Although, this approach satisfied certain imaging requirements, they often failed to provide an accurate registration of the multi-modal images obtained from moving structures as well they couldn’t measure two different parameters simultaneously and correlate the dynamic changes in those parameters [3]. For these reasons, significant research interests were drawn towards integrating two or more imaging modalities into a single imaging unit. Such systems which are classified as multimodality imaging systems integrate strengths of two or more imaging modalities and eliminate the weakness of an individual modality.
As proposed in literature [4], typically two further stages of integration are highly sought after with regard to the development of a multimodal imaging system. The first approach would be to have a system that is capable of acquiring data from two or more imaging modes simultaneously or near-simultaneously. The second approach typically requires the instrument to be equipped with a single sensor or detector that can detect radiations from at least two modalities [3, 5]. The unique visualization capabilities offered by various optical imaging techniques have led to a rapid adaptation of optical imaging modalities for establishing new multimodal imaging platforms. Amongst them, integration of hybrid optical imaging techniques such as photoacoustic (PA) imaging with other optical imaging modalities or with complementary imaging modalities such as ultrasound (US) imaging has gained considerable interest and a few have been already reported. These include dual modality imaging systems such as combined PA - US [6–14], PAI – diffuse optical tomography (DOT) [15, 16], PA – fluorescence imaging or confocal microscopy [17–19] and PA – optical coherence tomography (OCT) [20–24]. Further, PA based tri-modal imaging systems such as integrated OCT, PA and US [25], integrated PA, US and thermoacoustic (TA) [26, 27] and integrated PA, US and elasticity imaging [28–30] have been also reported. Recently, integrated PA – fluorescence imaging systems which could offer tremendous capabilities for future endoscopic applications were also demonstrated [31–33].
Foreseeing the imaging requirements of the future biomedical research community, it is imperative to devise new multimodality imaging platforms that provide complementary diagnostic information. An effective combination towards this direction would be to blend the unique imaging capabilities of photoacoustic, ultrasound and fluorescence techniques into a single imaging platform. While, ultrasound imaging primarily offers mesoscopic mapping of various acoustic heterogeneities along the depth of the tissue, optical imaging would typically target the mapping of various optical heterogeneities located in the tissue. Further, the inherent penetration depth limitations in conventional optical imaging modalities could be surmounted by adopting photoacoustic imaging which maps optical absorption heterogeneities at ultrasound resolution along the tissue depth. Therefore, considering the unique capabilities of various optical imaging techniques in terms of their spatial resolution range and penetration depth, the preferred optical imaging modalities to be further examined would be fluorescence microscopy for surface imaging and photoacoustic imaging for deep tissue optical interrogation. Thus, by integrating the afore mentioned three imaging techniques, the multimodal system would typically derive and assimilate multi-scale complementary information from the targeted site through co-registered images of optical absorption, echogenicity and fluorescence contrasts.
In this perspective, this paper demonstrates a new multimodal imaging approach and reports on the various investigations performed towards the establishment of a tri-modal imaging platform (PAUSFI system) which can perform near-simultaneous (multimodal images are acquired in less than 1 sec) photoacoustic (PA) and ultrasound (US) and fluorescence imaging (FI). The investigations performed were mainly targeted to establish the potential capabilities of the system to map the three distinct tissue properties at multiple resolution scales. This would thereby enable the tri-modal imaging system to derive and assimilate complementary diagnostic information from the tissue where the inherent limitations of an individual imaging modality are surmounted by the associated imaging modality.
2. Materials and methods
2.1 Integration methodology
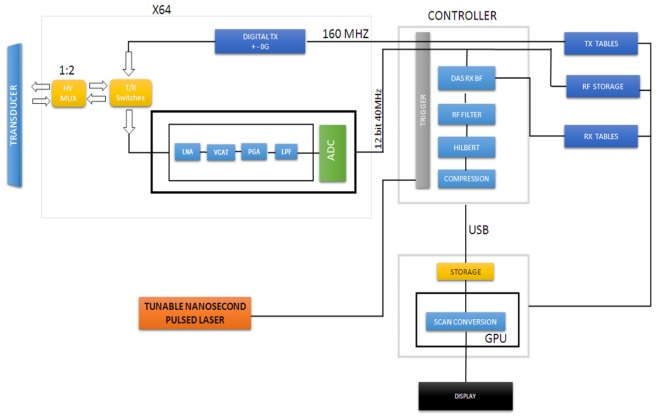
The proposed configuration, shown in Fig. 1, comprised of two distinct types of hardware level integration, namely the excitation hardware and the receiver hardware. The first approach involved the integration of the fluorescence imaging system with the ultrasound and photoacoustic imaging systems where the signal excitation source comprising the tunable nanosecond pulsed laser was used for the multimodal signal generation. The tunable pulsed laser simultaneously excited the fluorescence and photoacoustic signals and the B-mode ultrasound frames were formed between the laser pulses.
Fig. 1.
Block diagram of the integrated ultrasound and photoacoustic imaging system high voltage multiplexer (HV MUX), transmit and receive (T/R), low noise amplifier (LNA), voltage controlled attenuator (VCAT), programmable gain amplifier (PGA) and low pass filter (LPF), analog to digital converted (ADC), delay and sum (DAS), receive (RX), beamformer (BF), transmit (TX), radio frequency (RF), universal serial bus (USB), graphics processing unit (GPU).
The second type of integration concerned the firmware integration for ultrasound and photoacoustic imaging. Since ultrasound and photoacoustic signals exhibit similar physical principles, the same set of receiving hardware was configured to acquire and process both the ultrasound and photoacoustic signals. The concerned receiver firmware together with a linear array piezoelectric transducer was shared to form the ultrasound and photoacoustic images whereas the sCMOS (scientific complementary metal-oxide-semiconductor) camera was used to form the fluorescence images.
The integrated ultrasound and photoacoustic imaging platforms of the system were synchronised by the trigger unit [Fig. 1] where the trigger unit signalled the beamformer controller to switch between the ultrasound and photoacoustic modes. At every laser pulse, the Q-switch synchro out of the laser control unit triggered the beamformer controller to disable the transmit controller of the integrated PA/US imaging system. The receive beamformer was then set to acquire the resultant photoacoustic signals. Further, ultrasound image frames were formed between the laser pulses by enabling the transmit controller followed by the beamforming of the corresponding echo signals. At every read operation, the raw photoacoustic data would be acquired and processed like any other ultrasound line with the only difference in the beamformer coefficients (speed of sound is one way in PA mode) and lack of transmit operation. The raw radio frequency (RF) signals were then apodized, beamformed, filtered, Hilbert transformed or envelope/detected, log compressed and scan converted to form the respective images.
2.2 Phantom description
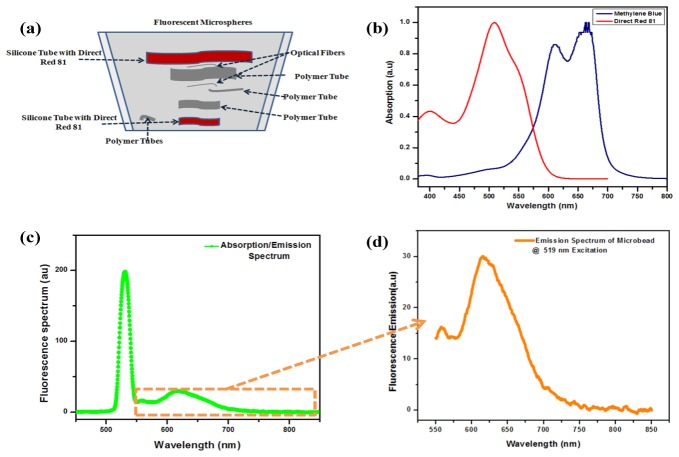
The phantom tissue was fabricated with suitable signal sources for all the three different imaging modalities so as to establish the potential imaging capabilities of the system to map the three distinct tissue properties. A five layered silicone phantom sample was fabricated based on a reported procedure [34] so as to achieve an absorption coefficient and reduced scattering coefficient of 0.05 cm−1 and 8.2 cm−1 respectively. Approximately 220 ml of room temperature vulcanizing (RTV) silicone (ELASTOSIL® RT 601 A/B, Wacker Chemicals South Asia Pte Ltd, Singapore), 1.25 mg of carbon black and 9 ml of Intralipid-20% (I141, Sigma-Aldrich Corp.) were mixed with the 22 ml of curing agent. The base material was subjected to degassing using a vacuum chamber to minimize the undesired acoustic speckles. Polymer tubes and tubular silicone structures together with two distinct dyes namely, Direct Red 81(195251, Sigma-Aldrich Corp.) and Methylene Blue dyes were used to simulate the optical absorbers along the thickness of the silicone phantom as shown in Fig. 2(a). Optical absorbers were fabricated with dyes having distinct absorption spectra [Fig. 2(b)] and the acoustic reflectors were formed using strands of optical fiber and polymer tubes [Fig. 2(a)] implanted along the phantom thickness. Polymer tubes were filled with Methylene Blue dye and silicone based absorbers were fabricated by mixing Direct Red 81 with portions of the uncured silicone host material. Further, fluorescence features were simulated by administering the phantom surface with carboxylate-modified polystyrene microspheres (F8819, FluoSpheres ®, Molecular Probes®, Life Technologies). The polystyrene microspheres coated with Nile red dye had an average diameter of ≈1μm and emission peak at 613 nm for 519 nm excitation as represented in Figs. 2(c) and 2(d). 1 ml of the polystyrene spheres solution was diluted in 20 ml methanol as a precursor. 0.25 ml of diluted PS sample containing the polystyrene spheres was then uniformly spread over the silicon phantom matrix as represented in Fig. 2(a).
Fig. 2.
Silicone phantom; a) Schematic of the phantom tissue with simulated target locations, b) Absorption spectra of the absorbing dyes, c) Fluorescence spectrum of the fluorescent microbead, d) Emission spectrum of the microbead at 519 nm excitation.
2.3 Experimental set-up
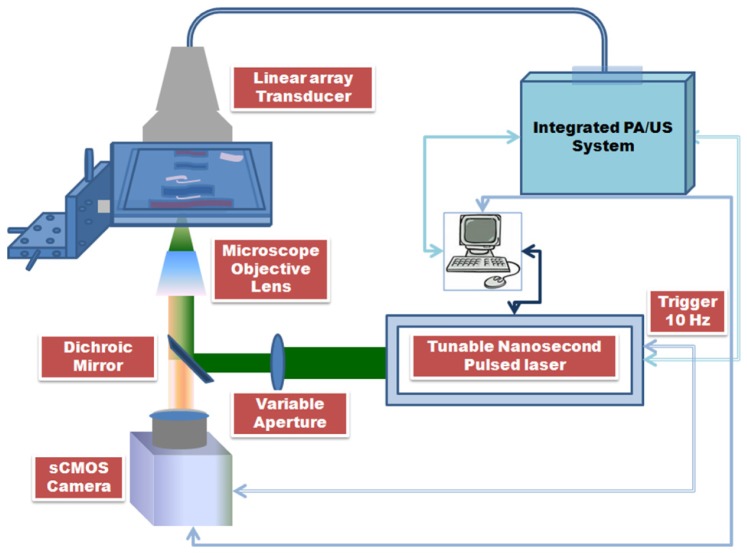
The experimental set-up shown in Fig. 3 used the tunable nanosecond pulsed laser (Vibrant II, Opotek, Inc.) as the excitation source for fluorescence and PA imaging. The fluorescence microscopy was performed in epi-illumination configuration and PA imaging was performed in the transmission mode. The laser system operated at 519 nm excitation wavelength had a pulse repetition rate of 10 Hz and 5-7 ns pulse width. The excitation beam was directed towards the objective lens turret mounted with microscope objective lenses through a dichroic beamsplitter (LM01-552-25, Semrock, Inc.). The excitation beam was focused onto the sample surface using a microscope objective lens (UMPlanFl 50X, Olympus Corp.) with numerical aperture (NA) 0.80. Uniform illumination across the view-field of the microscope objective lens was formed by adequately filling the rear aperture of the objective lens. The fluence on the phantom surface was limited to approximately 13mJ/cm2 which is within the American National Standards Institute (ANSI) safety standard for 519 nm excitation [35]. The fluorescence signatures imaged by the objective lens were further propagated towards the sCMOS camera (Neo sCMOS. Andor Technology) through the dichroic beamsplitter and the emission filter (HQ560/50m, Chroma Tech Corp.) mounted along the emission optical path. The front illuminated sCMOS camera had 2560 x 2160 (5.5 Megapixels) active pixels with pixel size of 6.5 μm and sensor size (width x height) of 16.6 x 14.0 mm (21.8 mm diagonal). Ultrasound and photoacoustic signals were acquired using the 128 element linear array piezoelectric transducer (Prosonic Corp.). The multi-element transducer operated at center frequency (−6 dB, average) of 7.699 MHz had an element pitch of 300 µm, 19 mm elevation focus, 6 mm elevation aperture and −6 dB fractional bandwidth of 80.881% . Azimuth length and −20 dB ring-down time (average) of the transducer were determined to be 38.40 mm and 0.171 µs respectively.
Fig. 3.
Schematic of the integrated photoacoustic, ultrasound and fluorescence imaging system.
2.4 Resolution of the PA/US imaging system
The resolution of the PA/US system operated at acoustic resolution mode was determined by analyzing the ultrasound beam properties given by the point spread function (PSF) of the system. The lateral and axial beam profiles of the PA/US imaging system were studied by varying the transducer focal length as well as the position of a point test target. This involved the usage of water-stainless steel interface with a reflection coefficient of 0.58 dB below the perfect reflector. A stainless steel wire having a 90 µm diameter stretched and fixed across the acrylic tank filled with de-ionized water formed to be the test target. The linear array transducer was made to position perpendicular to the metal wire. The distance between the transducer surface and the metal wire was fixed exactly at the pre-determined pulse echo focal distance of the transducer. Once the focal point and the transducer element that formed the right acoustic line were determined, the ultrasound pulser was subjected to a voltage sequence of ± 40 V to generate flash waves. The transducer was then translated across the plane perpendicular to the metal wire until the peak amplitude in the acoustic line was observed from the amplitude mode (A-mode) readings. The −3 dB attenuation point of the PSF profile shown in Fig. 4(a) gave the axial resolution of the US and PA imaging systems to be 151 ± 2.24 µm.
Fig. 4.
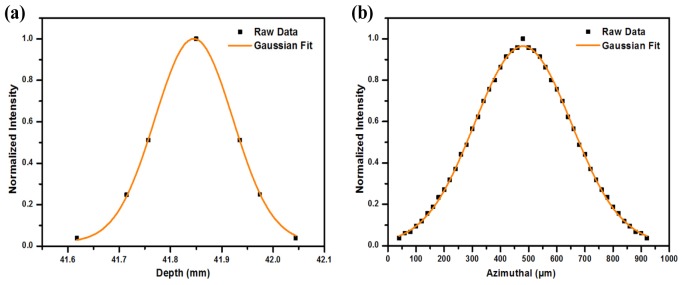
Resolution of the PA/US imaging system; a) Axial resolution, b) In–plane resolution
The in-plane resolution was also measured in a similar way by translating the transducer across the plane perpendicular to the metal wire with a step resolution of 20 µm across a range of 500 µm. The peak amplitudes of the obtained echo signal were recorded for each step movement to derive the resolution profile across the lateral plane as shown in Fig. 4(b). The −3 dB attenuation point of the PSF profile was measured and found to be 345 ± 2.53 µm. This formed the in-plane resolution of the PA/US imaging system.
3. Results and discussion
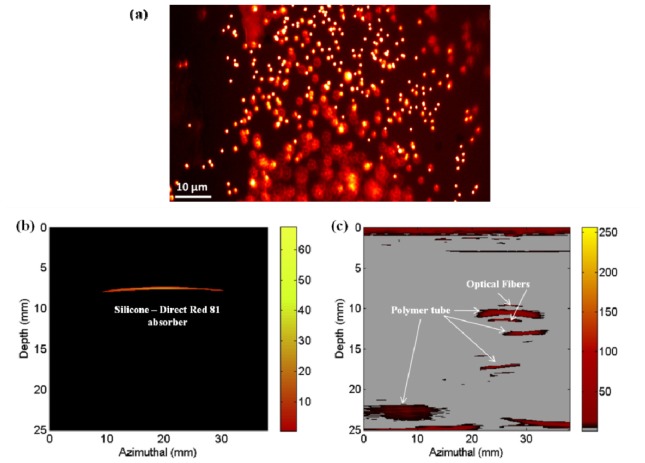
Multimodal imaging of the silicone phantom was performed by mounting the phantom with its fluorescent surface oriented towards the front focal plane of the microscope objective lens. Photoacoustic and fluorescence imaging studies were performed at 519 nm excitation wavelength. Figs. 5(a)-5(c) shows the fluorescence, photoacoustic and ultrasound images obtained respectively from the proposed multimodal imaging system.
Fig. 5.
Images obtained from the integrated photoacoustic, ultrasound and fluorescence Imaging system: a) Fluorescence image, b) Photoacoustic image, c) Ultrasound image
Fig. 5(a) shows the image of the fluorescence microspheres mapped using the multimodal imaging system at 519 nm excitation. Micron sized fluorescence signatures from the sample surface were clearly imaged and mapped accordingly. This demonstrates the capability of the proposed integrated multimodal imaging system to map micron sized fluorescence signatures from the sample surface. The optical absorption centers located along the depth of the phantom tissue resulted in the generation of photoacoustic signals to form the photoacoustic image of the Direct Red 81 absorber as shown in Fig. 5(b). However, the reduced laser fluence delivered on to the sample to avoid possible photo and thermal bleaching of the phantom surface imposed limitations to obtain adequate photoacoustic signals from depths greater than 10 mm of the tissue. Further, the optical absorbers holding Methylene Blue were not mapped since the dye had very low absorption at 519 nm. Fig. 5(c) shows the ultrasound image of the tissue mimic with all the acoustic heterogeneities clearly mapped along the entire tissue thickness of 2.5cm. The ultrasound image was devoid of acoustic speckles due to the absence of minute acoustic scatters and air bubbles in the phantom. Since the silicone tubes were fabricated from the same base material, they exhibited similar acoustic properties as the phantom and therefore they were not mapped in the ultrasound image. However, the optical absorption contrast between the silicone tube and the phantom base material resulted in the clear mapping of the silicone tube using photoacoustic imaging. Thus, from the fluorescence, photoacoustic and ultrasound images obtained, it is evident that the proposed multimodality imaging system can perform the required multi-scale imaging of the optical and acoustic heterogeneities from the surface and along the depth of the phantom tissue. Comparison of the tissue features mapped by the three distinct imaging modalities show that, the diagnostic targets failed to be mapped by an imaging technique was however effectively mapped using the associated complementary imaging modality.
4. Conclusion
In conclusion, a new multimodal imaging approach comprising of photoacoustic, ultrasound and fluorescence imaging modalities integrated into a single instrumentation set-up has been conceptualized, established and experimentally demonstrated. The proposed multimodal imaging system which involved hardware integration at the excitation level used a tunable nanosecond pulsed laser for the simultaneous generation of the fluorescence and photoacoustic signals. Further, a second form of integration at the PA/US receiver performed photoacoustic and ultrasound imaging with a single firmware platform. The experimental results show that the proposed integrated photoacoustic, ultrasound, and fluorescence imaging (PAUSFI) system could derive and assimilate complementary optical and acoustic heterogeneities located along the tissue depth with multiple spatial resolutions. Comparing with the imaging capabilities of non-optical multimodal imaging systems, it is worth noting that the proposed PAUSFI system involves the usage of non-ionizing radiations and provides visualization capabilities at higher frame rates and better spatial resolution. Further, by considering the reported optical multimodality systems, to best of our knowledge this is the first system that combines fluorescence, photoacoustic and ultrasound imaging modalities into a single imaging platform. The proposed system is expected to find profound applications in various areas of biomedicine such as in cancer diagnostics, wherein the high resolution FI can be used to image the surface layers such as epithelial layer and PA together with US can be used to image the various tissue anomalies located along the depth. Although the use of low repetition rate laser provides considerably good energy for adequate PA signal generation, it can induce limitations to the achievable frame rates and fluorescence emission efficiencies obtained from biological samples. However, by using high repetition rate lasers we can enhance the frame rates, fluorescence efficiencies and avoid potential fluorescence saturation at the expense of having a trade-off with the energy per pulse for the excitations. Further, the usage of high frequency focused ultrasonic transducers that are co-axially aligned to the optical excitation path and using near-infrared excitation could provide co-registered multimodal images with improved spatial resolution and localization from greater tissue depths. It is anticipated that the proposed multi-modal imaging approach is expected to open up new niches in the field of biomedical imaging.
Acknowledgments
This research has been supported through COLE-EDB funding and by Nanyang Technological University, Singapore.
References and links
- 1.Weissleder R., Pittet M. J., “Imaging in the era of molecular oncology,” Nature 452(7187), 580–589 (2008). 10.1038/nature06917 [DOI] [PMC free article] [PubMed] [Google Scholar]
- 2.Tuchin V. V., “Tissue optics: Light scattering methods and instruments for medical diagnosis ed 2,” Bellingham SPIE Publications (2007). [Google Scholar]
- 3.Cherry S. R., “Multimodality in vivo imaging systems: Twice the power or double the trouble?” Annu. Rev. Biomed. Eng. 8(1), 35–62 (2006). 10.1146/annurev.bioeng.8.061505.095728 [DOI] [PubMed] [Google Scholar]
- 4.Cherry S. R., “Multimodality imaging: beyond PET/CT and SPECT/CT,” Semin. Nucl. Med. 39(5), 348–353 (2009). 10.1053/j.semnuclmed.2009.03.001 [DOI] [PMC free article] [PubMed] [Google Scholar]
- 5.Townsend D. W., “Multimodality imaging of structure and function,” Phys. Med. Biol. 53(4), R1–R39 (2008). 10.1088/0031-9155/53/4/R01 [DOI] [PubMed] [Google Scholar]
- 6.Kolkman R. G. M., Brands P. J., Steenbergen W., van Leeuwen T. G., “Real-time in vivo photoacoustic and ultrasound imaging,” J. Biomed. Opt. 13(5), 050510 (2008). 10.1117/1.3005421 [DOI] [PubMed] [Google Scholar]
- 7.Niederhauser J. J., Jaeger M., Lemor R., Weber P., Frenz M., “Combined ultrasound and optoacoustic system for real-time high-contrast vascular imaging in vivo,” IEEE Trans. Med. Imaging 24(4), 436–440 (2005). 10.1109/TMI.2004.843199 [DOI] [PubMed] [Google Scholar]
- 8.Rousseau G., Blouin A., Monchalin J.-P., “Non-contact photoacoustic tomography and ultrasonography for tissue imaging,” Biomed. Opt. Express 3(1), 16–25 (2012). 10.1364/BOE.3.000016 [DOI] [PMC free article] [PubMed] [Google Scholar]
- 9.Montilla L. G., Olafsson R., Bauer D. R., Witte R. S., “Real-time photoacoustic and ultrasound imaging: a simple solution for clinical ultrasound systems with linear arrays,” Phys. Med. Biol. 58(1), N1–N12 (2013). 10.1088/0031-9155/58/1/N1 [DOI] [PubMed] [Google Scholar]
- 10.Hsieha B.-Y., Lia P.-C., “Real-time intravascular ultrasound/photoacoustic imaging system with omni-directional light excitation,” Photons Plus Ultrasound: Imaging and Sensing 8223, 822319 (2012). [Google Scholar]
- 11.Needles A., Heinmiller A., Sun J., Theodoropoulos C., Bates D., Hirson D., Yin M., Foster F. S., “Development and initial application of a fully integrated photoacoustic micro-ultrasound system,” IEEE Trans. Ultrason. Ferroelectr. Freq. Control 60(5), 888–897 (2013). 10.1109/TUFFC.2013.2646 [DOI] [PubMed] [Google Scholar]
- 12.Alqasemi U., Li H., Yuan G., Kumavor P., Zanganeh S., Zhu Q., “Real-time interlaced ultrasound and photoacoustic system for in vivo ovarian tissue imaging,” Photons Plus Ultrasound: Imaging and Sensing 8581, 85814S (2013). [Google Scholar]
- 13.Harrison T., Ranasinghesagara J. C., Lu H., Mathewson K., Walsh A., Zemp R. J., “Combined photoacoustic and ultrasound biomicroscopy,” Opt. Express 17(24), 22041–22046 (2009). 10.1364/OE.17.022041 [DOI] [PubMed] [Google Scholar]
- 14.Wei W., Li X., Zhou Q., Shung K. K., Chen Z., “Integrated ultrasound and photoacoustic probe for co-registered intravascular imaging,” J. Biomed. Opt. 16(10), 106001 (2011). 10.1117/1.3631798 [DOI] [PMC free article] [PubMed] [Google Scholar]
- 15.Xi L., Li X., Yao L., Grobmyer S., Jiang H., “Design and evaluation of a hybrid photoacoustic tomography and diffuse optical tomography system for breast cancer detection,” Med. Phys. 39(5), 2584–2594 (2012). 10.1118/1.3703598 [DOI] [PubMed] [Google Scholar]
- 16.Li X., Xi L., Jiang R., Yao L., Jiang H., “Integrated diffuse optical tomography and photoacoustic tomography: phantom validations,” Biomed. Opt. Express 2(8), 2348–2353 (2011). 10.1364/BOE.2.002348 [DOI] [PMC free article] [PubMed] [Google Scholar]
- 17.Razansky D., Ntziachristos V., “Hybrid photoacoustic fluorescence molecular tomography using finite-element-based inversion,” Med. Phys. 34(11), 4293–4301 (2007). 10.1118/1.2786866 [DOI] [PubMed] [Google Scholar]
- 18.Wang Y., Hu S., Maslov K., Zhang Y., Xia Y., Wang L. V., “In vivo integrated photoacoustic and confocal microscopy of hemoglobin oxygen saturation and oxygen partial pressure,” Opt. Lett. 36(7), 1029–1031 (2011). 10.1364/OL.36.001029 [DOI] [PMC free article] [PubMed] [Google Scholar]
- 19.Wang Y., Maslov K., Kim C., Hu S., Wang L. V., “Integrated photoacoustic and fluorescence confocal microscopy,” IEEE Trans. Biomed. Eng. 57(10), 2576–2578 (2010). 10.1109/TBME.2010.2059026 [DOI] [PMC free article] [PubMed] [Google Scholar]
- 20.Jiao S., Xie Z., Zhang H. F., Puliafito C. A., “Simultaneous multimodal imaging with integrated photoacoustic microscopy and optical coherence tomography,” Opt. Lett. 34(19), 2961–2963 (2009). 10.1364/OL.34.002961 [DOI] [PMC free article] [PubMed] [Google Scholar]
- 21.Zhang E. Z., “Multimodal simultaneous photoacoustic tomography, optical resolution microscopy, and OCT system,” Photons Plus Ultrasound: Imaging and Sensing 7564, 75640–75647 (2010). [Google Scholar]
- 22.Liu T., Wei Q., Wang J., Jiao S., Zhang H. F., “Combined photoacoustic microscopy and optical coherence tomography can measure metabolic rate of oxygen,” Biomed. Opt. Express 2(5), 1359–1365 (2011). 10.1364/BOE.2.001359 [DOI] [PMC free article] [PubMed] [Google Scholar]
- 23.Lee C., Han S., Kim S., Jeon M., Jeon M. Y., Kim C., Kim J., “Combined photoacoustic and optical coherence tomography using a single near-infrared supercontinuum laser source,” Appl. Opt. 52(9), 1824–1828 (2013). 10.1364/AO.52.001824 [DOI] [PubMed] [Google Scholar]
- 24.Zhang X., Zhang H. F., Jiao S., “Optical coherence photoacoustic microscopy: accomplishing optical coherence tomography and photoacoustic microscopy with a single light source,” J. Biomed. Opt. 17(3), 0305021 (2011). [DOI] [PMC free article] [PubMed] [Google Scholar]
- 25.Yang Y., Li X., Wang T., Kumavor P. D., Aguirre A., Shung K. K., Zhou Q., Sanders M., Brewer M., Zhu Q., “Integrated optical coherence tomography, ultrasound and photoacoustic imaging for ovarian tissue characterization,” Biomed. Opt. Express 2(9), 2551–2561 (2011). 10.1364/BOE.2.002551 [DOI] [PMC free article] [PubMed] [Google Scholar]
- 26.Ke H., Erpelding T. N., Jankovic L., Liu C., Wang L. V., “Performance characterization of an integrated ultrasound, photoacoustic, and thermoacoustic imaging system,” J. Biomed. Opt. 17(5), 056010 (2012). 10.1117/1.JBO.17.5.056010 [DOI] [PMC free article] [PubMed] [Google Scholar]
- 27.Reinecke D. R., Kruger R. A., Lam R. B., DelRio S. P., “Co-registered photoacoustic, thermoacoustic, and ultrasound mouse imaging,” Photons Plus Ultrasound: Imaging and Sensing 7564, 756420 (2010). [Google Scholar]
- 28.Emelianov S. Y., Aglyamov S. R., Shah J., Sethuraman S., Scott W., Schmitt R., Motamedi M., Karpiouk A., Oraevsky A. A., “Combined ultrasound, optoacoustic, and elasticity imaging,” Photons Plus Ultrasound: Imaging and Sensing 5320, 101–112 (2004). [Google Scholar]
- 29.S. Emelianov, S. Aglyamov, A. Karpiouk, S. Mallidi, S. Park, S. Sethuraman, J. Shah, R. Smalling, J. Rubin, and W. Scott, “1E-5 Synergy and Applications of Combined Ultrasound, Elasticity, and Photoacoustic Imaging,” in Ultrason, pp 405-415 (2006).
- 30.Graf I. M., Kim S., Wang B., Smalling R., Emelianov S., “Noninvasive detection of intimal xanthoma using combined ultrasound, strain rate and photoacoustic imaging,” Ultrasonics 52(3), 435–441 (2012). 10.1016/j.ultras.2011.10.005 [DOI] [PubMed] [Google Scholar]
- 31.Shao P., Shi W., Hajireza P., Zemp R. J., “Integrated micro-endoscopy system for simultaneous fluorescence and optical-resolution photoacoustic imaging,” J. Biomed. Opt. 17(7), 076024 (2012). 10.1117/1.JBO.17.7.076024 [DOI] [PubMed] [Google Scholar]
- 32.Papadopoulos I. N., Simandoux O., Farahi S., Huignard J. P., Bossy E., Psaltis D., Moser C., “Optical-resolution photoacoustic microscopy by use of a multimode fiber,” Appl. Phys. Lett. 102(21), 211106 (2013). 10.1063/1.4807621 [DOI] [Google Scholar]
- 33.Joseph J., Murukeshan V. M., Sathiyamoorthy K., Lye S. W., “Integrated laser photoacoustic, ultrasound and fluorescence imaging (PAUSFI) for diagnostic bio-imaging applications,” Laser Phys. (to be published).
- 34.Choe R., “Diffuse optical tomography and spectroscopy of breast cancer and fetal brain,” http://www.physics.upenn.edu/yodhlab/theses/regine_choe.pdf 10.1118/1.2047847 [DOI] [PubMed]
- 35.American national standard for safe use of lasers (ANSI Z136.1–2007), (Laser Institute of America, 2000). [Google Scholar]


