Abstract
We present a novel non-contact small animal fluorescent molecular tomography (FMT) imaging system. At the heart of the system is a new mirror-based imaging head that was designed to provide 360-degree measurement data from an entire animal surface in one step. This imaging head consists of two conical mirrors, which considerably reduce multiple back reflections between the animal and mirror surfaces. These back reflections are common in existing mirror-based imaging heads and tend to degrade the quality of raw measurement data. In addition, the introduction of a novel ray-transfer operator allows for the inclusion of the angular dependent data in the image reconstruction process, which results in higher image resolution. We describe in detail the system design and implementation of the hardware components as well as the transport-theory-based image reconstruction algorithm. Using numerical simulations, measurements on a well-defined phantom and a live animal, we evaluate the system performance and show the advantages of our approach.
OCIS codes: (170.0110) Imaging systems; (170.6960) Tomography; (170.6280) Spectroscopy, fluorescence and luminescence
1. Introduction
Over the past decades, in vivo fluorescent molecular tomography (FMT) for small animals has evolved into a sensitive technique to probe and characterize biological and pathological parameters in biomedical research. In general, one can distinguish between two categories of small animal FMT systems. First, there are fiber-based systems that require direct contact with the animal. These systems employ optical fibers for delivering light from sources to the animal and for collecting light from the animal to bring it to the measurement components, such as avalanche photodiodes (APD) or photomultiplier tubes (PMT) [1, 2]. However, small surface areas and curvatures on surface boundaries of rodents restrict the number of fibers and direct attachments to the animal. To circumvent these difficulties, some fiber-based imaging setups rely on using an imaging container filled with a matching fluid that has tissue-like optical properties [3]. These containers provide simple rectangular or cylindrical surface geometries that are advantages for image reconstruction algorithms. However, a container with an additional medium between the animal and the sources and detectors, degrades the signal-to-noise (SNR) ratio. All fiber-based systems have a limited number of source-detector pairs, which limits the amount of measurement data that can be collected.
The second category contains non-contact camera-based imaging systems that use pixel arrays on the CCD image sensors as detectors to collect light coming from the animal [4–7]. These systems offer a denser spatial sampling, which results in more measurement data. This in turn can improve the image reconstruction quality. In addition, relatively simple system implementation and the possibility for high throughput imaging have led to a wide use of cameras in optical imaging. A drawback is the need to extract the exact surface geometry for the animal. Furthermore, the one-directional view of a camera limits the number of projection directions. As a result, a single camera cannot obtain both transmittance and reflectance data at the same time. However, acquiring both data sets is crucial for accurate image reconstructions of the interior of the animal [8]. To increase the number of projection directions, several approaches have been suggested. These include rotating the animal to be imaged in front of a camera [9], rotating of the camera around the animal, or employing multiple cameras that surround the animal [10]. In addition, mirror-based imaging heads [11–13] have been proposed that allow multiple views of the animal from a fixed-position camera. But the positioning of mirror surfaces in close proximity to the animal can generate multiple back reflections of light emitted from the animal. Therefore, a portion of the light coming from the animal is reflected off the mirrors back onto the animal. This leads to complications in both accurate illumination and interpretation of measurement data and that can negatively affect the image reconstruction process. Eliminating back reflections remains a challenging problem in mirror-based imaging schemes.
In addition, it has been shown that angular dependent data leads to improvements in the image reconstruction compared with angular averaged data [14]. Nonetheless, current small animal imaging systems have not yet seen any success with the collection of angular dependent measurement data.
Considering all these issues in data acquisition, we chose five main design features for our new frequency domain non-contact imaging system: (1) The system should allow for simultaneous acquisition of multi-directional projection data of the animal in its natural posture; (2) The system should eliminate or minimize multiple reflections of emitted light back into the animal to be imaged; (3) The setup should allow for free space source illumination of any spot of the animal’s surface without obstructing the camera’s field of view; (4) It should provide a ray transfer operator that maps angular dependent emission from the animal surface onto detected signals on CCD pixels; (5) The animal’s surface geometry extraction should be integrated directly into the system. Additional features such as easy handling of animals throughout the imaging processes, feasibility of combining the system with other imaging modalities, and fewer moving components were also considered.
In this paper, we describe the development of a FMT imaging system to achieve our design goals. Basic concepts and details on each hardware unit are presented in Section 2. Section 3 describes the image reconstruction algorithm that is based on the equation of radiative transfer (ERT). This includes a ray transfer operator that allows us to gather angular dependent data. The results from simulations and experiments are shown in Section 4. At the end we provide a discussion and summary.
2. Instrument design
The imaging system is designed to allow full-body non-contact imaging. The four main parts of the system are: (1) A light input unit for generating and positioning the beam of an intensity modulated laser source; (2) An imaging head for projecting omni-directional views of the animal surface onto a CCD camera; (3) A detection unit for measuring amplitude modulation and phase shift of the collected light; and (4) A surface scanner for extracting a surface geometry of the animal being imaged. A schematic overview of the imaging system is shown in Fig. 1.
Fig. 1.
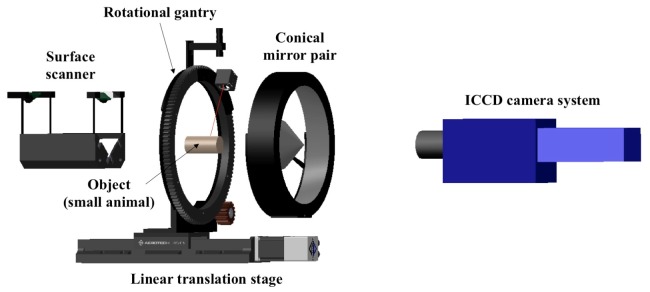
Overview of the FMT small animal imaging system. The light input unit consists of a mirror adaptor, a rotational gantry, a linear translation stage, and laser diodes emitting light at various wavelengths (not presented in this view). The two conical mirrors are the main components of the imaging head that collect light from the animal and transfer it to the ICCD camera system. The detection unit is composed of filter sets, a lens, and the intensified CCD camera system. A line laser on the rotational gantry is the component of the surface scanner.
2.1 Light input unit
The light sources of the input unit are laser diodes at wavelengths of 475, 661, 757, 828, 926 nm (LDH-M-C Series, PicoQuant GmbH, Germany). The laser diodes are thermoelectrically controlled and driven by laser drivers (MDL 300, PicoQuant GmbH, Germany). A multimode optical patch cable (Ø 50µm, 2m length, FC/APC output connector) guides a laser beam to a collimator (60fc-4, Schäfter + Kirchhoff GmbH, Germany). The collimator narrows a laser beam to 1~2 mm diameter with 80% coupling efficiency and is clamped to a cube-mount mirror. A cube-mounted 90° prism mirror (CM1-P01, Thorlabs Inc., USA), to which the collimator is fastened, reflects the laser beam toward the animal, which is placed on a transparent stage as shown in Fig. 2(a).
Fig. 2.
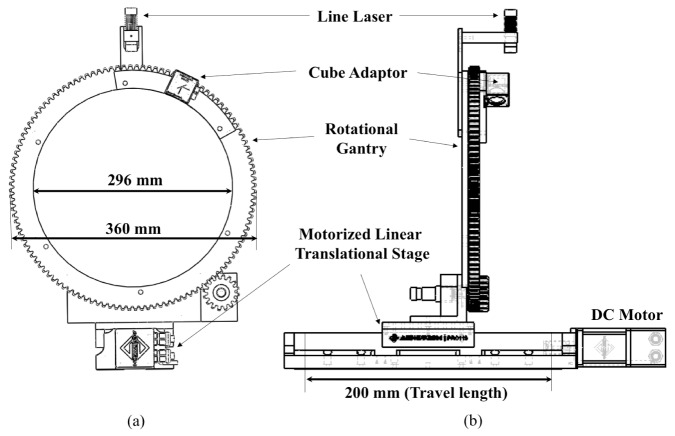
Laser source positioning subunit (a) front view, and (b) side view
The spot position of the laser beam is precisely controlled by the combination of a rotational gantry and a linear translational stage. The rotational gantry provides 360-degree angular freedom of laser illuminations on the animal surface. The gantry size (bore Ø 296 mm) was chosen large enough not to obstruct the field of view (FOV) of our mirror-based imaging head in Section 2.2. A brushless dc motor (EC16, Maxon Precision motors Inc., USA) rotates a large ring gear (bore Ø 296 mm, pitch Ø 360 mm, 120 teeth, Proto Labs Inc., USA) on a turntable ring via a planetary gear head (84:1, GP16, Maxon Precision Inc., USA) and a spur gear (outside Ø 54 mm, 16 teeth, Quality Transmission Co., USA). The gear ratio between the motor and the large ring gear is 630:1 and a motion controller (EPOS2 24/5 Maxon Precision motors Inc., USA) operates rotational movements with 0.25° resolution. The rotational gantry is mounted on a motorized linear translation stage (Pro115-05MM-200-TTM, Aerotech Inc., USA) operated through a motion controller (Soloist CL, Aerotech Inc., USA). 200 mm travel range with 0.5µm resolution of the stage provides a full coverage of a whole mouse body and fine positioning of a laser beam. A LabVIEW graphical user interface of the host computer was developed to facilitate the control of all components.
2.2 Imaging head
To expand the ICCD camera’s viewing directions and to reduce unwanted back reflections between the surface of the animal and the mirrors, we developed a consecutive double reflection scheme. As shown in Fig. 3, two mirrors face the animal to be imaged and a camera respectively. The first mirror facing the animal captures and reflects the optical signals coming from the animal’s surface towards the second mirror. Then the second mirror projects optical signals onto the pixels of the CCD chip. Together these two mirrors enable a single fixed-position camera to have two different viewing directions within its field of view. Furthermore, positioning the mirrors away from the animal reduces the back reflections between the animal’s surface and the highly reflective mirror surfaces.
Fig. 3.
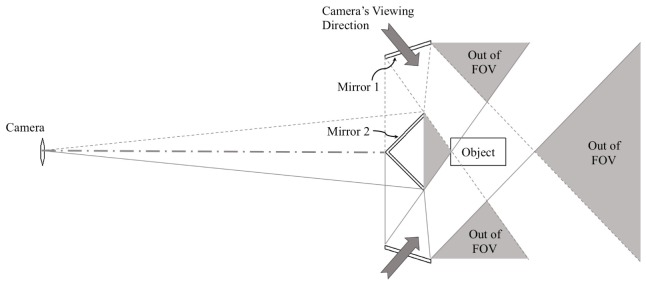
Basic concept of the double reflection mirror scheme
As a next step, this double reflection scheme is extended in three dimensions to maximize the detection areas. Assuming the shape of the animal to be approximately cylindrical, we chose two conical shaped mirrors for omni-directional views of the animal. These mirrors were designed by fixing a given viewing angle (50 mm focal length), an assumed cylindrical mouse shape (Ø 4 cm, 8 cm length) and a predefined 45-degree angle of the second mirror. In total, 8 parameters in Fig. 4 related to the specification and positions of mirrors were extracted. Since various combinations of these parameter values can be chosen, we considered four main aspects: (1) Minimum focus distance of the lens; (2) Efficient pixel usage without leaving too many pixels for the background; (3) Machinability; (4) Available space for the system. Two parameters, the bias angle, γ, and the distance, , from the lens center to the animal varied as independent variables, while the other five parameters were calculated based on the variation of γ (from 30° to 60°) and (from 500 mm to 1400 mm). Using back reflection simulations and simplified mock tests, we arrived at the final parameter values for the imaging head, which are summarized in Table 1.
Fig. 4.
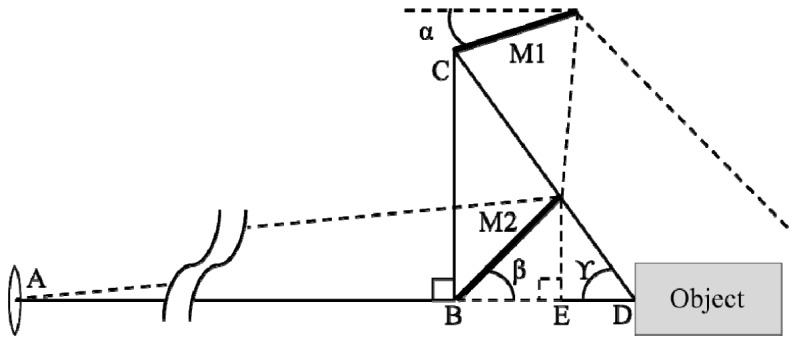
Parameters for the conical mirror design
Table 1. Summary of mirror design specification.
| Parameter | M1 | M2 | α | β | γ | |||
|---|---|---|---|---|---|---|---|---|
| Value | 800 mm | 136 mm | 39 mm | 70 mm | 80 mm | 17.5° | 45° | 55° |
As a substrate for the mirrors, we chose aluminum due to its fabricability of complex shapes, low cost, and easy assembly. For our application these properties make aluminum superior compared with other common mirror substrates such as glasses, beryllium, and invar alloys. The aluminum mirror substrate was machined using a computer numerical control (CNC) lathe to hold tight tolerance (< ± 5μm for concentric Z-axis). The mirror surface was finished using diamond turning (Nu-Tek Precision Optical Co., USA) to have 70Å rms surface roughness. The polished mirror surfaces were coated with a few micron protective silver layer for higher reflectivity over the visible wavelength range (Rocky Mountain Instrument Ltd., USA). The fabricated mirrors were assembled concentrically using a customized mirror holder (Proto Labs Inc., USA) designed to minimize obstructed areas in the camera’s field of view. The edge sides of the transparent animal stage make shadow areas on the conical mirrors in the imaging processes. The mirror holder uses these shadow areas. The outer surfaces of the conical mirrors and the mirror holder that do not contribute to the image formation were painted with a highly absorptive black coating paint (Nextel Suede-coating 3101, Mankiewicz Gebr. & Co., Germany) to eliminate the reflective surfaces. Figure 5 shows the assembled imaging head as well as an image, which demonstrates that all sides of a soda can be imaged at the same time and displayed in one image (Fig. 5(c)).
Fig. 5.

Assembled conical mirrors, (a) front view, (b) backside view, and (c) an obtained image using the conical mirror pair with a soda can
2.3 Detection unit
The main system of the detection unit is an intensified CCD (ICCD) camera system (PicoStar HR 12, LaVision GmbH, Germany). Projected photons from the double conical mirrors pass through filters (a combination of 515 long pass filter and 515/30 or 595/20 or 625/20 nm band pass filter, Chroma Technology Corp., USA) and a lens (AF Nikkor 50 mm f/1.8D, Nikon, Japan) in front of the intensifier. To determine amplitude modulations and phase shifts for the frequency domain measurements, we implemented a homodyne imaging method [15–17]. The gain of the intensifier is modulated at the same frequency as the source. Two external signal generators (2023A, Aeroflex Inc., USA) that allow for modulation frequencies between 9 kHz and 1.2GHz are used for the modulation of the gain and laser diodes. Since the output of the intensifier is a steady state image at a given phase difference between a source and the intensifier gain modulation, complete signal oscillations of each pixel (1376 × 1024, 14.11 µm × 14.11 µm pixel size) are achieved by shifting the phase of the gain sequentially. All detection processes of the ICCD camera system including parameter settings of the intensifier and the CCD camera are controlled by a customized imaging software (DaVis 7, LaVision GmbH, Germany). The signal to noise ratio of amplitude and phase for the ICCD camera system depending on system parameters for diffuse optical tomography was already well characterized in the study of Netz et al [18]. Our study for fluorescence molecular tomography using the same method as employed in [18] showed SNR in the range of 10~40 dB, depending on the modulation frequency, exposure time, and MCP gain.
2.4 Surface scanner
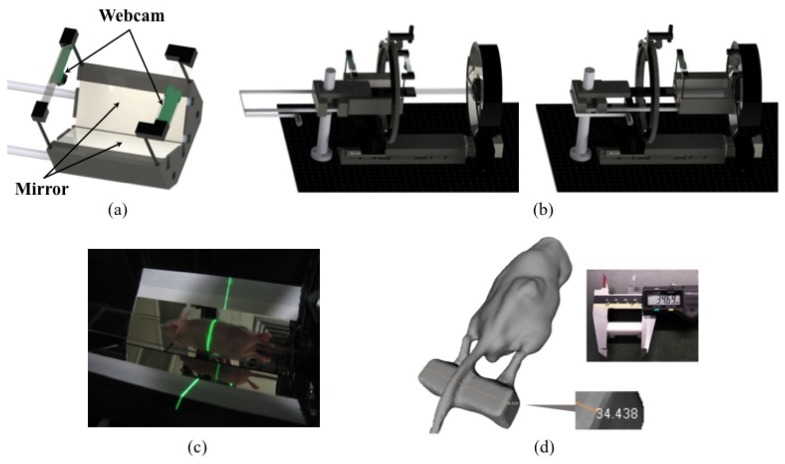
Extracting the surface geometry of the animal is achieved by an integrated surface scanner. The scanner employs a focusable line laser (LC532-5-3F, 532 nm, < 5 mW, Apinex.com Inc., Canada), two fixed-position webcams (960 × 780, 15 fps, Quickcam Pro 9000, Logitech, USA) and a 105° angled background with mirror surfaces in part. The scanner is built on a movable platform so that it can be removed from the FOV of the camera, after the scan of the animal surface is completed. In this way the scanner does not obstruct the data acquisition by the conical mirror pair (Fig. 6(b)). A line laser sheet moving on the linear translational stage intersects the animal and the background surfaces at the same time. These intersections are captured by two webcams and used to triangulate three-dimensional coordinates of point clouds with known background geometries. In addition, the mirror-surfaced background reflects two opposite side views into each webcam so that total of six directional scans of a whole mouse body are obtained within 7~10 seconds. The David Laser scanner software (DAVID Vision Systems GmbH, Germany) generates a complete surface mesh from the scan data. The generation and post-processing of volume meshes are performed with the help of the ICEM CFD software package (ANSYS Inc., USA). Finally, the local coordinates of the generated animal mesh are converted into the global coordinates of the imaging system based on a priori geometrical information of a reference block (35 × 10 × 15 mm). This reference block is placed on the transparent animal stage so that it is scanned together with the animal. In the comparison of object sizes between the real (measured) and the generated by the surface scan, the accuracy is within ± 0.5 mm as shown in Fig. 6(d).
Fig. 6.
(a) Components on a movable platform, (b) two different operation modes (left: imaging mode, right: scan mode), (c) a photo of surface scanning, and (d) a generated mouse mesh together with the reference block
2.5 System configuration
The alignment of system components is critical to increase the accuracy of the coordinate information in non-contact data acquisitions for tomographic image reconstructions. Each mechanical component was designed using a computer-aided design (CAD) software package from Solidworks (Dassault Systèmes Solidworks Corp., USA). All components were assembled on a solid aluminum breadboard (MB60120/M, Thorlabs Inc., USA) to enable accurate positioning of each component. Following the assembly on the breadboard, the heights of the camera, the transparent animal stage and the surface scanner were finely tuned using a labjack (M-EL120), a rod platform (M-300-P), and a fine positioner (M-32A, Newport Co., USA) of a rod platform to align with the fixed height conical mirrors. Figure 7 shows the outside and inside views of the imaging system.
Fig. 7.

Photos of the FMT small animal imaging system. Figure (a) shows the overall appearance of the system and the imaging chamber. The imaging chamber was carefully designed for easy access to the animal and the system components and allows for convenient experiment environment. Figure (b) shows the inside of the imaging chamber.
The pan and tilt of the camera was calibrated using a predefined grid pattern (5 mm, 15° interval) on a cylindrical bar to enable accurate modeling of a three-dimensional object on two-dimensional images. This calibration involves making no variation of azimuth angles and symmetrical distribution of radial lines on the cylindrical bar in the captured image. This results in the concentric alignment of the camera, conical mirrors and the cylindrical object bar. The captured image of the calibration bar provides optical geometry information of the imaging setups. Finally, the location of a source illumination spot was finely tuned based on the same cylindrical bar grid used in the camera calibration as shown in Fig. 8(c).
Fig. 8.

(a) Calibration bar, (b) an image of the calibration bar obtained with the double-conical-mirror imaging head and the ICCD camera, and (c) laser spot alignment with a calibration bar.
3. Image reconstruction
3.1 Angular dependent ray transfer operator
To obtain a three-dimensional distribution of the relevant physiological or pathological parameters inside the animal, we developed an equation of radiative transfer (ERT)-based image reconstruction algorithm. The input for this algorithm includes the radiance observed on the surface of the animal. Using the given calibrated optical geometries of optical components and the camera system, image distortion by double conical mirrors is corrected in the image reconstruction processes. Mapping the spatial and angular distribution of this light radiance, emanating from the animal surface onto pixels of the ICCD camera is achieved by an ERT-based free-space ray transfer operator. The ray transfer operator was constructed taking the surface radiation theory into account [19], which allows for exact treatment of light propagation in free space.
Assuming an angular dependent emitting surface as shown in Fig. 9, the radiation power, , emitted from the differential area, at , in the direction of toward a lens, is described as:
| (1) |
where is the unit normal vector to the surface and is the differential solid angle in the direction of. The total radiation power that is emitted from and captured by the lens aperture is given by:
| (2) |
where is the solid angle subtended by the projected area of on the lens aperture.
Fig. 9.

Light propagation from an object’s surface to the aperture of the camera through optical components
Assuming that all photons within passing through the lens aperture are deposited on the image plane of a camera without any loss, the total radiant power passing through the lens aperture is equivalent to the total radiant flux, , on the differential area in the image plane. is the measurable quantity being compared to the prediction during the reconstruction process. Finally, can be expressed as a function of angular dependent radiance, :
| (3) |
The ray transfer operator is constructed by using a ray tracing method and it depends on the direction , the position , the solid angle , and the area ratio . Therefore, provides angular dependent measurement data for the image reconstruction. More details of the angular dependent ray transfer operator for our conical mirrors and general optical components can be found in the study by Jia et al [20].
3.2 Reconstruction algorithm
Three-dimensional distributions of fluorescent sources are achieved by using a partial differential equation (PDE)-constrained optimization approach. Light generation and propagation in the small animal tissue volume are modeled by two coupled equations of radiative transfer (ERT) in the frequency domain as:
| (4) |
| (5) |
where is the radiance of light and , denote the absorption and scattering coefficients. Superscript and represent excitation and emission respectively. is the absorption coefficient of a fluorescent source. The fluorescent signal intensity is directly proportional to , the quantum yield, , and the excitation fluence, . is the fluorescence lifetime that a source stays in its excitation state before emitting the light. Here Henyey-Greenstein function being commonly used in tissue optics is employed for a scattering phase function, . To solve the two-coupled equations numerically, the system of equations is discretized with a node-centered finite volume approach and a discrete ordinate method [21]. The solution to this equation system provides the radiance distributions on the boundary surface, which is converted to the prediction on the image sensor through the developed ray transfer operator. The reconstruction of fluorescent source distribution is achieved by solving the PDE-constrained inverse problem with the reduced Hessian sequential quadratic programming (rSQP) method. This approach updates the forward and inverse variables simultaneously at each optimization iteration so that the reconstruction process can be accelerated with fast convergence. The details of the reconstruction method used in our work were described before by Kim et al [22]. The implementation of our angle-dependent measurement operator into the framework of PDE-constrained optimization enables our previous reconstruction code in [22] to use angle-dependent measurement data for the image reconstruction.
4. Result
4.1 Back reflection comparison between a single conical mirror and double conical mirrors
Numerical simulations were conducted to calculate the amount of reflections between the surfaces of the mirrors and the animal to be imaged. We performed Monte Carlo ray tracing simulations using the software package called LightTools (Synopsys Inc., USA), which is widely used in commercial settings to develop and test new optical designs. Figure 10 illustrates the setup for the simulations. An 8 cm long cylindrical digital object with a diameter of 4 cm is placed inside the camera’s field of view. A point source that mimics light emitted from the surface of a mouse-size cylinder is moved in 10 mm steps along the y-axis on the cylinder surface from y = 10 mm to y = 70 mm (Fig. 10(a)). At each step, the Monte Carlo code simulates the emission of 50,000,000 photons from the point source. The photons are launched isotropically into the upper hemisphere. Tracing the photons through the imaging head we calculate the density distributions of photons that returned back to the surface of the animal. We performed these simulations for two different types of imaging heads. The first imaging head consists of a single conical mirror (Fig. 10(b)), as used in the study of Li et al [13]. The second imaging head consists of the double conical mirror pair (Fig. 10(c)) implemented in our imaging system.
Fig. 10.
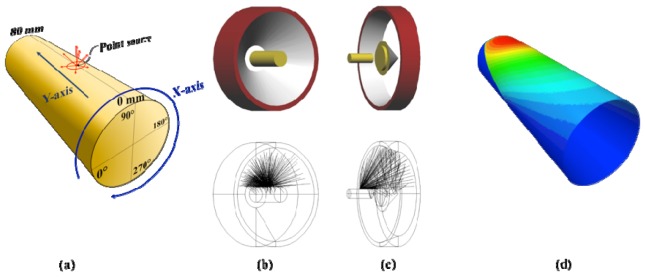
Back reflection simulation setup, (a) a cylindrical phantom and displacement of a point source on the surface, (b) single conical mirror scheme, (c) double conical mirror scheme and (d) density distribution of returned photons on the phantom surface
The simulation results for the imaging heads with a single and double conical mirrors are plotted in Fig. 11. Shown are here the fractions of photons (in % of all photons emitted from the point source) that are back reflected from the mirror surfaces of imaging heads to the surface of the object. We observe that for the single conical mirror (dash line), 8.3% to 11.7% of emitted photons return back to the cylinder surface depending on the source position. On the other hand, in the double conical mirror scheme, back reflections are below 2% for all source positions (solid line): it is already as small as 1.6% at the source position of 10 mm from the edge, and diminishes to zero beyond 40 mm.
Fig. 11.
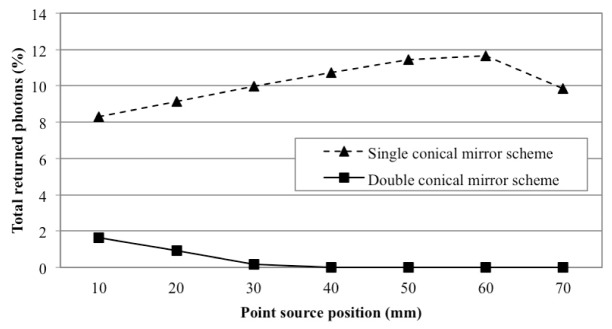
Comparison of back reflection levels as a function of the location of a point source on the cylinder surface (see Fig. 10(a))
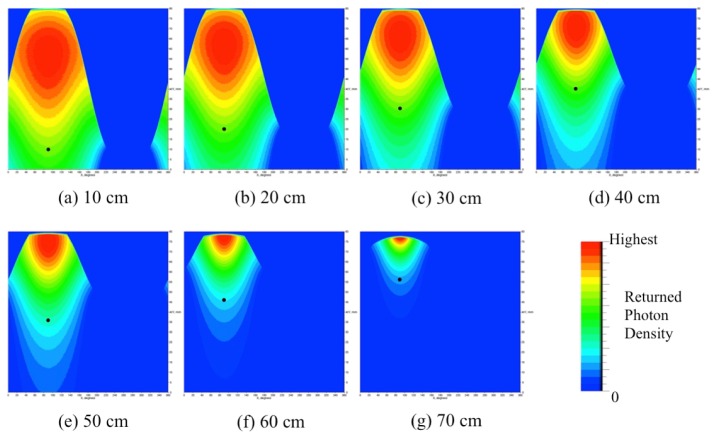
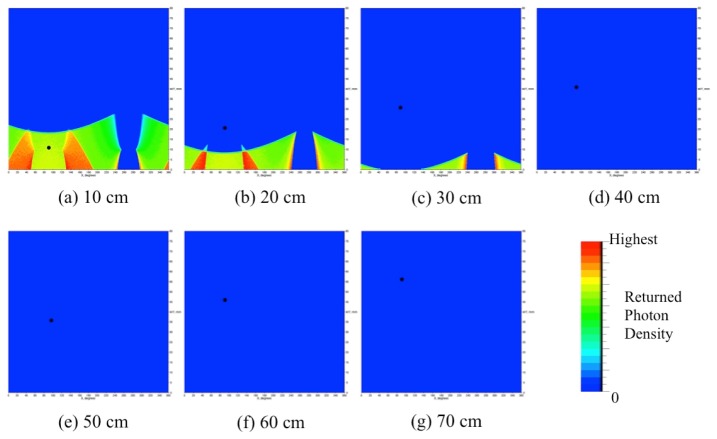
In Fig. 12 and Fig. 13, the density distributions of returned photons for the single- and double-conical-mirror arrangements are shown in two dimensions. This is achieved by unfolding the surface layer seen in Fig. 10(d). First, we observe that in the single conical mirror case (Fig. 12), the affected area and the amount of back reflections are considerably larger than in the double-conical-mirror case (Fig. 13). Furthermore, a closer inspection of Fig. 12 reveals that as a point source (shown as a black dot) moves inside the single conical mirror (from 10 mm to 70 mm), the affected area on the cylinder surface becomes smaller. However, from Fig. 11 we know that the total percentage of returned photons slightly increases and peaks at 60 mm. Therefore, depending on the placement of the animal and light sources inside the single conical mirror, the distribution and total number of back-reflected photons varies. In turn this will negatively affect the accuracy of the image reconstruction. On the other hand, Fig. 13 shows that for the double conical mirrors, the affected areas on the cylinder surface disappear for the source positions beyond 40 mm. Therefore, by placing the animal more than 40mm away from the double conical mirrors we can completely avoid back reflection effects.
Fig. 12.
Simulation results of the single conical mirror scheme depending on a point source positions (black dot). For clear visualization, each result at different source positions is auto scaled based on the individual total returned photon results in Fig. 11.
Fig. 13.
Simulation results of the double conical mirror scheme depending on a point source positions (black dot). For clear visualization, each result at different source positions is auto scaled based on the individual total returned photon results in Fig. 11.
4.2 Angular dependent data vs angular averaged data
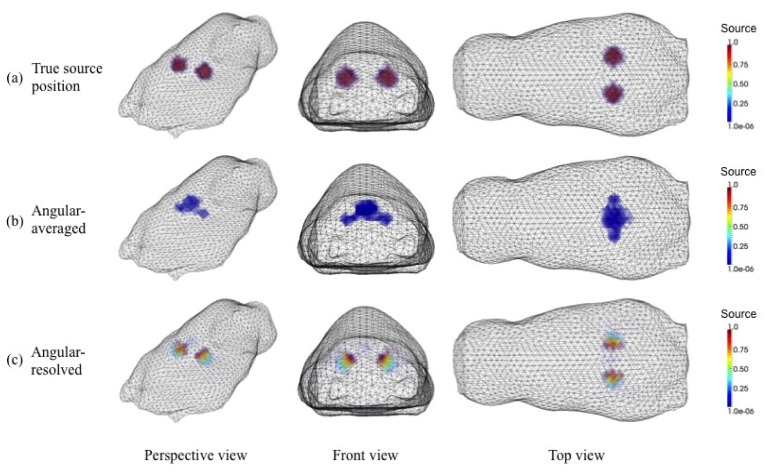
We demonstrate here the advantages of angular dependent measurements in the reconstruction process through numerical studies involving a digital animal model. Using our surface scanner, a realistic 3D mesh of a live mouse was generated. The optical properties of the background medium were set as and at both 475 nm excitation and 515 nm emission wavelengths. Inside this digital mouse phantom, we placed two fluorescent sources 1 cm apart at the depth of ~8 mm below the surface as shown in Fig. 14(a). It was assumed that the sources have an absorption coefficient of cm−1, a quantum yield of , and a fluorescence lifetime of ns. A single illumination at the center between two fluorescent sources was assumed. The synthetic emission radiance on the surface of the mouse phantom was generated by solving the ERT-based forward problem with a given distribution set of optical properties and fluorescent sources. All simulation results were reconstructed on a mesh of 43,290 tetrahedron elements. To use angular dependent data for the image reconstruction, 80 ordinates at each surface mesh node were employed.
Fig. 14.
Comparison of reconstruction results using angular dependent and angular averaged data respectively: (a) true source position; (b) angular averaged data result; (c) angular dependent data result
Figure 14 shows the results of this study. In Fig. 14(a), the true locations of the two fluorescent sources can be seen. Figure 14(b) depicts the reconstruction results assuming that angular averaged data is obtained, while Fig. 14(c) shows the reconstruction results assuming angular dependent data as input for the reconstruction code. It can be clearly seen that the angular dependent data leads to the reconstruction in which the two fluorescent sources are separated. On the other hand, when the angular averaged data is used, the two sources cannot be separated.
4.3 Phantom experiment
For our phantom studies a cylindrical polyurethane solid phantom (Ø 35 mm, 48 mm length) was fabricated with carbon black as an absorbing dye (BiomimicTM phantom, INO, Québec, Canada). The optical properties of the phantom measured by using the time-correlated single-photon counting (TCSP), are , , and , at wavelengths of 475 and 515 nm respectively. We diluted fluorescein (F2456-100G, Sigma-Aldrich Co. USA) with distilled water to achieve a 0.75% solution by weight. Then, this fluorescent solution filled a drilled insertion hole (Ø 1.5 mm, 25 mm depth) positioned 5 mm away from the center of the phantom. In the imaging process, 475 nm excitation light illuminated three different points on the surface of the phantom, emission data at each illumination point was acquired using a combined filter set (515 nm long pass filter and 515/30 band pass filter). The reconstruction process involved approximately 60,000 tetrahedron elements. Figure 15 shows that the reconstructed position of the fluorescein-filled hole is well matched with the actual position in the optical phantom.
Fig. 15.

(a) A polyurethane solid phantom with an insertion hole (red circle), (b) reconstruction results from the experiment using a fluorescein solution as a fluorophore.
4.4 Animal experiment
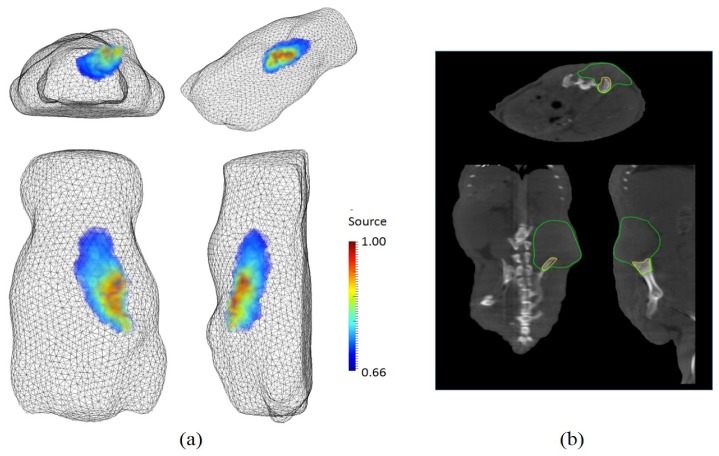
An animal experiment was conducted with a tumor-bearing mouse. Osteosarcoma cells (143B) [23] transfected with GFP (pEGF-C1) were multiply sorted by using flow cytometry to present 80~90% GFP positive expression. Then, 1 × 10⁷ cells/ml in 100 μL PBS were injected into the right iliac crest of a male athymic nude mouse with an X ray-guided intrapelvic injection. Three weeks later, the tumor was imaged with our newly developed FMT system and the NanoSPECT/CTTM imager of Bioscan Inc., USA. For the FMT imaging, we used a 475 nm excitation wavelength and the same combined filter set (515 nm long pass filter and 515/30 band pass filter) that was used for the phantom experiment. A total of 20,334 data points from five illumination points were used together with a volume mesh having 125,000 tetrahedron elements. As shown in Fig. 16, the tumor area in the FMT reconstruction result corresponds with the tumor boundaries in the obtained from the CT imager.
Fig. 16.
In vivo imaging of a tumor-bearing mouse: in a clockwise direction, (a) perspective, side, top, and rear views of FMT reconstruction results; (b) axial, sagittal, coronal views of CT imaging. In CT images, the areas enclosed by a green line and a yellow line present a soft tissue part and a bony part of the tumor respectively.
5. Conclusion
We introduced in this paper a novel non-contact small animal fluorescent molecular tomography (FMT) imaging system. This frequency-domain system makes use of a double conical-mirror imaging head that enables angular dependent measurements from simultaneous multi-directional views with a single fixed position camera. Therefore, an entire animal surface can be imaged with a single camera without moving either the animal or the camera. We demonstrated that this approach substantially reduces back reflections from mirror surfaces to the animal, compared with the existing single-conical mirror system that places a mirror in close proximity to the animal. By introducing a novel ERT-based ray transfer operator, angular dependent measurements data are obtained. Using this angular dependent data in the image reconstruction process improved the resolution of the reconstructed images. Moreover, unobstructed space around the target animal provides for easy access to the animal and allows for combining the imaging system with other gantry-based imaging modalities such as MRI, CT, PET and SPECT. A combined multi-modality system would allow for precise co-registration of outputs from two different modalities. In addition, a priori anatomical information would be able to be used for improving the image reconstruction quality. Furthermore, our imaging system is not limited to fluorescence tomography, but also can be used for tomographic imaging of absorption and scattering properties. Finally, it should be noted that our double-reflection scheme can be cost-effectively employed with all camera-based systems. Mirror shapes and sizes can be varied to accommodate imaging of other objects (e.g. larger animals, breasts, feet, hands, etc).
Acknowledgments
This research was partially supported by the National Cancer Institute (NCI#5R33CA118666-05) at the National Institute of Health (NIH). The authors would like to thank Dr. Hue H. Luu, MD of University of Chicago Medicine without whom the animal experiment would not have been possible.
References and links
- 1.Gulsen G., Birgul O., Unlu M. B., Shafiiha R., Nalcioglu O., “Combined diffuse optical tomography (DOT) and MRI system for cancer imaging in small animals,” Technol. Cancer Res. Treat. 5(4), 351–363 (2006). [DOI] [PubMed] [Google Scholar]
- 2.Ntziachristos V., Tung C. H., Bremer C., Weissleder R., “Fluorescence molecular tomography resolves protease activity in vivo,” Nat. Med. 8(7), 757–761 (2002). 10.1038/nm729 [DOI] [PubMed] [Google Scholar]
- 3.Flexman M. L., Vlachos F., Kim H. K., Sirsi S. R., Huang J., Hernandez S. L., Johung T. B., Gander J. W., Reichstein A. R., Lampl B. S., Wang A., Borden M. A., Yamashiro D. J., Kandel J. J., Hielscher A. H., “Monitoring early tumor response to drug therapy with diffuse optical tomography,” J. Biomed. Opt. 17(1), 016014 (2012). 10.1117/1.JBO.17.1.016014 [DOI] [PMC free article] [PubMed] [Google Scholar]
- 4.Graves E. E., Ripoll J., Weissleder R., Ntziachristos V., “A submillimeter resolution fluorescence molecular imaging system for small animal imaging,” Med. Phys. 30(5), 901–911 (2003). 10.1118/1.1568977 [DOI] [PubMed] [Google Scholar]
- 5.Patwardhan S. V., Bloch S. R., Achilefu S., Culver J. P., “Time-dependent whole-body fluorescence tomography of probe bio-distributions in mice,” Opt. Express 13(7), 2564–2577 (2005). 10.1364/OPEX.13.002564 [DOI] [PubMed] [Google Scholar]
- 6.Ale A., Schulz R. B., Sarantopoulos A., Ntziachristos V., “Imaging performance of a hybrid x-ray computed tomography-fluorescence molecular tomography system using priors,” Med. Phys. 37(5), 1976–1986 (2010). 10.1118/1.3368603 [DOI] [PubMed] [Google Scholar]
- 7.Lin Y., Barber W. C., Iwanczyk J. S., Roeck W., Nalcioglu O., Gulsen G., “Quantitative fluorescence tomography using a combined tri-modality FT/DOT/XCT system,” Opt. Express 18(8), 7835–7850 (2010). 10.1364/OE.18.007835 [DOI] [PMC free article] [PubMed] [Google Scholar]
- 8.Holt R. W., Leblond F., Pogue B. W., “Toward ideal imaging geometry for recovery independence fluorescence molecular tomography,” Proc. SPIE 8574, 857403 (2013). 10.1117/12.2004870 [DOI] [Google Scholar]
- 9.Deliolanis N., Lasser T., Hyde D., Soubret A., Ripoll J., Ntziachristos V., “Free-space fluorescence molecular tomography utilizing 360 ° geometry projections,” Opt. Lett. 32(4), 382–384 (2007). 10.1364/OL.32.000382 [DOI] [PubMed] [Google Scholar]
- 10.Lapointe E., Pichette J., Bérubé-Lauzière Y., “A multi-view time-domain non-contact diffuse optical tomography scanner with dual wavelength detection for intrinsic and fluorescence small animal imaging,” Rev. Sci. Instrum. 83(6), 063703 (2012). 10.1063/1.4726016 [DOI] [PubMed] [Google Scholar]
- 11.Guggenheim J. A., Basevi H. R. A., Frampton J., Styles I. B., Dehghani H., “Multi-modal molecular diffuse optical tomography system for small animal imaging,” Meas. Sci. Technol. 24(10), 105405 (2013). 10.1088/0957-0233/24/10/105405 [DOI] [PMC free article] [PubMed] [Google Scholar]
- 12.Wang G., Shen H., Durairaj K., Qian X., Cong W., “The first bioluminescence tomography system for simultaneous acquisition of multiview and multispectral data,” Int. J. Biomed. Imag. 2006, 58601 (2006). [DOI] [PMC free article] [PubMed] [Google Scholar]
- 13.Li C., Mitchell G. S., Dutta J., Ahn S., Leahy R. M., Cherry S. R., “A three-dimensional multispectral fluorescence optical tomography imaging system for small animals based on a conical mirror design,” Opt. Express 17(9), 7571–7585 (2009). 10.1364/OE.17.007571 [DOI] [PMC free article] [PubMed] [Google Scholar]
- 14.Gao H., Zhao H., “Multilevel bioluminescence tomography based on radiative transfer equation Part 1: l1 regularization,” Opt. Express 18(3), 1854–1871 (2010). 10.1364/OE.18.001854 [DOI] [PubMed] [Google Scholar]
- 15.Reynolds J. S., Troy T. L., Sevick-Muraca E. M., “Multipixel techniques for frequency-domain photon migration imaging,” Biotechnol. Prog. 13(5), 669–680 (1997). 10.1021/bp970085g [DOI] [PubMed] [Google Scholar]
- 16.Thompson A. B., Sevick-Muraca E. M., “Near-infrared fluorescence contrast-enhanced imaging with intensified charge-coupled device homodyne detection: measurement precision and accuracy,” J. Biomed. Opt. 8(1), 111–120 (2003). 10.1117/1.1528205 [DOI] [PubMed] [Google Scholar]
- 17.Kang D., Kupinski M. A., “Noise characteristics of heterodyne/homodyne frequency-domain measurements,” J. Biomed. Opt. 17(1), 015002 (2012). 10.1117/1.JBO.17.1.015002 [DOI] [PMC free article] [PubMed] [Google Scholar]
- 18.Netz U. J., Beuthan J., Hielscher A. H., “Multipixel system for gigahertz frequency-domain optical imaging of finger joints,” Rev. Sci. Instrum. 79(3), 034301 (2008). 10.1063/1.2840344 [DOI] [PubMed] [Google Scholar]
- 19.Modest M. F., Radiative Heat Transfer (Academic Press, USA, 2003). [Google Scholar]
- 20.Jia J., Lee J. H., Montejo L. D., Kim H. K., Hielscher A. H., “Measurement operator for angular dependent photon propagation in contact-free optical tomography,” Proc. SPIE 8578, 857815 (2013). 10.1117/12.2003200 [DOI] [Google Scholar]
- 21.Kim H. K., Hielscher A. H., “A PDE-constrained reduced Hessian SQP method for optical tomography based on the frequency domain equation of radiative transfer,” Inv. Probl. 25, 015010 (2009). 10.1088/0266-5611/25/1/015010 [DOI] [Google Scholar]
- 22.Kim H. K., Lee J. H., Hielscher A. H., “PDE-constrained fluorescence tomography with the frequency-domain equation of radiative transfer,” IEEE J. Sel. Top. Quantum Electron. 16(4), 793–803 (2010). 10.1109/JSTQE.2009.2038112 [DOI] [Google Scholar]
- 23.Chandhanayingyong C., Kim Y., Staples J. R., Hahn C., Lee F. Y., “MAPK/ERK signaling in osteosarcomas, Ewing sarcoma and Chondrosarcomas: therapeutic implications and future directions,” Sarcoma 2012, 404810 (2012). 10.1155/2012/404810 [DOI] [PMC free article] [PubMed] [Google Scholar]


