Abstract
Background
Cardiac hypertrophy and heart failure are associated with metabolic dysregulation and a state of chronic energy deficiency. Although several disparate changes in individual metabolic pathways have been described, there has been no global assessment of metabolomic changes in hypertrophic and failing hearts in vivo. Here, we investigated the impact of pressure overload and infarction on myocardial metabolism.
Methods and Results
Male C57BL/6J mice were subjected to transverse aortic constriction (TAC) or permanent coronary occlusion (myocardial infarction; MI). A combination of LC/MS/MS and GC/MS techniques was used to measure 288 metabolites in these hearts. Both TAC and MI were associated with profound changes in myocardial metabolism affecting up to 40% of all metabolites measured. Prominent changes in branched amino acids acids (BCAAs) were observed after 1 week of TAC and 5 days after MI. Changes in BCAAs after MI were associated with myocardial insulin resistance. Longer duration of TAC and MI led to a decrease in purines, acylcarnitines, fatty acids and several lysolipid and sphingolipid species, but a marked increase in pyrimidines as well as ascorbate, heme and other indices of oxidative stress. Cardiac remodeling and contractile dysfunction in hypertrophied hearts were associated also with large increases in myocardial, but not plasma, levels of the polyamines putrescine and spermidine as well as the collagen breakdown product prolylhydroxyproline.
Conclusions
These findings reveal extensive metabolic remodeling common to both hypertrophic and failing hearts that are indicative of extensive extracellular matrix remodeling, insulin resistance and perturbations in amino acid, lipid and nucleotide metabolism.
Keywords: heart failure, hypertrophy, metabolism, metabolomics, biomarker
Despite recent advances, heart failure continues to be a leading cause of morbidity and mortality in the Western world. Progressive contractile dysfunction during heart failure is in part due to chronic hemodynamic overload, which is initiated and sustained by hypertension, stenotic valves, or tissue damage due to myocardial infarction. As a result, the heart undergoes profound structural and metabolic changes that remain only partially understood.
Previous work has shown that heart failure is associated with dysregulation of both glucose and fatty acid metabolism1, 2. This metabolic dysregulation has been viewed as a contributory factor to the development of heart failure, and it has been suggested that modification of myocardial metabolism could improve clinical outcomes in heart failure patients2, 3. Although some of the metabolic changes that accompany cardiac hypertrophy and failure have been examined2–5, variations in disease manifestation and treatment history have produced discordant results, and data from animal models are diverse. While some models show increased glucose utilization and suppressed fatty acid oxidation6, 7, others show no major changes, at least during early stages of contractile dysfunction8, 9. Moreover, it remains unclear how hypertrophy affects insulin sensitivity, and how this relates to the changes in intermediary metabolism and the development of heart failure10, 11.
In addition to model-dependent variations, some discrepant findings related to metabolic changes could be due to methodological differences. Because, metabolic changes are dynamic, they are difficult to study and experimental procedures such as ex vivo perfusion could introduce significant artifacts. Moreover, in contrast to energetic processes, other metabolic pathways have received less attention, even though there is growing recognition that non-energetic processes could also significantly affect cardiac function and remodeling.
The current study was designed to examine metabolic changes that occur in the heart in vivo during hypertrophy and heart failure using mouse models of permanent coronary ligation and pressure overload-induced cardiac hypertrophy. Although global metabolic changes in the diseased heart have been studied before, these studies have been limited to the analysis of transgenic models (e.g., transgenic rats harboring human renin and angiotensin genes12) or animals with global metabolic dysfunction (e.g., salt-sensitive Dahl rats13). Clinical metabolomic profiling studies, on the other hand, have been restricted to measurements of plasma metabolites14, which reveal little about the metabolic changes in the heart and are often confounded by metabolites derived from non-cardiac sources or concurrent medical treatment. Hence, we examined metabolic changes in clinically-relevant models of hypertrophy and heart failure. Our results show extensive changes in amino acid, lipid and nucleotide metabolism and provide new understanding of the profound metabolic remodeling that accompanies hypertrophy and progression to heart failure.
Methods
Detailed Methods are provided in the Supplemental Supplement.
Animal surgeries
Adult, 2.75–4.25-month-old, male C57BL/6J mice were subjected to either TAC or MI, as described15, 16, in accordance with the University of Louisville Animal Care and Use Committee.
Sample preparation for metabolomic analysis
Details of sample preparation and metabolomic data analysis are described in the Supplemental Methods and Supplemental Figure I. After anesthesia, the hearts were excised, washed in ice-cold PBS to remove excess blood, and snap-frozen in liquid nitrogen. Metabolites were extracted with methanol, and then prepared for either LC/MS/MS or GC/MS analysis as described before 17.
Statistical considerations
Data are reported as mean ± SEM. TAC and sham groups were compared by ANOVA, followed by Bonferroni or Tukey post-tests. Unpaired t test was used for direct comparisons between MI and its corresponding sham group or when TAC samples at a specific time were compared with their corresponding sham group (e.g., Figure 1B and the Table). Principal component analysis, hierarchical clustering and heatmap analysis, volcano plot analysis, and Fisher’s exact tests were performed using Metaboanalyst 2.0 software (http://www.metaboanalyst.ca/), which was used also for basic parametric tests applied to metabolomic data and for calculating false discovery rates (FDR). Regression analyses were performed using GraphPad 5.0 software. P < 0.05 was considered significant.
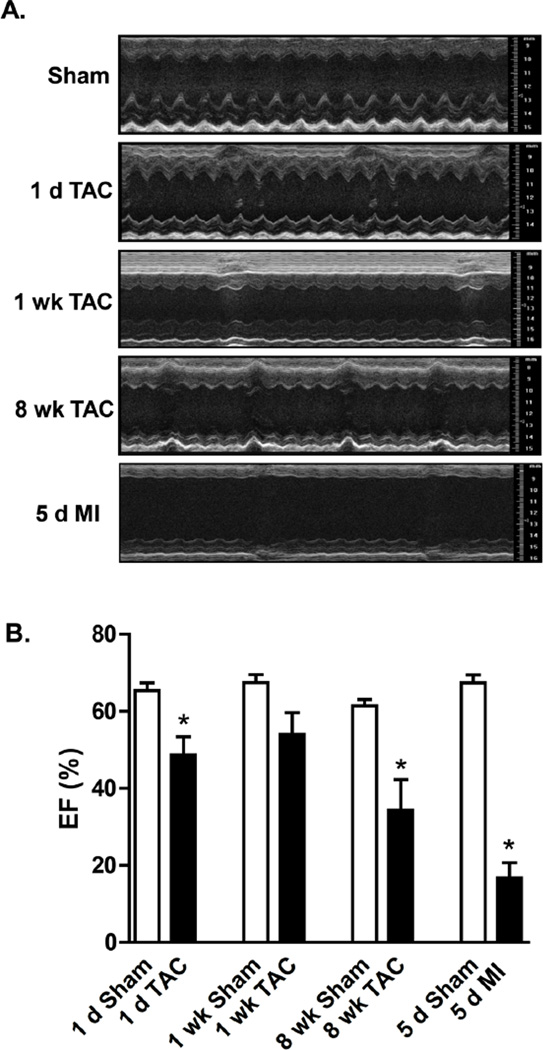
Figure 1. Cardiac echocardiography after sham surgery, transverse aortic constriction (TAC), or permanent coronary ligation (myocardial infarction; MI).
(A) Representative M-mode images. (B) Ejection fraction; n = 5–8 per group, *p<0.05. Other measurements are listed in the Table.
Table.
Phenotypic characteristics of C57BL/6J mice subjected to sham treatment, transverse aortic constriction (TAC), or permanent coronary ligation (MI).
| Group | n | Age (wk) |
BW (g) |
HR (bpm) |
LVIDD (mm) |
LVIDS (mm) |
IVSTD (mm) |
LVPWD (mm) |
LV mass (g) |
Vcfc (circ/sec) |
EDV (µl) |
ESV (µl) |
|---|---|---|---|---|---|---|---|---|---|---|---|---|
| 1 d Sham | 5 | 12 | 28.6±1.3 | 535±11 | 3.77±0.11 | 2.41±0.07 | 0.87±0.04 | 0.75±0.05 | 110±6 | 25.2±1.0 | 39.8±2.4 | 13.9±1.5 |
| 1 d TAC | 8 | 12 | 29.1±0.7 | 576±12* | 4.11±0.14 | 3.13±0.21* | 0.96±0.06 | 0.73±0.05 | 134±11 | 17.6±1.9* | 54.9±4.6* | 29.5±5.2* |
| 1 wk Sham | 6 | 12 | 28.8±1.0 | 516±27 | 3.87±0.10 | 2.32±0.19 | 0.72±0.06 | 0.55±0.04 | 83±7 | 27.5±3.5 | 49.1±2.4 | 16.0±1.5 |
| 1 wk TAC | 7 | 12 | 29.6±0.6 | 541±11 | 3.84±0.10 | 2.87±0.13* | 0.93±0.04* | 0.75±0.08* | 119±8* | 15.9±1.1* | 46.3±6.7 | 23.4±6.3 |
| 8 wk Sham | 5 | 20 | 27.2±1.1 | 493±7 | 4.02±0.17 | 2.69±0.15 | 0.80±0.09 | 0.65±0.07 | 106±15 | 19.7±1.4 | 57.7±5.0 | 22.1±1.8 |
| 8 wk TAC | 5 | 20 | 26.7±0.9 | 575±28* | 5.05±0.30* | 4.21±0.40* | 0.95±0.04 | 0.74±0.05 | 190±25* | 12.6±2.4* | 74.6±9.0 | 50.9±10.9* |
| 5 d Sham | 5 | 18 | 27.5±0.8 | 542±27 | 3.70±0.09 | 2.50±0.15 | 0.90±0.06 | 0.76±0.07 | 109±4 | 23.6±1.8 | 41.9±2.4 | 13.7±1.4 |
| 5 d MI | 7 | 18 | 28.8±0.9 | 598±20 | 5.84±0.33* | 5.53±0.36* | 0.67±0.08 | 0.52±0.09 | 160±26 | 4.8±1.2* | 119.0±15.4* | 102.0±16.6* |
p<0.05 vs. matched sham group (unpaired t-test); BW, body weight; HR, heart rate; LVIDD, left ventricular internal diameter in diastole; LVIDS, left ventricular internal diameter in systole; IVSTD, interventricular septal thickness in diastole; LVPWD, left ventricular posterior wall in diastole; LV mass, left ventricular mass; Vcfc, velocity of circumferential shortening; EDV, end diastolic volume; ESV, end systolic volume
Results
Cardiac Echocardiography
Both TAC and MI led to contractile dysfunction (Figure 1A). Left ventricular (LV) function, as measured by ejection fraction (EF), was significantly reduced at 1 d and 8 weeks of TAC, but not after 1 week of TAC; MI produced more severe reductions in EF (Figure 1B). End diastolic volume (EDV) and end systolic volume (ESV) were increased with MI and TAC after 1 d. These changes and other phenotypic characteristics are shown in the Table. Collectively, these results show that 8 weeks of TAC and 5 d of MI led to ventricular dilation and a significant reduction in EF.
Changes in myocardial metabolites
Using an unbiased, non-targeted metabolomic approach18, the relative concentrations of myocardial metabolites were measured by mass spectrometry and queried against the Metabolon reference library. Of the 288 metabolites measured, 41% and 24% of the metabolites were lipids and amino acids, respectively. The remaining metabolite superfamilies represented 3–12% of the total metabolites measured in the study (Supplemental Figure II-A). Pressure overload for 1 d resulted in minimal changes in metabolites, whereas longer durations of TAC caused more significant metabolic changes.. In hearts subjected to MI, ~40% of the metabolites differed significantly from metabolites in sham-operated hearts (Supplemental Figure II-B).
TAC-mediated metabolite changes
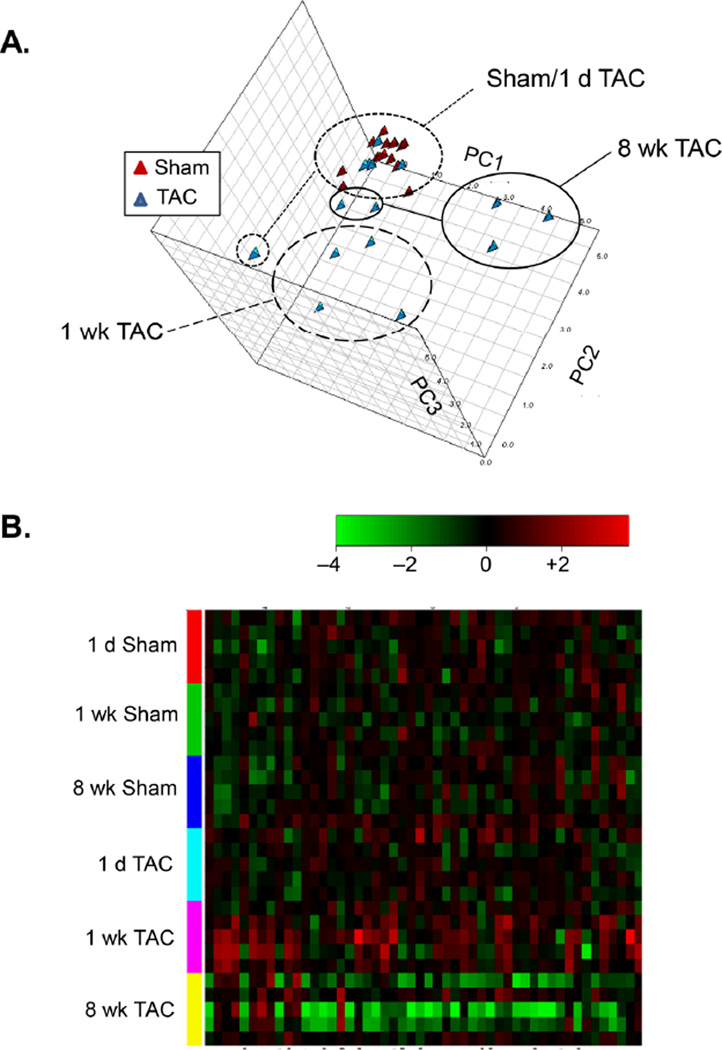
Principal component analysis (PCA) of global changes showed that sham samples clearly separate from the 1 week and 8 week TAC samples (Figure 2A). This is corroborated by heatmap cluster analysis, which showed that the metabolites significantly different in the TAC groups were sufficient to separate the groups (Figure 2B). Metabolic changes after TAC were time-dependent (Supplemental Table I). The 1 d TAC group, with exception for one sample, was indistinguishable from the sham group, whereas 1 week of TAC showed an increase in amino acids and their metabolites. Polyamine metabolites such as putrescine and spermidine were increased after both 1 week and 8 weeks of TAC as was the tryptophan metabolite, C-glycosyltryptophan. A longer duration of TAC (8 weeks) led to a decrease in the abundance of pyruvate, flavin adenine dinucleotide (FAD+), and multiple members of the lipid superfamily. One week after TAC, there was a 2-fold increase in phosphoethanolamine levels, which was decreased by 50% by 8 weeks (Supplemental Table I).
Figure 2. Stage-specific grouping of pressure-overloaded hearts based on metabolic profile.
(A) PCA analysis of cardiac metabolites after 1 d and 1 and 8 weeks of TAC compared with their respective shams. (B) Hierarchal cluster analysis of the 50 most significant TAC-affected metabolites; n = 5 per group. A complete list of metabolites significantly different in TAC compared with sham hearts is shown in Supplemental Table I.
MI-induced metabolic changes
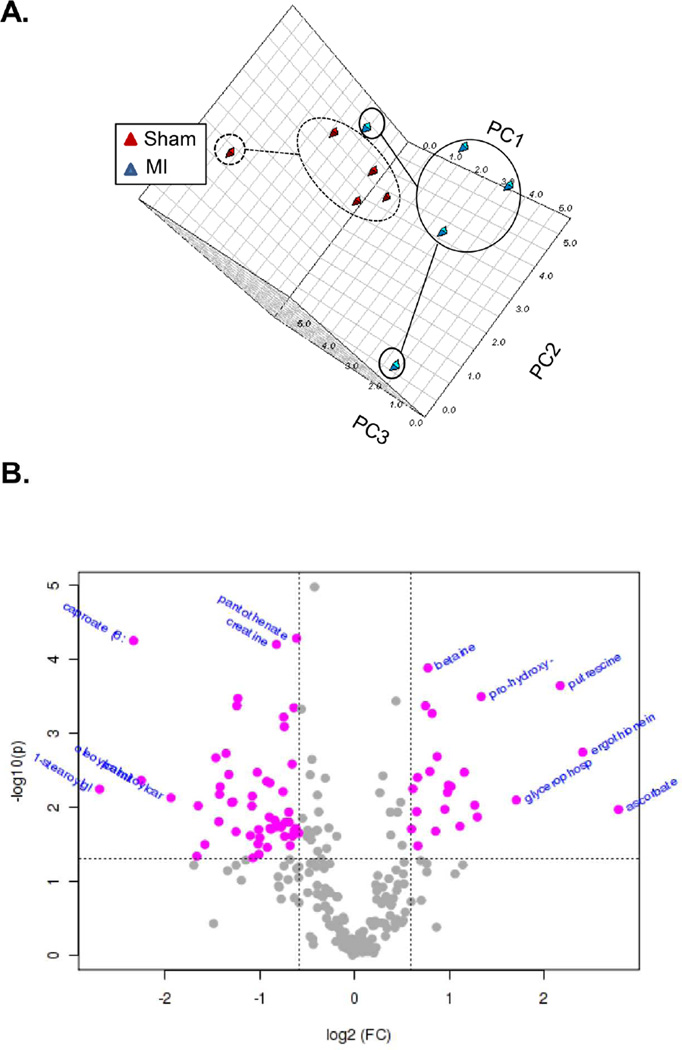
PCA analysis of sham versus MI samples showed a clear separation between groups (Figure 3A): 87 of the 288 metabolites analyzed were significantly different from sham (Supplemental Table II). The false discovery rate (FDR) of most significantly changed metabolites was < 0.1. Volcano plot analysis (Figure 3B) shows that the levels of the osmolyte–betaine, as well as the markers of fibrosis (pro-hydroxy-pro and putrescine) and ascorbate were elevated; pantothenate, creatine, and several lipids, notably acylcarnitines such as oleoylcarnitine and palmitoylcarnitine, were reduced. Heme was detected in all 5 of the MI samples and in some of the TAC samples, but not in any of the sham samples. Similarly, dehydroascorbate was detected in only 1 sham sample, but was found in 4 MI samples.
Figure 3. Metabolic changes in myocardial metabolites after infarction.
(A) PCA analysis of MI and sham groups. (B) Volcano plot analysis of metabolic changes in infarcted hearts (compared with sham hearts); n = 5 per group; for volcano analysis, the fold-change threshold was 1.5 (x-axis) and the p value threshold was set at 0.05 (y-axis). Values in pink were found to be significantly different. Metabolites significantly changed after MI are listed in Supplemental Table II.
Metabolic changes unique to TAC or MI
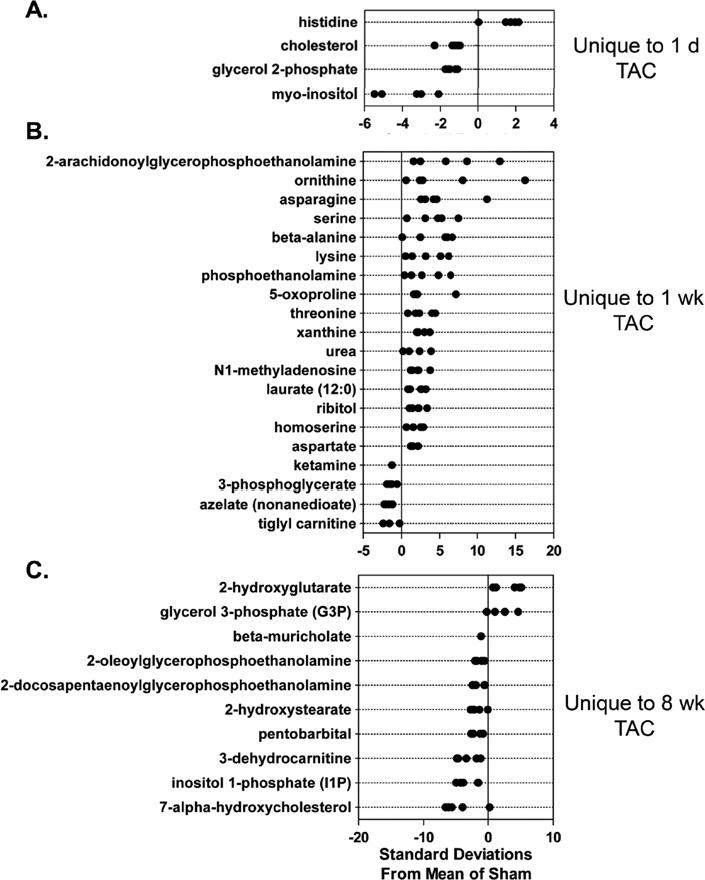
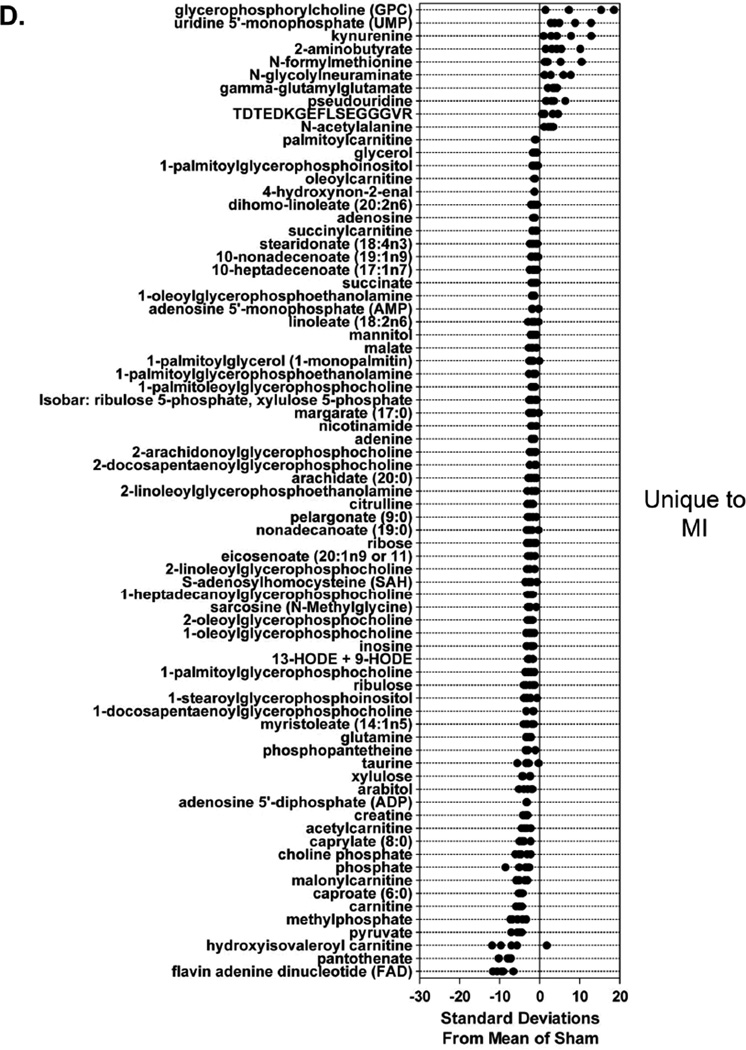
Z-score plots were constructed to identify metabolic changes distinct to each group. One day of TAC resulted in changes in only 4 (out of 288) metabolites (Figure 4A); however, 20 metabolites exclusive to hearts after 1 week of TAC were identified, with remarkable changes in 2-arachidonylglyerophosphethanolamine and several amino acids (Figure 4B). Eight weeks of TAC reduced the levels of several members of the lipid superfamily, although levels of 2-hydroxyglutarate and glycerol-3-phosphate were increased (Figure 4C).
Figure 4. Different stages of ventricular dysfunction show unique metabolic signatures.
Z-score plot analysis of metabolic changes unique to TAC or MI: Metabolic changes unique to (A) 1 d; (B) 1 week; and (C) 8 weeks of TAC; and (D) 5 d of MI. Data are shown as standard deviation from the mean of respective sham. Each dot represents a single metabolite in one sample; n = 5 per group.
A total of 75 metabolites were changed exclusively in infarcted hearts (Figure 4D). Large increases in glycerophosphorycholine, some pyrimidines and pyrimidine metabolites, peptides such as γ-glutamylglutamate and TDTEDKGEFLSEGGGVR (fibrinogen alpha polypeptide), and N-formylmethionine were increased in MI samples. However, decreases in metabolites involved in lipid and energy metabolism, such as several lysophospholipids, carnitine, and acylcarnitines, were unique to the failing heart. Levels of metabolites central to energy provision such as pantothenate (and its downstream metabolite phosphopantetheine), FAD+, pyruvate, creatine, malate, and succinylcarnitine were also diminished (Figure 4D), suggesting a decrease in biochemical energy transfer processes.
Metabolic changes common to both treatment groups
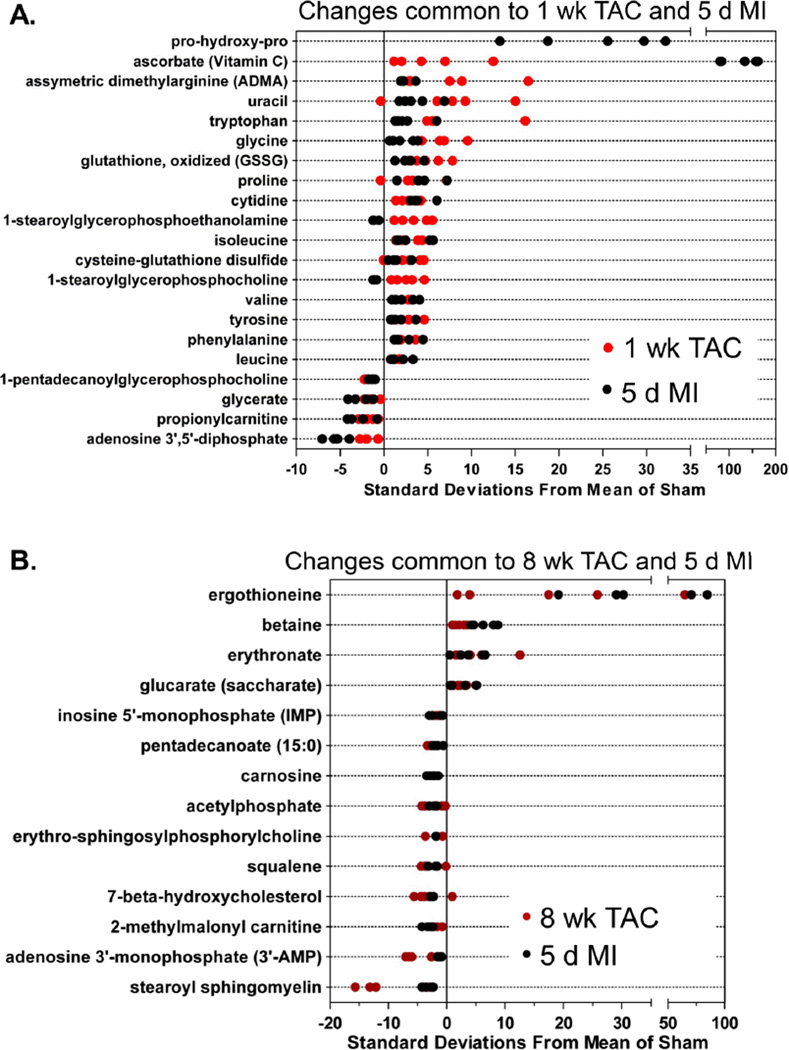
To examine metabolic changes common to both TAC and MI, metabolites affected in both groups were plotted. As shown in Figure 5A, changes in pro-hydroxy-pro, uracil, asymmetric dimethylarginine (ADMA), and several amino acids occurred in both the 1 week TAC and 5 d MI groups. Pro-hydroxy-pro was not plotted for the 1 week TAC group because this metabolite was undetectable in the 1 week sham group; hence, the z-score could not be calculated. Regardless, pro-hydroxy-pro was detected after 1 week of TAC and was higher after MI than in sham control. Both in MI and 1 week TAC hearts, indices of oxidative stress—oxidized glutathione (GSSG) and cysteine-glutathione disulfide—were increased, whereas 1-pentadecanoylglycerophosphocholine, glycerate, proprionylcarnitine, and adenosine-3’, 5’-diphosphate were less abundant.
Figure 5. Metabolic changes common to both TAC and MI.
Z-score plot analysis of metabolic changes common between: (A) 1 week TAC and 5 d MI; (B) 8 week TAC and 5 d MI; and (C) 1 week TAC, 8 week TAC and 5 d MI. There were no shared changes with 1 d TAC group. In each plot, the data are shown as standard deviation from the mean of their respective sham. Each dot represents a single metabolite in one sample. n = 5 per group.
Metabolic changes common to MI and 8 week TAC are shown in Figure 5B. Ergothioneine, an antioxidant and thiourea derivative of the betaine of histidine, was increased in both the MI and 8 week TAC groups. Betaine (trimethylglycine) was also increased, as were glucarate and erythronate, which can be formed when N-acetyl-D-glucosamine (GlcNAc) is oxidized. Interestingly, MI, 1 week and 8 week TAC all led to an increase in the C-mannosylated amino acid, C-glycosyltryptohan and methionine, as well as metabolites indicative of the fibrotic response, i.e., putrescine and spermidine (Figure 5C).
Pathway impact analyses
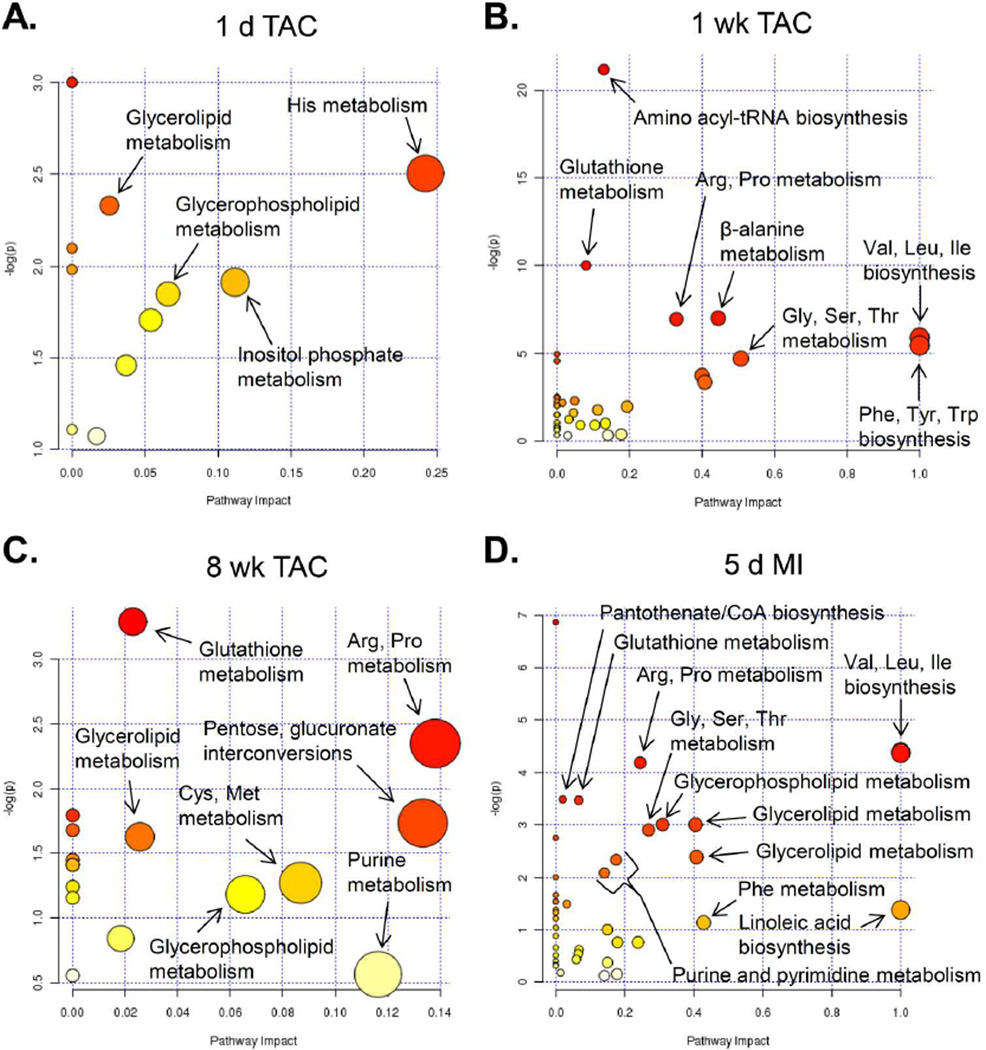
To examine the data in the context of metabolic pathways, pathway impact was calculated as the sum of the importance measures of the matched metabolites normalized by the sum of the importance measures of all metabolites in each pathway. While little pathway impact was calculated from the 1 d TAC group (Figure 6A), the highest pathway impact values in the 8 week TAC group were related with arginine and proline metabolism, pentose/glucuronate interconversions, cysteine/methionine metabolism, and glutathione metabolism. The highest pathway impact for the MI and 1 week TAC groups (Figure 6B,D) was due to branched chain amino acid (BCAA) metabolism (i.e., Val, Leu, Ile metabolism). Other amino acid metabolic pathways, glycerolipid metabolism, purine and pyrimidine metabolism, and linoleic acid biosynthesis also showed relatively high impact scores.
Figure 6. Pathway impact analysis of metabolic changes.
Metabolites showing significant changes were analyzed using Metaboanalyst MetPA and the Mus musculus pathway library: (A) 1 d; (B) 1 week; and (C) 8 weeks of TAC; and (D) 5 d of MI. Fisher’s exact test was used for overrepresentation analysis, and relative between-ness centrality was used for pathway topology analysis; n = 5 per group.
Confirmation of metabolite changes in the failing heart
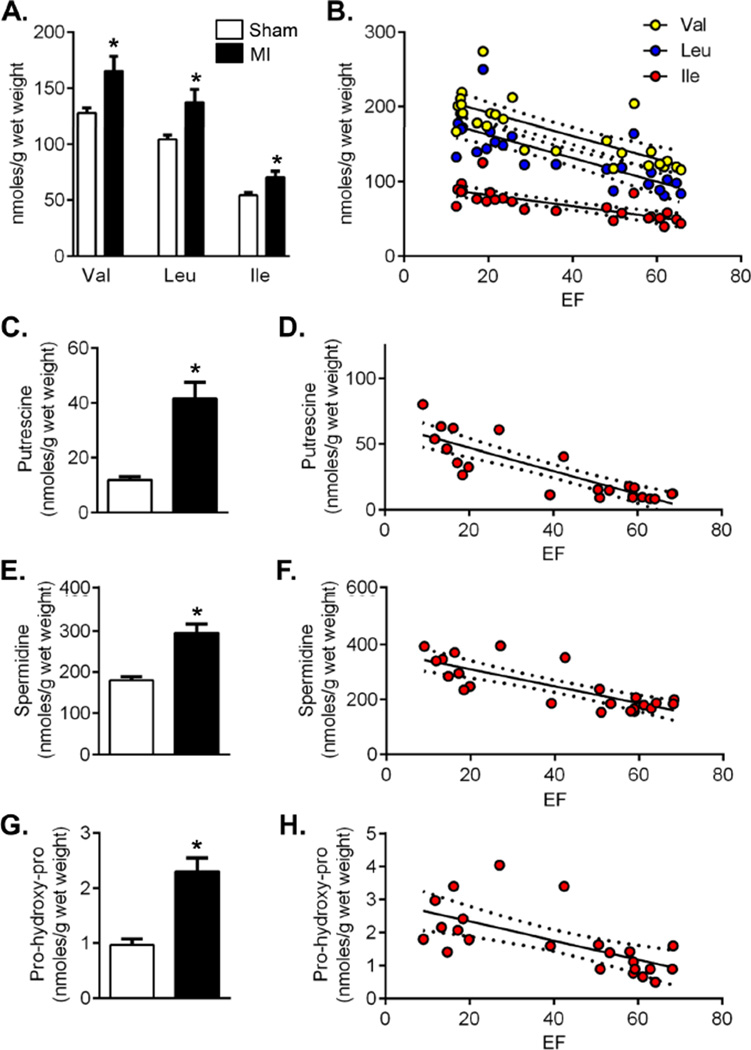
Changes in metabolites that showed the highest pathway impact and were prominently associated with MI and TAC were confirmed by additional GC/MS analysis using internal controls. This analysis showed that the absolute abundance of BCAAs was increased significantly in the failing heart (Figure 7A) and was highly correlated with EF (Figure 7B). Levels of both putrescine and spermidine were elevated at 5 d of MI, and correlated well with myocardial function (Figure 7B–7E). The severity of heart failure was also significantly associated with an increase in the concentration of pro-hydroxy-pro (Figure 7G,H).
Figure 7. Heart failure increases BCAAs, polyamines, and proyllhydroxyproline.
GC/MS analysis of cardiac metabolites after 5 d sham and 5 d MI: (A) BCAA levels; (B) Regression analysis of BCAA levels vs. ejection fraction (EF): R2 = Val, 0.59; Leu, 0.61; Ile, 0.59; all p<0.0001; (C) Putrescine levels; (D) Regression analysis of putrescine levels vs. EF: R2 = 0.73, p<0.0001; (E) Spermidine levels; (F) Regression analysis of spermidine levels vs. EF: R2 = 0.63, p<0.0001; (G) Pro-hydroxy-pro levels; (H) Regression analysis of pro-hydroxy-pro levels vs. EF: R2 = 0.41, p=0.0009; n = 10–13 per group; *p<0.05 vs. sham (unpaired t-test); in regression analyses, dotted lines indicate 95% confidence intervals.
Discussion
The results of this study reveal profound and progressive changes in the metabolic profiles of hearts subjected to pressure overload or MI. Hearts subjected to these procedures displayed similar changes in amino acid, glycerolipid, and nucleotide metabolism with little accumulation of fatty acids or glycolytic intermediates, suggesting dysregulation of common metabolic pathways. These findings reveal novel metabolic features of hypertrophic and failing hearts and identify potential biomarkers and therapeutic targets.
Amino acid metabolism
One of the most remarkable metabolic changes we found was an increase in branched chain amino acids (BCAAs). Our results show extensive and pervasive increases in BCAAs in both pressure-overloaded and infarcted hearts that are associated with myocardial insulin resistance (Supplemental Figure III). Previous work has shown that elevated plasma levels of BCAAs are associated with metabolic risk factors19 and insulin resistance in humans20. Elevated BCAA levels have been linked to the development of insulin in rodents as well21. Although myocardial insulin resistance is associated with cardiac hypertrophy in humans22 and dogs23, experiments in mice have produced conflicting results10, 11. Data presented here show that insulin resistance in the failing heart corresponds with increased cardiac levels of BCAAs with no changes in plasma BCAA levels (Supplemental Figure IV). Changes in other cellular processes such protein synthesis, amino acid transport, or autophagy—all of which are increased during cardiac hypertrophy24–27—could also affect amino acid levels in the heart; however, it is unclear how these processes might contribute to changes in myocardial amino acids. Clearly, further work is required to determine how changes in BCAA metabolism contribute to metabolic dysregulation in heart failure.
Lipid metabolism
Myocardial decompensation and failure were associated with extensive changes in lipid metabolism. We found a significant decrease in the levels of several sphingolipids, which could be due to increased utilization or decreased synthesis. While we cannot firmly distinguish between these possibilities, it is likely that sphingolipids are depleted due to increased utilization. Sphingosine is used for the synthesis of ceramide, which has been shown to be increased in failing and hypertrophied hearts28, 29.Recent studies suggest that de novo sphingolipid synthesis is essential for myocardial hypertrophy in mice fed a high-fat diet and that sphingolipids are required for the induction of cardiac autophagy 30. Alternatively, sphingolipids could be depleted due to neutral sphingomyelinase (SMase), which is activated during heart failure31. The activation of SMase has been linked to changes in the glutathione redox state32, which was a prominent finding in our study. Interestingly, phosphoethanolamine (PE), which is downstream of sphingosine in PE phospholipid synthesis, was also decreased. Collectively, these data suggest that myocardial decompensation is associated with decreased PE phospholipid synthesis.
The decrease in lysolipids after TAC or MI could be attributed to reduced membrane turnover. However, this is not supported by the observed increase in the products of membrane phospholipid catabolism such as glycerophosphorylcholine and glycerol 3-phosphate. Thus, it seems more likely that there is an increase in phospholipid degradation, which would be consistent with studies showing marked changes in phospholipid metabolism in pressure-overloaded hearts33 and accelerated phospholipid degradation in the ischemic myocardium34.
Energy metabolism
Previous investigations studying metabolic changes in hypertrophic and failing hearts have shown progressive inhibition of fatty acid metabolism and an increased reliance on carbohydrate metabolism3, 35. We found lower levels of free fatty acids in hearts subjected to MI and 8 weeks of TAC, and decreased abundance of multiple acylcarnitines. While the mechanisms underlying these changes remain unclear, it has been shown that in humans with heart failure, myocardial fatty acid turnover and oxidation rates are increased36, 37, but myocardial uptake and retention of fatty acids are impaired38, 39. Therefore, diminished fatty acid uptake along with increased utilization could account for the diminished abundance of acylcarnitines observed in our study. Nevertheless, further work is required to support this conclusion, because a decrease in acylcarnitine could also be due to more general changes in carnitine metabolism40, 41, decreased acylcarnitine synthesis, or reduced fatty acid oxidation..
Though it is widely held that the hypertrophied and failing heart demonstrate increased glycolysis35, we did not find changes in many glycolytic intermediates. Only pyruvate was observed at lower levels in TAC hearts (see Supplemental Table I), and the infarcted heart showed >2-fold decrease in pyruvate (p=0.053). It has been shown that lactate dehydrogenase activity is increased in experimental models of cardiac hypertrophy42, 43, which could account for pyruvate depletion. In support of this, myocardial lactate/pyruvate ratios were elevated 2.5-fold in infarcted hearts (see Online Data), which is consistent with an increase in anaerobic metabolism. Increased flux of pyruvate through the Krebs cycle by anaplerosis is another possibility. In hypertrophied hearts, an ~80% increase in anaplerotic flux was associated with elevated malate levels44, 45, which suggests that the pyruvate-malate pathway (regulated by malic enzyme) is increased the hypertrophic heart. However, we found that malate was decreased in the failing heart and unaltered in hearts subjected to TAC. Thus, even though a 2-fold increase malate has been reported in hypertrophic rat hearts perfused ex vivo44, no increase in malate content in hearts in vivo could indicate limited contribution of anaplerotic flux through malic enzyme. Depletion of pyruvate could also be attributed to transamination to alanine, as pyruvate is an acceptor of amino groups generated from protein breakdown. Therefore, given the profound increase in free amino acids observed in this study, it is possible that pyruvate depletion may be related to increased amino acid formation and the formation of keto-acids for energy metabolism.
In contrast to previous studies, which showed no change in the pentose phosphate pathway in hypertrophied, perfused rat hearts46, the current study showed that levels of several pentose phosphate pathway intermediates are lower in hearts subjected to MI and TAC. This suggests a potential decrease in anabolic metabolism during myocardial decompensation, which may be an adaptation to oxidative stress, as previous studies show that pentose phosphate pathway-derived NADPH fuels superoxide production in the failing heart47. Increased myocardial stress is also in agreement with elevated UDP-GlcNAc levels in hearts subjected to TAC, which is consistent with increased O-GlcNAc signaling that occurs with pharmacological or TAC-induced cardiomyocyte hypertrophy16 and heart failure15.
Oxidative stress
The remarkable 50-fold increase in ascorbate levels in failing hearts provides further evidence of oxidative stress. The immediate precursor of ascorbate, gulono-1,4-lactone, also was elevated to levels approaching statistical significance, suggesting that there might be an increase in ascorbate biosynthesis. Interestingly, infarcted hearts contained high levels of heme, which in the presence of ferrous iron and ascorbate could generate oxidants48, 49 and contribute to oxidative stress in the failing heart.
Markers of cardiac remodeling
We found that C-glycosyltryptophan, polyamines, and pro-hydroxy-pro were markedly elevated both after MI and TAC. These metabolites have been found previously to be elevated in the plasma of patients with dilated cardiomyopathy50, although the tissue of origin was not identified. Although we found that these metabolites were increased in the heart, which could be indicative of cardiac remodeling, we did not observe a concomitant increase in their plasma levels (Supplemental Figure IV). Thus, elevations of these metabolites in plasma may not be reflective of their changes in the myocardium.
Limitations
Our study has several limitations. First, even though we measured a large number of metabolites, important metabolites such as fructose 1,6- and 2,6-bisphosphate, pyridine nucleotides, ATP/ADP, and malonyl CoA could not be detected because of technical limitations. Moreover, as with any metabolomic study, only the levels, but not the fluxes of the metabolites were measured. This limitation prevented us from estimating changes in the activity of individual metabolic pathways. Lastly, it is possible that isolation of hearts prior to metabolite extraction could have produced artifactual changes; however, we consider this unlikely because ischemia prior to freezing would have induced high variability in lactate/pyruvate ratios, which was not observed.
Supplementary Material
Acknowledgments
The authors wish to thank Dr. Shesh Rai for statistical consultation.
Sources of Funding
This work was supported in part by NIH grants (GM103492, HL78825, HL83320, HL55477, and HL94419).
Footnotes
Disclosures
None.
References
- 1.Olson RE, Schwartz WB. Myocardial metabolism in congestive heart failure. Medicine. 1951;30:21–41. doi: 10.1097/00005792-195102000-00002. [DOI] [PubMed] [Google Scholar]
- 2.Ingwall JS, Weiss RG. Is the failing heart energy starved? On using chemical energy to support cardiac function. Circ Res. 2004;95:135–145. doi: 10.1161/01.RES.0000137170.41939.d9. [DOI] [PubMed] [Google Scholar]
- 3.Ashrafian H, Frenneaux MP, Opie LH. Metabolic mechanisms in heart failure. Circulation. 2007;116:434–448. doi: 10.1161/CIRCULATIONAHA.107.702795. [DOI] [PubMed] [Google Scholar]
- 4.Stanley WC, Recchia FA, Lopaschuk GD. Myocardial substrate metabolism in the normal and failing heart. Physiol Rev. 2005;85:1093–1129. doi: 10.1152/physrev.00006.2004. [DOI] [PubMed] [Google Scholar]
- 5.Lopaschuk GD, Ussher JR, Folmes CD, Jaswal JS, Stanley WC. Myocardial fatty acid metabolism in health and disease. Physiol Rev. 2010;90:207–258. doi: 10.1152/physrev.00015.2009. [DOI] [PubMed] [Google Scholar]
- 6.Allard MF, Schonekess BO, Henning SL, English DR, Lopaschuk GD. Contribution of oxidative metabolism and glycolysis to atp production in hypertrophied hearts. Am J Physiol. 1994;267:H742–H750. doi: 10.1152/ajpheart.1994.267.2.H742. [DOI] [PubMed] [Google Scholar]
- 7.Christe ME, Rodgers RL. Altered glucose and fatty acid oxidation in hearts of the spontaneously hypertensive rat. J Mol Cell Cardiol. 1994;26:1371–1375. doi: 10.1006/jmcc.1994.1155. [DOI] [PubMed] [Google Scholar]
- 8.Chandler MP, Kerner J, Huang H, Vazquez E, Reszko A, Martini WZ, Hoppel CL, Imai M, Rastogi S, Sabbah HN, Stanley WC. Moderate severity heart failure does not involve a downregulation of myocardial fatty acid oxidation. Am J Physiol Heart Circ Physiol. 2004;287:H1538–H1543. doi: 10.1152/ajpheart.00281.2004. [DOI] [PubMed] [Google Scholar]
- 9.Remondino A, Rosenblatt-Velin N, Montessuit C, Tardy I, Papageorgiou I, Dorsaz PA, Jorge-Costa M, Lerch R. Altered expression of proteins of metabolic regulation during remodeling of the left ventricle after myocardial infarction. J Mol Cell Cardiol. 2000;32:2025–2034. doi: 10.1006/jmcc.2000.1234. [DOI] [PubMed] [Google Scholar]
- 10.Shimizu I, Minamino T, Toko H, Okada S, Ikeda H, Yasuda N, Tateno K, Moriya J, Yokoyama M, Nojima A, Koh GY, Akazawa H, Shiojima I, Kahn CR, Abel ED, Komuro I. Excessive cardiac insulin signaling exacerbates systolic dysfunction induced by pressure overload in rodents. J Clin Invest. 2010;120:1506–1514. doi: 10.1172/JCI40096. [DOI] [PMC free article] [PubMed] [Google Scholar]
- 11.Zhang L, Jaswal JS, Ussher JR, Sankaralingam S, Wagg C, Zaugg M, Lopaschuk GD. Cardiac insulin-resistance and decreased mitochondrial energy production precede the development of systolic heart failure after pressure-overload hypertrophy. Circulation. Heart failure. 2013;6:1039–1048. doi: 10.1161/CIRCHEARTFAILURE.112.000228. [DOI] [PubMed] [Google Scholar]
- 12.Mervaala E, Biala A, Merasto S, Lempiainen J, Mattila I, Martonen E, Eriksson O, Louhelainen M, Finckenberg P, Kaheinen P, Muller DN, Luft FC, Lapatto R, Oresic M. Metabolomics in angiotensin ii-induced cardiac hypertrophy. Hypertension. 2010;55:508–515. doi: 10.1161/HYPERTENSIONAHA.109.145490. [DOI] [PubMed] [Google Scholar]
- 13.Kato T, Niizuma S, Inuzuka Y, Kawashima T, Okuda J, Tamaki Y, Iwanaga Y, Narazaki M, Matsuda T, Soga T, Kita T, Kimura T, Shioi T. Analysis of metabolic remodeling in compensated left ventricular hypertrophy and heart failure. Circ Heart Fail. 2010;3:420–430. doi: 10.1161/CIRCHEARTFAILURE.109.888479. [DOI] [PubMed] [Google Scholar]
- 14.Shah SH, Kraus WE, Newgard CB. Metabolomic profiling for the identification of novel biomarkers and mechanisms related to common cardiovascular diseases: Form and function. Circulation. 2012;126:1110–1120. doi: 10.1161/CIRCULATIONAHA.111.060368. [DOI] [PMC free article] [PubMed] [Google Scholar]
- 15.Watson LJ, Facundo HT, Ngoh GA, Ameen M, Brainard RE, Lemma KM, Long BW, Prabhu SD, Xuan YT, Jones SP. O-linked beta-n-acetylglucosamine transferase is indispensable in the failing heart. Proc Natl Acad Sci U S A. 2010;107:17797–17802. doi: 10.1073/pnas.1001907107. [DOI] [PMC free article] [PubMed] [Google Scholar]
- 16.Facundo HT, Brainard RE, Watson LJ, Ngoh GA, Hamid T, Prabhu SD, Jones SP. O-glcnac signaling is essential for nfat-mediated transcriptional reprogramming during cardiomyocyte hypertrophy. Am J Physiol Heart Circ Physiol. 2012;302:H2122–H2130. doi: 10.1152/ajpheart.00775.2011. [DOI] [PMC free article] [PubMed] [Google Scholar]
- 17.Sansbury BE, Cummins TD, Tang Y, Hellmann J, Holden CR, Harbeson MA, Chen Y, Patel RP, Spite M, Bhatnagar A, Hill BG. Overexpression of endothelial nitric oxide synthase prevents diet-induced obesity and regulates adipocyte phenotype. Circulation Research. 2012;111:1176–1189. doi: 10.1161/CIRCRESAHA.112.266395. [DOI] [PMC free article] [PubMed] [Google Scholar]
- 18.Ryals J, Lawton K, Stevens D, Milburn M. Metabolon, inc. Pharmacogenomics. 2007;8:863–866. doi: 10.2217/14622416.8.7.863. [DOI] [PubMed] [Google Scholar]
- 19.Cheng S, Rhee EP, Larson MG, Lewis GD, McCabe EL, Shen D, Palma MJ, Roberts LD, Dejam A, Souza AL, Deik AA, Magnusson M, Fox CS, O'Donnell CJ, Vasan RS, Melander O, Clish CB, Gerszten RE, Wang TJ. Metabolite profiling identifies pathways associated with metabolic risk in humans. Circulation. 2012;125:2222–2231. doi: 10.1161/CIRCULATIONAHA.111.067827. [DOI] [PMC free article] [PubMed] [Google Scholar]
- 20.Adams SH. Emerging perspectives on essential amino acid metabolism in obesity and the insulin-resistant state. Adv Nutr. 2011;2:445–456. doi: 10.3945/an.111.000737. [DOI] [PMC free article] [PubMed] [Google Scholar]
- 21.Newgard CB, An J, Bain JR, Muehlbauer MJ, Stevens RD, Lien LF, Haqq AM, Shah SH, Arlotto M, Slentz CA, Rochon J, Gallup D, Ilkayeva O, Wenner BR, Yancy WS, Jr., Eisenson H, Musante G, Surwit RS, Millington DS, Butler MD, Svetkey LP. A branched-chain amino acid-related metabolic signature that differentiates obese and lean humans and contributes to insulin resistance. Cell Metab. 2009;9:311–326. doi: 10.1016/j.cmet.2009.02.002. [DOI] [PMC free article] [PubMed] [Google Scholar]
- 22.Paternostro G, Camici PG, Lammerstma AA, Marinho N, Baliga RR, Kooner JS, Radda GK, Ferrannini E. Cardiac and skeletal muscle insulin resistance in patients with coronary heart disease. A study with positron emission tomography. J Clin Invest. 1996;98:2094–2099. doi: 10.1172/JCI119015. [DOI] [PMC free article] [PubMed] [Google Scholar]
- 23.Nikolaidis LA, Sturzu A, Stolarski C, Elahi D, Shen YT, Shannon RP. The development of myocardial insulin resistance in conscious dogs with advanced dilated cardiomyopathy. Cardiovas Res. 2004;61:297–306. doi: 10.1016/j.cardiores.2003.11.027. [DOI] [PubMed] [Google Scholar]
- 24.Gudbjarnason S, Telerman M, Bing RJ. Protein metabolism in cardiac hypertrophy and heart failure. Am J Physiol. 1964;206:294–298. doi: 10.1152/ajplegacy.1964.206.2.294. [DOI] [PubMed] [Google Scholar]
- 25.Nagai R, Low RB, Stirewalt WS, Alpert NR, Litten RZ. Efficiency and capacity of protein synthesis are increased in pressure overload cardiac hypertrophy. Am J Physiol. 1988;255:H325–H328. doi: 10.1152/ajpheart.1988.255.2.H325. [DOI] [PubMed] [Google Scholar]
- 26.Koide T, Ozeki K. Increased amino acid transport in experimentally hypertrophied rat heart. Jpn Heart J. 1971;12:177–184. doi: 10.1536/ihj.12.177. [DOI] [PubMed] [Google Scholar]
- 27.Mizushima N, Klionsky DJ. Protein turnover via autophagy: Implications for metabolism. Annu Rev Nutr. 2007;27:19–40. doi: 10.1146/annurev.nutr.27.061406.093749. [DOI] [PubMed] [Google Scholar]
- 28.Pellieux C, Montessuit C, Papageorgiou I, Pedrazzini T, Lerch R. Differential effects of high-fat diet on myocardial lipid metabolism in failing and nonfailing hearts with angiotensin ii-mediated cardiac remodeling in mice. Am J Physiol Heart Circ Physiol. 2012;302:H1795–H1805. doi: 10.1152/ajpheart.01023.2011. [DOI] [PubMed] [Google Scholar]
- 29.He L, Kim T, Long Q, Liu J, Wang P, Zhou Y, Ding Y, Prasain J, Wood PA, Yang Q. Carnitine palmitoyltransferase-1b deficiency aggravates pressure overload-induced cardiac hypertrophy caused by lipotoxicity. Circulation. 2012;126:1705–1716. doi: 10.1161/CIRCULATIONAHA.111.075978. [DOI] [PMC free article] [PubMed] [Google Scholar]
- 30.Russo SB, Baicu CF, Van Laer A, Geng T, Kasiganesan H, Zile MR, Cowart LA. Ceramide synthase 5 mediates lipid-induced autophagy and hypertrophy in cardiomyocytes. J Clin Invest. 2012;122:3919–3930. doi: 10.1172/JCI63888. [DOI] [PMC free article] [PubMed] [Google Scholar]
- 31.Pavoine C, Pecker F. Sphingomyelinases: Their regulation and roles in cardiovascular pathophysiology. Cardiovasc Res. 2009;82:175–183. doi: 10.1093/cvr/cvp030. [DOI] [PMC free article] [PubMed] [Google Scholar]
- 32.Liu B, Hannun YA. Inhibition of the neutral magnesium-dependent sphingomyelinase by glutathione. J Biol Chem. 1997;272:16281–16287. doi: 10.1074/jbc.272.26.16281. [DOI] [PubMed] [Google Scholar]
- 33.Reibel DK, O'Rourke B, Foster KA, Hutchinson H, Uboh CE, Kent RL. Altered phospholipid metabolism in pressure-overload hypertrophied hearts. Am J Physiol. 1986;250:H1–H6. doi: 10.1152/ajpheart.1986.250.1.H1. [DOI] [PubMed] [Google Scholar]
- 34.Chien KR, Peau RG, Farber JL. Ischemic myocardial cell injury. Prevention by chlorpromazine of an accelerated phospholipid degradation and associated membrane dysfunction. Am J Pathol. 1979;97:505–529. [PMC free article] [PubMed] [Google Scholar]
- 35.Sambandam N, Lopaschuk GD, Brownsey RW, Allard MF. Energy metabolism in the hypertrophied heart. Heart Fail Rev. 2002;7:161–173. doi: 10.1023/a:1015380609464. [DOI] [PubMed] [Google Scholar]
- 36.Paolisso G, Gambardella A, Galzerano D, D'Amore A, Rubino P, Verza M, Teasuro P, Varricchio M, D'Onofrio F. Total-body and myocardial substrate oxidation in congestive heart failure. Metabolism. 1994;43:174–179. doi: 10.1016/0026-0495(94)90241-0. [DOI] [PubMed] [Google Scholar]
- 37.Lommi J, Kupari M, Yki-Jarvinen H. Free fatty acid kinetics and oxidation in congestive heart failure. Am J Cardiol. 1998;81:45–50. doi: 10.1016/s0002-9149(97)00804-7. [DOI] [PubMed] [Google Scholar]
- 38.Kataoka K, Nohara R, Hosokawa R, Hirai T, Okuda K, Li-Guang C, Fujibayashi Y, Fujita M, Konishi J, Sasayama S. Myocardial lipid metabolism in compensated and advanced stages of heart failure: Evaluation by canine pacing model with bmipp. J Nucl Med. 2001;42:124–129. [PubMed] [Google Scholar]
- 39.Tuunanen H, Engblom E, Naum A, Scheinin M, Nagren K, Airaksinen J, Nuutila P, Iozzo P, Ukkonen H, Knuuti J. Decreased myocardial free fatty acid uptake in patients with idiopathic dilated cardiomyopathy: Evidence of relationship with insulin resistance and left ventricular dysfunction. J Card Fail. 2006;12:644–652. doi: 10.1016/j.cardfail.2006.06.005. [DOI] [PubMed] [Google Scholar]
- 40.Rennison JH, McElfresh TA, Okere IC, Patel HV, Foster AB, Patel KK, Stoll MS, Minkler PE, Fujioka H, Hoit BD, Young ME, Hoppel CL, Chandler MP. Enhanced acyl-coa dehydrogenase activity is associated with improved mitochondrial and contractile function in heart failure. Cardiovas Res. 2008;79:331–340. doi: 10.1093/cvr/cvn066. [DOI] [PubMed] [Google Scholar]
- 41.Wittels B, Spann JF., Jr. Defective lipid metabolism in the failing heart. J Clin Invest. 1968;47:1787–1794. doi: 10.1172/JCI105868. [DOI] [PMC free article] [PubMed] [Google Scholar]
- 42.Taegtmeyer H, Overturf ML. Effects of moderate hypertension on cardiac function and metabolism in the rabbit. Hypertension. 1988;11:416–426. doi: 10.1161/01.hyp.11.5.416. [DOI] [PubMed] [Google Scholar]
- 43.Smith SH, Kramer MF, Reis I, Bishop SP, Ingwall JS. Regional changes in creatine kinase and myocyte size in hypertensive and nonhypertensive cardiac hypertrophy. Circ Res. 1990;67:1334–1344. doi: 10.1161/01.res.67.6.1334. [DOI] [PubMed] [Google Scholar]
- 44.Pound KM, Sorokina N, Ballal K, Berkich DA, Fasano M, Lanoue KF, Taegtmeyer H, O'Donnell JM, Lewandowski ED. Substrate-enzyme competition attenuates upregulated anaplerotic flux through malic enzyme in hypertrophied rat heart and restores triacylglyceride content: Attenuating upregulated anaplerosis in hypertrophy. Circ Res. 2009;104:805–812. doi: 10.1161/CIRCRESAHA.108.189951. [DOI] [PMC free article] [PubMed] [Google Scholar]
- 45.Sorokina N, O'Donnell JM, McKinney RD, Pound KM, Woldegiorgis G, LaNoue KF, Ballal K, Taegtmeyer H, Buttrick PM, Lewandowski ED. Recruitment of compensatory pathways to sustain oxidative flux with reduced carnitine palmitoyltransferase i activity characterizes inefficiency in energy metabolism in hypertrophied hearts. Circulation. 2007;115:2033–2041. doi: 10.1161/CIRCULATIONAHA.106.668665. [DOI] [PubMed] [Google Scholar]
- 46.Leong HS, Grist M, Parsons H, Wambolt RB, Lopaschuk GD, Brownsey R, Allard MF. Accelerated rates of glycolysis in the hypertrophied heart: Are they a methodological artifact? Am J Physiol Endocrinol Metab. 2002;282:E1039–E1045. doi: 10.1152/ajpendo.00507.2001. [DOI] [PubMed] [Google Scholar]
- 47.Gupte SA, Levine RJ, Gupte RS, Young ME, Lionetti V, Labinskyy V, Floyd BC, Ojaimi C, Bellomo M, Wolin MS, Recchia FA. Glucose-6-phosphate dehydrogenase-derived nadph fuels superoxide production in the failing heart. J Mol Cell Cardiol. 2006;41:340–349. doi: 10.1016/j.yjmcc.2006.05.003. [DOI] [PubMed] [Google Scholar]
- 48.Bachowski GJ, Thomas JP, Girotti AW. Ascorbate-enhanced lipid peroxidation in photooxidized cell membranes: Cholesterol product analysis as a probe of reaction mechanism. Lipids. 1988;23:580–586. doi: 10.1007/BF02535601. [DOI] [PubMed] [Google Scholar]
- 49.Courtois F, Suc I, Garofalo C, Ledoux M, Seidman E, Levy E. Iron-ascorbate alters the efficiency of caco-2 cells to assemble and secrete lipoproteins. Am J Physiol Gastrointest Liver Physiol. 2000;279:G12–G19. doi: 10.1152/ajpgi.2000.279.1.G12. [DOI] [PubMed] [Google Scholar]
- 50.Alexander D, Lombardi R, Rodriguez G, Mitchell MM, Marian AJ. Metabolomic distinction and insights into the pathogenesis of human primary dilated cardiomyopathy. Eur J Clin Invest. 2011;41:527–538. doi: 10.1111/j.1365-2362.2010.02441.x. [DOI] [PMC free article] [PubMed] [Google Scholar]
Associated Data
This section collects any data citations, data availability statements, or supplementary materials included in this article.


