

Abstract
Background
The cancer stem cell (CSC) hypothesis concludes that a subpopulation of tumor cells can self-renew, causing tumor growth, treatment failure, and recurrence. Several tumor studies have identified cells able to efflux Hoechst 33342 dye; the side population (SP). SP cells and CSCs share many characteristics, suggesting the SP isolated from malignant tumors contains CSCs.
Methods
The SP was isolated from a head and neck cancer cell line and analyzed for CSC-like characteristics.
Results
The SP demonstrated the ability to reproduce both SP and non-side population (NSP) cells from as few as one cell. The SP had lower expression of active β-catenin and more resistance to 5-Fluorouracil; the SP also demonstrated greater expression of BMI-1 (4.3-fold) and ABCG2 (1.4-fold). SPs were identified in 2 primary human tumors.
Conclusions
The SP in head and neck cancer cell lines may serve as a valuable in-vitro model for CSCs leading to the development of novel treatment strategies.
Keywords: Head and Neck Cancer, Cancer Stem Cell, Side Population, Hoechst 33342, BMI-1
Introduction
Head and neck cancer is a common malignancy that affects approximately 40,000 new patients in the United States each year(1). Despite advances in therapy, which have improved quality of life, survival rates have remained static for many years. It is essential that we develop a deeper understanding of the biology of this disease in order to develop more effective therapies.
A cancer stem cell (CSC) is a cell within a tumor that possesses the capability to self-renew along with the ability to generate the heterogeneous lineages of cancer cells that comprise the tumor(2, 3). Evidence has been accumulating that supports the validity of the CSC theory in a number of human malignancies(2),(4, 5),(6),(7),(8),(9),(10),(11). Recent studies of solid tumors have isolated tumorigenic subpopulations of cancer cells based on their expression of various cell surface markers. Breast cancer cells that were CD44+/CD24− and central nervous system cancer cells that expressed CD133 were able to initiate tumors in NOD/SCID mice from as few as one hundred cells, as opposed to tens of thousands of cells with different markers(12),(13, 14).
Recently the cell surface marker CD44 was shown to select a tumorigenic subpopulation of cells in head and neck squamous cell carcinoma (HNSCC). As few as 5000 CD44+ tumor cells gave rise to xenograft tumors in NOD/SCID mice, while up to 5×10⁵ CD44− tumor cells did not. Tumors resulting from injection of CD44+ cells reproduced the original tumor heterogeneity, even after serial passages in the animal model, suggesting that the CD44+ population contains the CSC(15).
Goodell et al, reported that a small population of bone marrow cells with an elevated capacity to efflux the vital DNA binding dye Hoechst 33342, could be isolated by flow cytometry. This ability has been attributed to the increased expression of multiple drug resistance transporter proteins such as ABCG2. These cells were termed side population (SP) cells and found to have stem cell-like characteristics such as a 1,000-fold increase in hematopoietic stem cell (HSC) activity following transplantation into lethally irradiated hosts(16). SP cells have now been identified in many normal tissues such as muscle, liver, lung, retina, testes, pancreas, heart, epithelium, and breast, leading many to suggest that the SP phenotype may represent a universal stem cell marker(17–28).
SP cells isolated from cancer cells lines often have stem cell-like characteristics(29–35). Chiba et al, found that as few as 1000 SP cells from a hepatocellular carcinoma cell line could initiate a tumor, as compared to non-SP (NSP) cells, which had at least 1000-fold reduced tumorgenicity. Szotec et al, identified a SP in a murine ovarian cancer cell line, that was resistant to doxorubicin and in G1 arrest(35). The SP component of the rat C6 glioma cell line was found to be largely responsible for its in vivo malignancy(29).
Cell lines can provide an essentially unlimited supply of cancer cells, whereas primary cancer cells obtained from patients represent a very limited resource. The ability to identify CSC in HNSCC cell lines will greatly enhance our ability to study this critical population of cells. The aim of this study was to identify SP cells in an established HNSCC cell line, and determine if these cells had cancer stem cell-like properties.
Materials and Methods
Cell Culture
UM-SCC-10B is a HNSCC cell line derived from a local recurrence of a true vocal fold cancer that developed one year after radiation therapy. Cells were grown in Dulbecco’s modified Eagle’s medium (DMEM, Invitrogen, Carlsbad, CA) containing 2 mmol/L L-glutamine, 1% nonessential amino acids, 1% penicillin-streptomycin (Invitrogen), and 10% fetal bovine serum (FBS) in a humidified atmosphere of 5% CO2 at 37°C.
Hoechst 33342 Dye exclusion assay
Cells were detached from the culture flask with Trypsin-EDTA (Invitrogen), washed with culture media, and then suspended in DMEM-2% heat inactivated calf serum (HICS) at a concentration of 1 ×10⁶/mL at 37° C. Verapamil hydrochloride (Sigma-Aldrich, St. Louis, MO) was added to control samples at a concentration of 50mM. Samples were then incubated with Hoechst 33342 (Sigma-Aldrich) at a concentration of 5μg/mL for 1 hour at 37° C. Following incubation, cells were washed, suspended in Hank’s Balanced Salt Solution (HBSS, Invitrogen) with 2% HICS at 1 × 10⁶ cells/mL and kept at 4° C. Propridium iodide (BD Biosciences, San Diego, CA) was added at a concentration of 2μg/mL to exclude dead cells during flow cytometry. Cells were filtered with a 40 μm cell strainer (BD Biosciences) to ensure a single cell suspension. Cells were analyzed and sorted using the fluorescence-activated cell sorting (FACS)-Vantage SE (BD Biosciences). Hoechst 33342 was excited with the UV laser at 350 nm, and fluorescence emission was measured with DF424/44 (Hoechst blue) and DF630/22 (Hoechst red) optical filters.
Serum Free Culture
Cells were cultured in 6-well ultra-low attachment plates (Corning 3471, Corning, NY) at a concentration of 10,000 cells/mL in DMEM/F12 supplemented with B27 (Invitrogen, Carlsbad, CA), 20 ng/mL EGF (BD Biosciences), antibiotic-antimycotic (100 unit/ml penicillin G sodium, 100 ug/ml streptomycin sulfate and 0.25 ug/ml amphotericin B) (Invitrogen), 20 ug/ml Gentamycin, 1 ng/ml Hydrocortisone, 5 ug/ml Insulin and 100 μM 2-mercaptoethanol in a humidified incubator (5% CO2: 95% air, 37°C). Spherical clusters of cells were dissociated with Trypsin-EDTA (Invitogen), and washed with HBSS-2% HICS before undergoing the Hoechst dye exclusion protocol described above.
Chemosensitivity [3-(4,5-Dimethylthiazol-2-yl)-2,5-Diphenyltetrazolium Bromide] (MTT) Assay
Following FACS, cells were washed, counted, and plated at 7,000 cells per well in triplicate wells of 96-well plates and incubated in DMEM-10% FBS at 37°C overnight. The next morning, cells were incubated with 5-fluorouracil (5-FU, Sigma-Aldrich) at increasing concentrations (0, 10, 30, 100, and 1000 μg/mL) for 2 hours, washed twice with culture media, then incubated in 300 μL DMEM-10% FBS for 6 days. The media was removed from the wells, and 100 μL DMEM along with 10 μL MTT labeling reagent was added to each well. After a 4-hour incubation, 100 μL of solubilization buffer was added, and the plates were incubated at 37°C overnight. The absorbance (OD) of each well was determined with a spectrophotometer at a wavelength of 590 nm. Absorbance at 590 nm is directly proportional to viable cell number. The absorbance was plotted on a logarithmic graph of absorbance (y-axis) against drug concentration (x-axis). The 50% inhibitory concentrations (IC50) were identified as the concentration of 5-FU required to achieve 50% growth inhibition (i.e., 50% reduction in absorbance relative to no 5-FU control).
Quantitative real-time polymerase chain reaction (PCR)
Following FACS, cells were washed twice with phosphate buffered saline (PBS, GIBCO) before RNA was extracted and purified using the RNeasy Mini kit (Qiagen, Valencia, CA), according to the manufacturer’s protocol. The concentration and purity of RNA were determined by a NanoDrop ND-1000 (NanoDrop Technologies, Wilmington, DE) spectrophotometer and Agilent 2100 Bioanalyzer (Agilent Technologies, Palo Alto, CA). cDNA was reverse transcribed with the Promega Reverse Transcription System (Promega, Madison, WI) using random hexamers. The in-vitro transcription product was purified using the QIAquick PCR Purification Kit (Qiagen) and concentration was determined with the NanoDrop ND-1000 spectrophotometer. Quantitative real-time PCR was carried out on an ABI Prism 7900HT Sequence Detection System (Applied Biosytems, Foster City, CA). Primers sets purchased from SuperArray (SuperArray Bioscience Corporation, Frederick, MD) included those for the quantification of Bmi-1, ABCG2 and Glyceraldehyde-3-phosphate dehydrogenase (GAPDH) (SuperArray, PPH57778A, PPH01526A and PPH00150A). PCR was performed with 12.5 μL RT² Real-Time™ SYBR Green PCR Master Mix (SuperArray), 1 μL primer set, 1 μL cDNA template, and 10.5 μL H2O. Thermocycling was performed as follows: 95°C for 15 minutes, 40 cycles of 95°C for 30 seconds, 55°C for 30 seconds and 72°C for 30 seconds. Relative quantification (fold-difference) of the expression levels of mRNA in each group was calculated by the 2−ΔΔCT method(36). Gene expression data was normalized to GAPDH.
Immunoflouresence Microscopy
Immediately following FACS, 10,000 cells from each group were suspended in 200 μL DMEM and cytospun onto slides. Cells were fixed in 95% methanol for 15 minutes at −20 degrees Celsius, washed with PBS and permeabilized with 0.1% Triton x-100 in PBS for 5 minutes. Non-specific binding was blocked with a 30-minute incubation with PBS-1% bovine serum albumin (BSA). Cells were incubated with primary mouse monoclonal antibodies to active-β-catenin (anti-ABC, clone 8E7, Upstate, Lake Placid, NY) or Bmi-1 (anti-BMI-1, clone F6, Upstate) at 1:200 and 1:300 dilutions in PBS-1% BSA for 1 hour at room temperature. Cells were washed with PBS and then incubated with goat anti-mouse Alexa Fluor 488 (Invitrogen) secondary antibody at a 1:2000 dilution in PBS-1% BSA for 1 hour at room temperature. Cells were then washed with PBS and incubated with 4′,6-diamidino-2-phenylindole (DAPI) at a 1:5000 dilution for 1 minute at room temperature. Coverslips were mounted on slides using ProLong Gold antifade reagent (Invitrogen). Cells were examined and photographed using a Carl Zeiss confocal laser scanning microscope.
Protein Extraction and Western Blot Analysis
Following FACS, protein extracts were prepared by lysing cells in a solution of PBS containing 1% NP-40 (Sigma; St. Louis, MO), 1 mmol/L phenylmethylsulfonyl fluoride (Sigma), and a cocktail of protease inhibitors (Boehringer Mannheim, Germany). Total protein from cell extracts was quantified using a colorimetric assay (Bradford Reagent; Bio-Rad, Hercules, CA). For Western blotting, protein (25 μg) was electrophoresed on 12% Tris-glycine SDS-polyacrylamide gels under denaturing conditions, and transferred to Hybond-P polyvinylidene difluoride membranes (Amersham Pharmacia Biotech, Buckinghamshire, England). Membranes were blocked in Tris-buffered saline plus 0.05% Tween containing 5% nonfat dry milk at room temperature for 1 hour followed by incubation for 3 hours with primary mouse monoclonal antibodies to active-β-catenin (anti-ABC, clone 8E7, Upstate) (1μg/ml), Bmi-1 (anti-BMI-1, clone F6, Upstate) (1μg/ml) or GAPDH (Chemicon International, Temecula, CA) (1:10,000 dilution). Membranes were then incubated for 1 hour with a secondary horseradish peroxidase-conjugated sheep anti-mouse antibody (Amersham) and analyzed using the Enhanced Chemiluminescence Plus reagent (Amersham) by exposing membranes to chemiluminescence film (Biomax Light Film, Kodak, Rochester, NY).
Primary Tumor Digestion
Informed consent was obtained from patients undergoing surgical resection of their head and neck tumors. Immediately following resection, tumors were cut into small fragments with sterile scissors and minced with a sterile scalpel. The tumor pieces were rinsed with HBSS-2% HICS and centrifuged for 5 min at 1000 rpm. The tissue was placed in a solution of DMEM/F-12 containing 300U/mL collagenase and 100U/mL hyaluronidase (Stem Cell Technologies, Vancouver, Canada). The mixture was incubated at 37°C and gently agitated to dissociate the cells. The digestion was arrested with the addition of FBS and cells were filtered through a 40 μm cell strainer to allow the passage of only single cells. The cells were washed twice with HBSS-2% HICS and stained for flow cytometry as described above.
Results
Hoechst 33342 dye exclusion assay
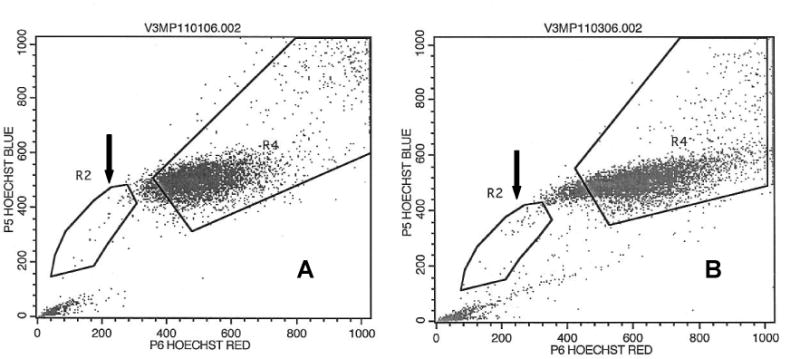
Using the methods described above we were able to consistently identify a SP in the cell line UM-SCC-10B comprising 2.46% ± 1.87% of the total cell population. The SP’s ability to exclude the dye was inhibited by verapamil hydrochloride and this was used to differentiate the SP from the non-side population (NSP). SP and NSP gates were created and used for FACS (Figure 1).
Figure 1.
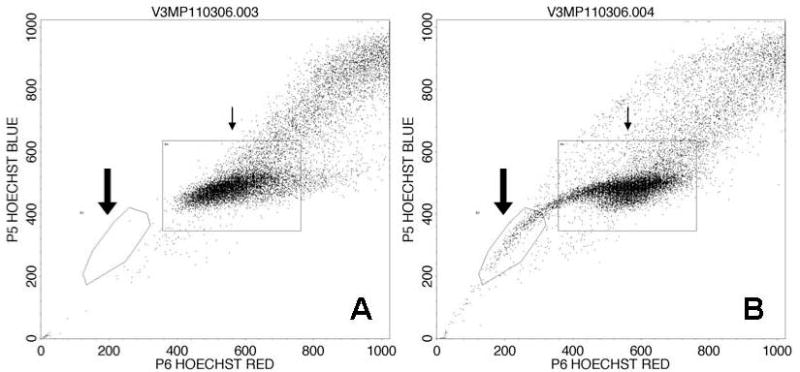
Flow cytogram of UM-SCC-10B following Hoechst 33342 staining. A: No side population is seen when dye efflux is inhibited with verapamil. B: In the absence of the inhibitor, a side population with low Hoechst 33342 staining is resolved, comprising 2.6% of the cell line (large arrow). The small arrow points to the NSP.
Ability of the SP to reproduce the entire cell line phenotype
SP cells were sorted, collected and transferred to tissue culture flasks. The cells were expanded until approximately 1 × 10⁶ cells were obtained. Analysis by flow cytometry demonstrated that the SP was able to reproduce the entire cell line phenotype including both SP and NSP cells. When single SP cells were sorted into 96-well plates and allowed to expand from these clones they were also found to be capable of reproducing the original cell line heterogeneity.
Growth in a serum-free, non adherent environment
Cells cultured in serum-free media in ultra-low attachment plates formed multiple spherical colonies. Analysis after Hoechst staining revealed that the SP increased to 28.3%, a 5.8-fold enrichment when compared to a SP of 4.9% in a group of cells growing in a parallel flask in a traditional adherent environment, with standard, serum containing, media (Figure 2).
Figure 2.
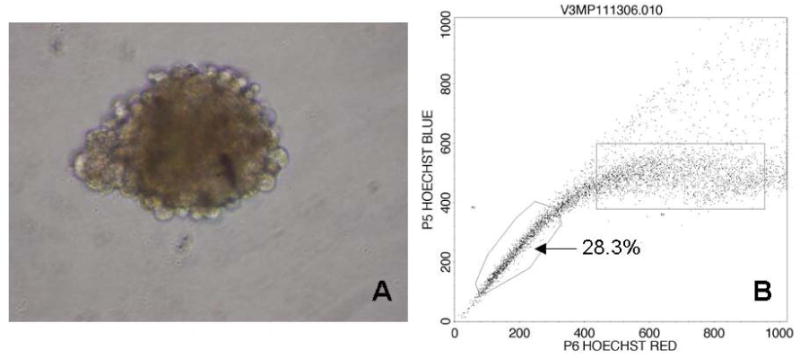
Cells formed spheres when grown in serum-free, non-adherent culture (A). The SP increased to 28.3%, a 5.8-fold enrichment when grown in this environment (B).
Chemosensitivity Assay
The SP was more resistant to 5-FU than the NSP or unsorted cells. The SP had an IC50 of 26.1 μg/ml, almost twice that of the NSP, 13.1 μg/ml or unsorted cells, 15.8 μg/ml (Figure 3).
Figure 3.
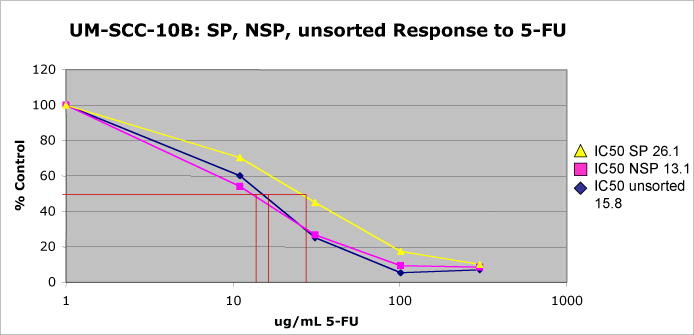
The SP was more resistant to 5-FU than the NSP or unsorted cells. The SP had an IC50 of 26.1 μg/ml which was almost twice that of the NSP, 13.1 μg/ml or unsorted cells, 15.8 μg/ml.
Protein Expression
Western blot and immunocytochemistry demonstrated that the SP had lower levels of active β-catenin as compared to the NSP (Figure 4). Immunocytochemisty also showed higher levels of Bmi-1 in the SP as compared to the NSP.
Figure 4.
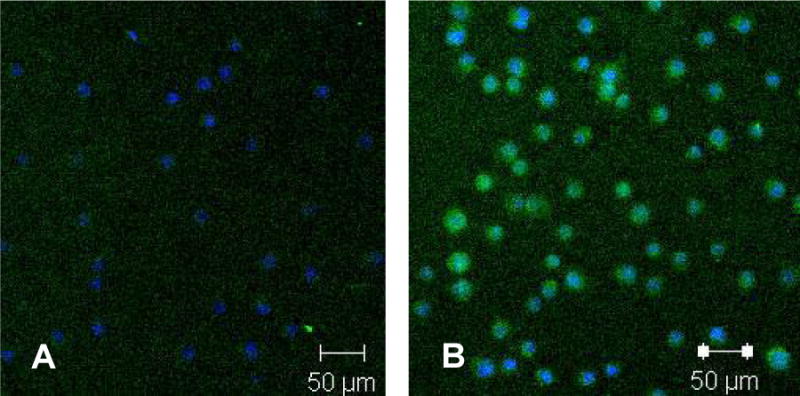
Confocal laser scanning microscopy demonstrating that the SP (A) has lower levels of active β-catenin (green - Alexa Fluor 488) than the NSP (B). Blue color represents DAPI nuclear stain.
Gene Expression
The SP expressed higher levels of the genes Bmi-1 and ABCG2 relative to the NSP by real-time quantitative PCR (Figure 5).
Figure 5.
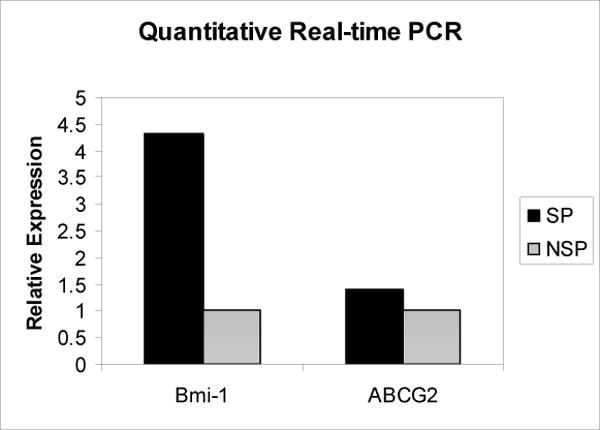
Relative expression of Bmi-1(4.32) and ABCG2 (1.41) in the SP compared to the NSP
Identification of side populations in fresh human head and neck tumors
Tissue was collected from two patients undergoing tumor resection. Following digestion and creation of a single cell suspension, the cells were stained with Hoechst dye and FACS analysis performed. A SP was found in both tumors, comprising 0.54% and 0.59% of the total cell population (Figure 6).
Figure 6.
A SP was identified in two primary head and neck squamous cell carcinoma specimens. The SP (arrows) made up (A) 0.54% and (B) 0.49% of the total cell population.
Discussion
The cancer stem cell theory has important implications to our understanding of cancer biology. Understanding the molecular mechanisms responsible for CSC behavior is crucial to the development of novel treatment strategies. CSC have been identified and isolated from primary human tumors, but to our knowledge there have not been any reports of culturing these cells and keeping them in an undifferentiated state. The relatively small size of head and neck tumors, along with the small percentage of CSC within a tumor, makes CSC from primary tumors a precious and limited experimental resource. An in vitro model for HNSCC CSC is desperately needed to further study the biology and role of CSC in this devastating disease. We have identified and consistently isolated a small subpopulation of cells from a well established HNSCC cell line that has stem cell-like properties. We believe that the SP will prove to be a useful model for in-vivo and in-vitro studies of head and neck CSC.
The SP we identified was able to reproduce the entire cancer cell line FACS phenotype from as few a one cell. When expanded and re-analyzed, the SP fraction was enriched but continued to make up only a small population of the entire cell line, suggesting that the SP cell represents a multipotent cell with the potential to undergo asymmetrical cell division. This behavior is consistent with the hierarchical CSC model in which a multipotent cell gives rise to both copies of itself, and to more differentiated progenitors.
Serum-free growth environments have been used to culture neural and mammary stem cells, grown as spheres and termed “neurospheres” or “mammospheres”(37–42). Epithelial cells are typically dependent upon substrate attachment for survival. The ability to survive in suspension and avoid anoikis and differentiation is thought to be a characteristic of stem cells. We placed single cell suspensions of UM-SCC-10B in serum-free media in non-adherent plates, specifically designed to inhibit attachment, and observed the cells growing in spheres which we termed “squamospheres”. We saw a 5.8-fold increase in the fraction of cells comprising the SP when using this method of culture. We hypothesize that deficiency of serum growth factors and inhibition of attachment encourages the growth of SP cells with their stem-cell like phenotype.
The SP was more resistant to the chemotherapeutic agent 5-FU, a drug important in head and neck cancer treatment regimens. 5-FU exerts its anticancer effects through inhibition of thymidylate synthase and incorporation of its metabolites into RNA and DNA, inhibiting DNA synthesis and inducing cell death(43). The drug targets cycling cells that are actively synthesizing DNA, cells that make up the bulk of a tumor. A CSC on the other hand, should be relatively quiescent when compared to a rapidly proliferating progenitor cell. Similar findings have been seen in Zebrafish kidney marrow SP cells exhibiting HSC properties, where the SP was more resistant to 5-FU(44). Wang et al, were able to show that 5FU resistant cell lines had down-regulation of cell cycle related genes and delayed passage through S-phase. A greater proportion of 5FU resistant cells were found in G1 or at the G1-S boundary and exhibited slower growth rates(45), as would be expected of stem cells.
β-catenin is a central component of the canonical Wnt signaling pathway, wherein Wnt ligands bind to the Frizzled receptor, eventually leading to nuclear translocation of active β-catenin and expression of downstream targets. Such targets include, c-myc, cyclin D, VEGF and FGF, genes that drive cell differentiation and division. Our results indicate that the SP expresses lower levels of active β-catenin compared to the NSP This data is consistent with our finding of greater sensitivity of the NSP to 5-FU, where increased nuclear translocation of acitve β-catenin drives DNA synthesis and cell proliferation, exposing the cell to the toxic effects of a drug such as 5-FU.
Bmi-1 functions as a transcriptional repressor of the senescence inducing gene, p16Ink4a, and has been implicated in the self-renewal of stem cells(46, 47). Molofsky et al, was able to show that in the absence of Bmi-1, p16Ink4a is up-regulated in neural stem cells, reducing their rate of proliferation(48). Park et al, showed that in Bmi-1 deficient mice, the number of HSCs was markedly reduced(49). Our lab previously isolated a tumorigenic subpopulation from primary head and neck tumors that were selected based on expression of CD44. This population over-expressed Bmi-1 and is thought to contain the cancer CSC(15). These data led us to believe that potential candidates for HNSCC cancer stem cells should have higher expression of Bmi-1. Our results demonstrated a 4.3-fold increase in Bmi-1 within the SP, lending support to the conclusion that the SP shares cancer-stem cell-like properties.
ABCG2 or breast cancer resistance protein-1 (BCRP1) is a 70 kDa ATP-Binding Cassette membrane transport protein, involved in multiple drug resistance by its ability to pump out various drugs. This pump can also actively pump out the DNA binding dye Hoechst 33342, giving cells with higher expression a lower fluorescence profile and therefore the characteristic SP phenotype(16). It may be advantageous for a long-lived cell such as a stem cell to have higher expression of ABCG2. Cytotoxic agents could be transported out of the cell before causing DNA damage that would be detrimental to a stem cell, as opposed to a more differentiated cell with limited proliferative potential. We have demonstrated a 1.4-fold increase in expression of ABCG2 in the SP, a characteristic expected of CSC. We suspect that other, yet unidentified, drug transporters may also be involved in generating the SP phenotype of this cell line, as the observed over-expression of ABCG2 is somewhat less than expected.
In preliminary work, we have identified SPs in two primary HNSCC tumor specimens. Further characterization of these cells is underway in our laboratory to determine if the SP in primary tumors is enriched for CSC activity. We have established a xenograft model(15) that will be the basis for future investigations of the tumoriginicity of these SP cells. The cell line UM-SCC-10B has a SP with characteristics in common with those expected of CSC; therefore, we hypothesize that the SP in primary tumors will share those characteristics.
Currently, there are no methods for culturing head and neck CSC and maintaining them in an undifferentiated state, which seriously limits our ability to study these cells and develop new treatments targeting CSC. The SP in head and neck cancer cell lines may serve as a useful method for studying the biology of CSC, and lead the way to more effective therapy for this devastating disease.
Acknowledgments
The authors would like to acknowledge J. Chad Brenner, M.S.E. for his technical assistance and intellectual contribution to this work.
Grant Support:
This work was supported by the University of Michigan SPORE in Head and Neck Cancer: P50 CA 097248, the Kirschstein National Research Service Award (NRSA) in Advanced Research Training in Otolaryngology: 5 T32 DC005356 and Patricia Korican of Korican Real Estate.
Footnotes
Presentations:
This work was presented as an oral presentation at the American Head and Neck Society Annual meeting, April 29, 2007, San Diego, California.
References
- 1.Jain S, Khuri FR, Shin DM. Prevention of head and neck cancer: current status and future prospects. Curr Probl Cancer. 2004;28(5):265–86. doi: 10.1016/j.currproblcancer.2004.05.003. [DOI] [PubMed] [Google Scholar]
- 2.Wicha MS, Liu S, Dontu G. Cancer stem cells: an old idea–a paradigm shift. Cancer Res. 2006;66(4):1883–90. doi: 10.1158/0008-5472.CAN-05-3153. discussion 1895–6. [DOI] [PubMed] [Google Scholar]
- 3.Clarke MF, Dick JE, Dirks PB, et al. Cancer Stem Cells–Perspectives on Current Status and Future Directions: AACR Workshop on Cancer Stem Cells. Cancer Res. 2006;66(19):9339–44. doi: 10.1158/0008-5472.CAN-06-3126. Epub 2006 Sep 21. [DOI] [PubMed] [Google Scholar]
- 4.Bonnet D, Dick JE. Human acute myeloid leukemia is organized as a hierarchy that originates from a primitive hematopoietic cell. Nat Med. 1997;3(7):730–7. doi: 10.1038/nm0797-730. [DOI] [PubMed] [Google Scholar]
- 5.Golub TR. Genome-Wide Views of Cancer. N Engl J Med. 2001;344(8):601–602. doi: 10.1056/NEJM200102223440809. [DOI] [PubMed] [Google Scholar]
- 6.Reya T, Morrison SJ, Clarke MF, Weissman IL. Stem cells, cancer, and cancer stem cells. Nature. 2001;414(6859):105–111. doi: 10.1038/35102167. [DOI] [PubMed] [Google Scholar]
- 7.Pardal R, Clarke MF, Morrison SJ. Applying the principles of stem-cell biology to cancer. Nat Rev Cancer. 2003;3(12):895–902. doi: 10.1038/nrc1232. [DOI] [PubMed] [Google Scholar]
- 8.Al-Hajj M, Clarke MF. Self-renewal and solid tumor stem cells. Oncogene. 2004;23(43):7274–82. doi: 10.1038/sj.onc.1207947. [DOI] [PubMed] [Google Scholar]
- 9.Tai M-H, Chang C-C, Olson LK, Trosko JE. Oct4 expression in adult human stem cells: evidence in support of the stem cell theory of carcinogenesis. Carcinogenesis. 2005;26(2):495–502. doi: 10.1093/carcin/bgh321. [DOI] [PubMed] [Google Scholar]
- 10.Owens DM, Watt FM. Contribution of stem cells and differentiated cells to epidermal tumours. Nat Rev Cancer. 2003;3(6):444–51. doi: 10.1038/nrc1096. [DOI] [PubMed] [Google Scholar]
- 11.Li C, Heidt DG, Dalerba P, et al. Identification of Pancreatic Cancer Stem Cells. Cancer Res. 2007;67(3):1030–1037. doi: 10.1158/0008-5472.CAN-06-2030. [DOI] [PubMed] [Google Scholar]
- 12.Al-Hajj M, Wicha MS, Benito-Hernandez A, Morrison SJ, Clarke MF. From the Cover: Prospective identification of tumorigenic breast cancer cells. PNAS. 2003;100(7):3983–3988. doi: 10.1073/pnas.0530291100. [DOI] [PMC free article] [PubMed] [Google Scholar]
- 13.Singh SK, Clarke ID, Terasaki M, et al. Identification of a Cancer Stem Cell in Human Brain Tumors. Cancer Res. 2003;63(18):5821–5828. [PubMed] [Google Scholar]
- 14.Singh SK, Hawkins C, Clarke ID, et al. Identification of human brain tumour initiating cells. Nature. 2004;432(7015):396–401. doi: 10.1038/nature03128. [DOI] [PubMed] [Google Scholar]
- 15.Prince ME, Sivanandan R, Kaczorowski A, et al. Identification of a subpopulation of cells with cancer stem cell properties in head and neck squamous cell carcinoma. PNAS. 2007;104(3):973–978. doi: 10.1073/pnas.0610117104. [DOI] [PMC free article] [PubMed] [Google Scholar]
- 16.Goodell MA, Brose K, Paradis G, Conner AS, Mulligan RC. Isolation and functional properties of murine hematopoietic stem cells that are replicating in vivo. J Exp Med. 1996;183(4):1797–806. doi: 10.1084/jem.183.4.1797. [DOI] [PMC free article] [PubMed] [Google Scholar]
- 17.Zhou S, Schuetz JD, Bunting KD, et al. The ABC transporter Bcrp1/ABCG2 is expressed in a wide variety of stem cells and is a molecular determinant of the side-population phenotype. Nat Med. 2001;7(9):1028–34. doi: 10.1038/nm0901-1028. [DOI] [PubMed] [Google Scholar]
- 18.Asakura A, Seale P, Girgis-Gabardo A, Rudnicki MA. Myogenic specification of side population cells in skeletal muscle. J Cell Biol. 2002;159(1):123–34. doi: 10.1083/jcb.200202092. Epub 2002 Oct 14. [DOI] [PMC free article] [PubMed] [Google Scholar]
- 19.Bhattacharya S, Jackson JD, Das AV, et al. Direct identification and enrichment of retinal stem cells/progenitors by Hoechst dye efflux assay. Invest Ophthalmol Vis Sci. 2003;44(6):2764–73. doi: 10.1167/iovs.02-0899. [DOI] [PubMed] [Google Scholar]
- 20.Jonker JW, Freeman J, Bolscher E, et al. Contribution of the ABC transporters Bcrp1 and Mdr1a/1b to the side population phenotype in mammary gland and bone marrow of mice. Stem Cells. 2005;23(8):1059–65. doi: 10.1634/stemcells.2005-0150. Epub 2005 Jul 7. [DOI] [PubMed] [Google Scholar]
- 21.Lassalle B, Bastos H, Louis JP, et al. ‘Side Population’ cells in adult mouse testis express Bcrp1 gene and are enriched in spermatogonia and germinal stem cells. Development. 2004;131(2):479–487. doi: 10.1242/dev.00918. [DOI] [PubMed] [Google Scholar]
- 22.Summer R, Kotton DN, Sun X, Ma B, Fitzsimmons K, Fine A. Side population cells and Bcrp1 expression in lung. Am J Physiol Lung Cell Mol Physiol. 2003;285(1):L97–104. doi: 10.1152/ajplung.00009.2003. [DOI] [PubMed] [Google Scholar]
- 23.Hussain SZ, Strom SC, Kirby MR, et al. Side population cells derived from adult human liver generate hepatocyte-like cells in vitro. Dig Dis Sci. 2005;50(10):1755–63. doi: 10.1007/s10620-005-2933-x. [DOI] [PMC free article] [PubMed] [Google Scholar]
- 24.Shimano K, Satake M, Okaya A, et al. Hepatic Oval Cells Have the Side Population Phenotype Defined by Expression of ATP-Binding Cassette Transporter ABCG2/BCRP1. Am J Pathol. 2003;163(1):3–9. doi: 10.1016/S0002-9440(10)63624-3. [DOI] [PMC free article] [PubMed] [Google Scholar]
- 25.Lechner A, Leech CA, Abraham EJ, Nolan AL, Habener JF. Nestin-positive progenitor cells derived from adult human pancreatic islets of Langerhans contain side population (SP) cells defined by expression of the ABCG2 (BCRP1) ATP-binding cassette transporter. Biochem Biophys Res Commun. 2002;293(2):670–4. doi: 10.1016/S0006-291X(02)00275-9. [DOI] [PubMed] [Google Scholar]
- 26.Martin CM, Meeson AP, Robertson SM, et al. Persistent expression of the ATP-binding cassette transporter, Abcg2, identifies cardiac SP cells in the developing and adult heart. Dev Biol. 2004;265(1):262–75. doi: 10.1016/j.ydbio.2003.09.028. [DOI] [PubMed] [Google Scholar]
- 27.Oyama T, Nagai T, Wada H, et al. Cardiac side population cells have a potential to migrate and differentiate into cardiomyocytes in vitro and in vivo. J Cell Biol. 2007;176(3):329–41. doi: 10.1083/jcb.200603014. [DOI] [PMC free article] [PubMed] [Google Scholar]
- 28.Budak MT, Alpdogan OS, Zhou M, Lavker RM, Akinci MA, Wolosin JM. Ocular surface epithelia contain ABCG2-dependent side population cells exhibiting features associated with stem cells. J Cell Sci. 2005;118(Pt 8):1715–24. doi: 10.1242/jcs.02279. [DOI] [PMC free article] [PubMed] [Google Scholar]
- 29.Kondo T, Setoguchi T, Taga T. Persistence of a small subpopulation of cancer stem-like cells in the C6 glioma cell line. Proc Natl Acad Sci U S A. 2004;101(3):781–6. doi: 10.1073/pnas.0307618100. Epub 2004 Jan 7. [DOI] [PMC free article] [PubMed] [Google Scholar]
- 30.Hirschmann-Jax C, Foster AE, Wulf GG, et al. A distinct “side population” of cells with high drug efflux capacity in human tumor cells. Proc Natl Acad Sci U S A. 2004;101(39):14228–33. doi: 10.1073/pnas.0400067101. Epub 2004 Sep 20. [DOI] [PMC free article] [PubMed] [Google Scholar]
- 31.Mitsutake N, Iwao A, Nagai K, et al. Characterization of Side Population in Thyroid Cancer Cell Lines: Cancer Stem-Like Cells Are Enriched Partly But Not Exclusively. Endocrinology. 2007;148(4):1797–1803. doi: 10.1210/en.2006-1553. [DOI] [PubMed] [Google Scholar]
- 32.Chiba T, Kita K, Zheng YW, et al. Side population purified from hepatocellular carcinoma cells harbors cancer stem cell-like properties. Hepatology. 2006;44(1):240–51. doi: 10.1002/hep.21227. [DOI] [PubMed] [Google Scholar]
- 33.Haraguchi N, Utsunomiya T, Inoue H, et al. Characterization of a Side Population of Cancer Cells from Human Gastrointestinal System. Stem Cells. 2006;24(3):506–513. doi: 10.1634/stemcells.2005-0282. [DOI] [PubMed] [Google Scholar]
- 34.Kruger JA, Kaplan CD, Luo Y, et al. Characterization of stem cell-like cancer cells in immune-competent mice. Blood. 2006;108(12):3906–3912. doi: 10.1182/blood-2006-05-024687. [DOI] [PubMed] [Google Scholar]
- 35.Szotek PP, Pieretti-Vanmarcke R, Masiakos PT, et al. Ovarian cancer side population defines cells with stem cell-like characteristics and Mullerian Inhibiting Substance responsiveness. PNAS. 2006;103(30):11154–11159. doi: 10.1073/pnas.0603672103. [DOI] [PMC free article] [PubMed] [Google Scholar]
- 36.Livak KJ, Schmittgen TD. Analysis of relative gene expression data using real-time quantitative PCR and the 2(-Delta Delta C(T)) Method. Methods. 2001;25(4):402–8. doi: 10.1006/meth.2001.1262. [DOI] [PubMed] [Google Scholar]
- 37.Wachs FP, Couillard-Despres S, Engelhardt M, et al. High efficacy of clonal growth and expansion of adult neural stem cells. Lab Invest. 2003;83(7):949–62. doi: 10.1097/01.lab.0000075556.74231.a5. [DOI] [PubMed] [Google Scholar]
- 38.Jensen JB, Parmar M. Strengths and limitations of the neurosphere culture system. Mol Neurobiol. 2006;34(3):153–61. doi: 10.1385/MN:34:3:153. [DOI] [PubMed] [Google Scholar]
- 39.Reynolds BA, Tetzlaff W, Weiss S. A multipotent EGF-responsive striatal embryonic progenitor cell produces neurons and astrocytes. J Neurosci. 1992;12(11):4565–4574. doi: 10.1523/JNEUROSCI.12-11-04565.1992. [DOI] [PMC free article] [PubMed] [Google Scholar]
- 40.Reynolds BA, Weiss S. Clonal and population analyses demonstrate that an EGF-responsive mammalian embryonic CNS precursor is a stem cell. Dev Biol. 1996;175(1):1–13. doi: 10.1006/dbio.1996.0090. [DOI] [PubMed] [Google Scholar]
- 41.Liu S, Dontu G, Mantle ID, et al. Hedgehog Signaling and Bmi-1 Regulate Self-renewal of Normal and Malignant Human Mammary Stem Cells. Cancer Res. 2006;66(12):6063–6071. doi: 10.1158/0008-5472.CAN-06-0054. [DOI] [PMC free article] [PubMed] [Google Scholar]
- 42.Dontu G, Abdallah WM, Foley JM, et al. In vitro propagation and transcriptional profiling of human mammary stem/progenitor cells. Genes Dev. 2003;17(10):1253–1270. doi: 10.1101/gad.1061803. [DOI] [PMC free article] [PubMed] [Google Scholar]
- 43.Longley DB, Harkin DP, Johnston PG. 5-FLUOROURACIL: MECHANISMS OF ACTION AND CLINICAL STRATEGIES. Nature Reviews Cancer. 2003;3(5):330–338. doi: 10.1038/nrc1074. [DOI] [PubMed] [Google Scholar]
- 44.Tsinkalovsky O, Vik-Mo AO, Ferreira S, Laerum OD, Fjose A. Zebrafish kidney marrow contains ABCG2-dependent side population cells exhibiting hematopoietic stem cell properties. Differentiation. 2007;75(3):175–183. doi: 10.1111/j.1432-0436.2006.00130.x. [DOI] [PubMed] [Google Scholar]
- 45.Wang W, Cassidy J, O’Brien V, Ryan KM, Collie-Duguid E. Mechanistic and Predictive Profiling of 5-Fluorouracil Resistance in Human Cancer Cells. Cancer Res. 2004;64(22):8167–8176. doi: 10.1158/0008-5472.CAN-04-0970. [DOI] [PubMed] [Google Scholar]
- 46.Park I-K, Morrison SJ, Clarke MF. Bmi1, stem cells, and senescence regulation. J Clin Invest. 2004;113(2):175–179. doi: 10.1172/JCI20800. [DOI] [PMC free article] [PubMed] [Google Scholar]
- 47.Valk-Lingbeek ME, Bruggeman SW, van Lohuizen M. Stem cells and cancer; the polycomb connection. Cell. 2004;118(4):409–18. doi: 10.1016/j.cell.2004.08.005. [DOI] [PubMed] [Google Scholar]
- 48.Molofsky AV, Pardal R, Iwashita T, Park I-K, Clarke MF, Morrison SJ. Bmi-1 dependence distinguishes neural stem cell self-renewal from progenitor proliferation. Nature. 2003;425(6961):962–967. doi: 10.1038/nature02060. [DOI] [PMC free article] [PubMed] [Google Scholar]
- 49.Park I-k, Qian D, Kiel M, et al. Bmi-1 is required for maintenance of adult self-renewing haematopoietic stem cells. Nature. 2003;423(6937):302–305. doi: 10.1038/nature01587. [DOI] [PubMed] [Google Scholar]